This Week at MANIFEST (1/27/2017)
A financial advisor I know describes the reality of investing money by saying, “Hope for the best and be prepared for the worst.” With almost every decision we make in life there is uncertainty about the outcome. Close. But my preference would be for “[Prepare With] the BEST to be prepared for the worst.” That’s a pretty good nutshell for quality-driven growth investing — WITH YOUR FRIENDS.
Better Conspiracy
One of the more powerful — and enabling — things that we do as a community is DISCOVER and share ideas that have the potential for better returns. Better returns enable better futures. These futures are often very altruistic and philanthropic and I love the generosity I’ve witnessed over the last few decades working with so many of you.
A new acquaintance recently asked me what I do. I thought for a moment and responded, “I conspire.” His eyebrows lifted and I continued, “I conspire with a community of successful long-term investors to experience (and share) the rewards of long-term investing with those who seek it.” “I conspire to reinforce patience and discipline where necessary because this journey is often challenging.” “Our cornerstone is over seven decades of doing this, learning from and leaning on each other, to pursue the methods and deploy them among friends and family.” “I conspire.” “Because there are legions of doubters who would tell us that this is not possible, too risky … and not worth the effort.” “I conspire.” “Because I know this is often false (or ignorant) and yes, I understand uncertainty and the reality that there are no guarantees” “But I’ve seen the contrary results from ordinary people displaying patience and deploying extraordinary discipline.”
“I conspire.” “Because WE CAN BEAT THE MARKET and experience successful investing.”
We’ll show you how to soar with turtles.

MANIFEST 40 Updates
- 20. Coach (COH))
- 38. Wal-Mart (WMT)
- 40. Costco Wholesale (COST)
- Coach (COH)
- Costco Wholesale (COST)
- Dollar Tree Stores (DLTR)
- Fossil (FOSL)
- Hibbett Sporting Goods (HIBB)
- Michael Kors (KORS)
- Pricesmart (PSMT)
- Ulta Salons (ULTA)
- Vera Bradley (VRA)
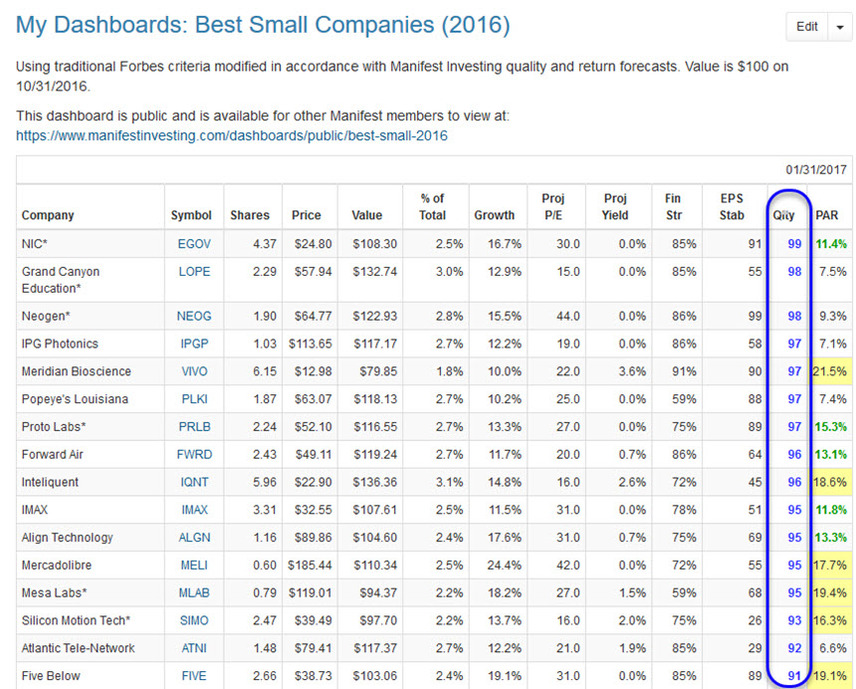
- 9. Five Below (FIVE)
- 20. Francesca’s (FRAN)
- 24. IMAX (IMAX)
- 25. Nautilus (NLS)
Results, Remarks & References
- The Best of Charlie Munger (Morgan Housel via ValuePlays)
- Amazon Is Eating The Retail World (Ben Carlson, A Wealth of Common Sense)
- Hunter Harrison Heading To Another Railroad (Motley Fool Canada)
- Stay Focused … (Blaine Rollins, 361 Capital)
- Why Air Lease Is My Pick For 2017 (JP Research via Seeking Alpha)
Companies of Interest: Value Line (1/27/2017)
The average Value Line low total return forecast for the companies in this week’s update batch is 7.7% vs. 3.3% for the Value Line 1700 ($VLE).
Materially Stronger: J.C. Penney (JCP), Insight Enterprises (NSIT)
,
Materially Weaker: Abercrombie (ANF), Fossil (FOSL), Vera Bradley (VRA), G-III Apparel Group (GIII), Hertz Global (HTZ), Michael Kors (KORS), DSW (DSW), Finish Line (FINL), Sempra Energy (SRE)
Discontinued: Netsuite (N)
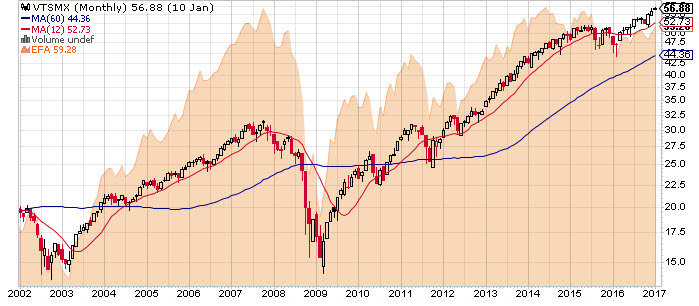
Market Barometers

Value Line Low Total Return (VLLTR) Forecast. The long-term low total return forecast for the 1700 companies featured in the Value Line Investment Survey is 3.3%, unchanged from 3.3% last week. For context, this indicator has ranged from low single digits (when stocks are generally overvalued) to approximately 20% when stocks are in the teeth of bear markets like 2008-2009.
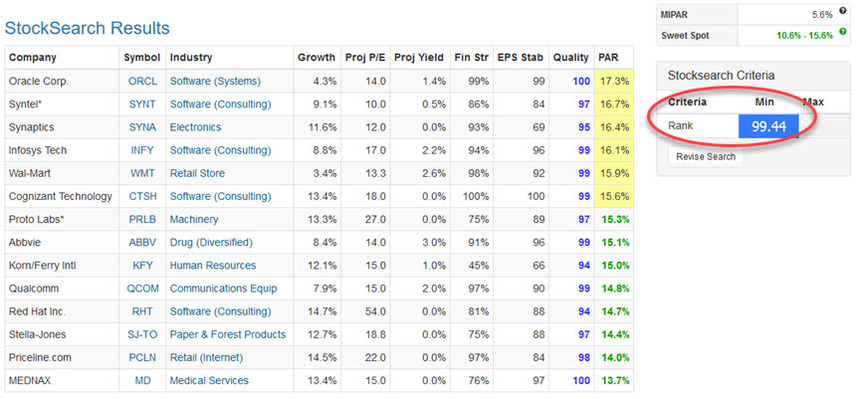
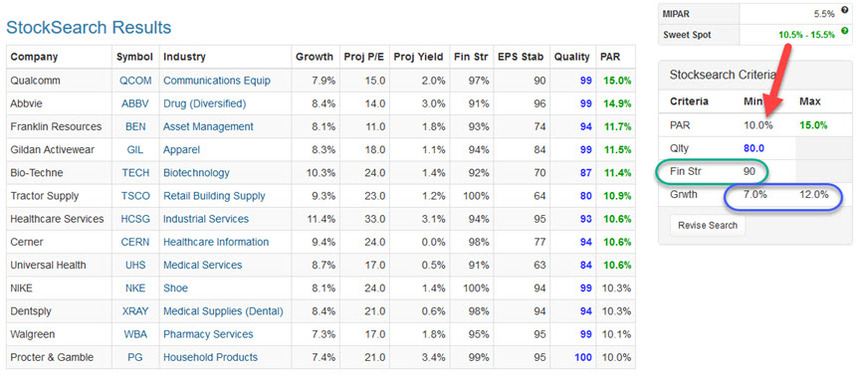
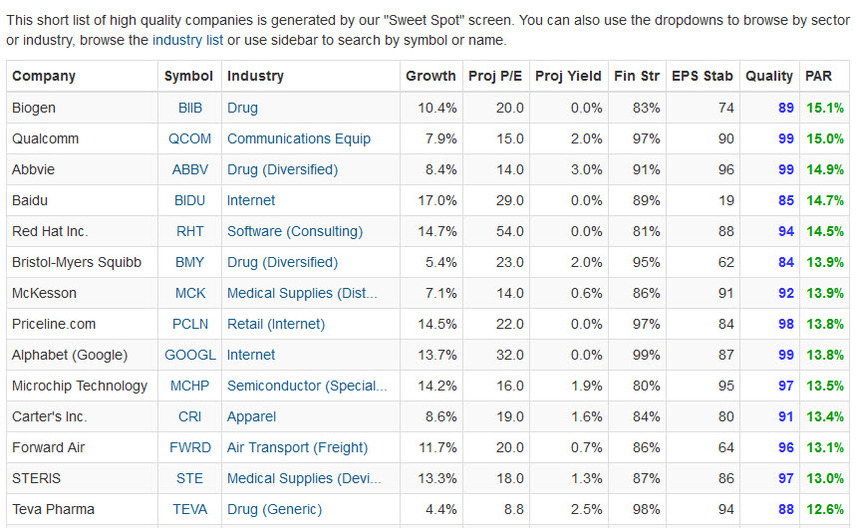
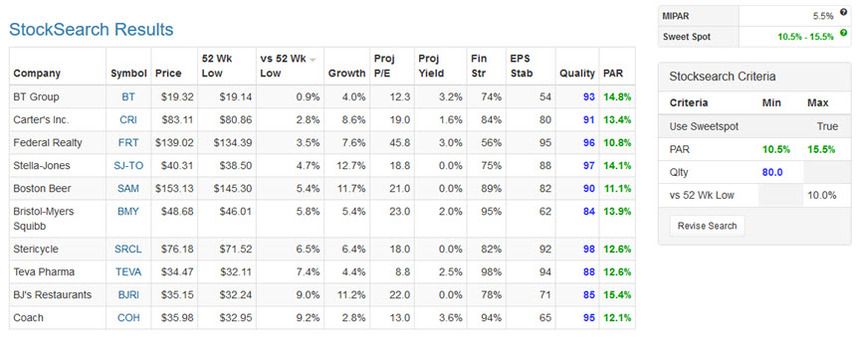
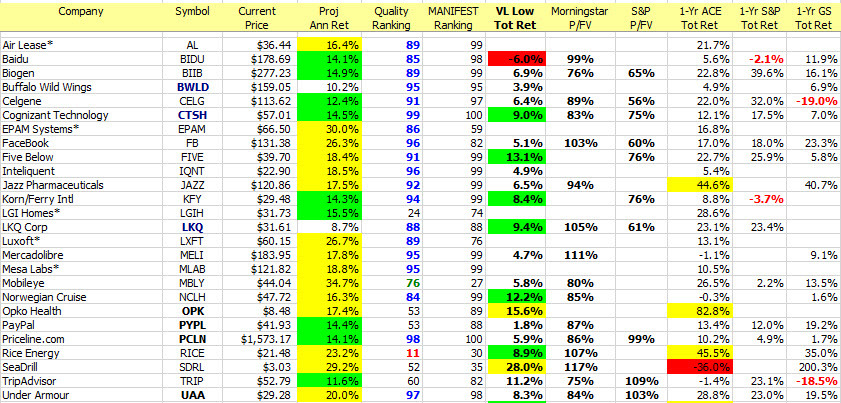
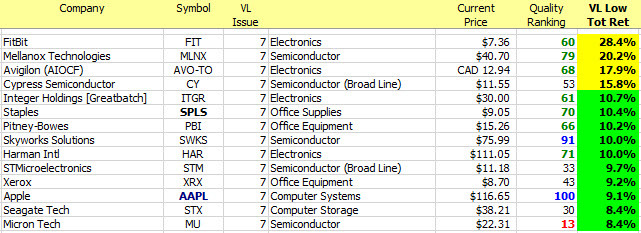
Stocks to Study (1/27/2017)
Gone shopping. A few favorites bubbling near the top of the study list …

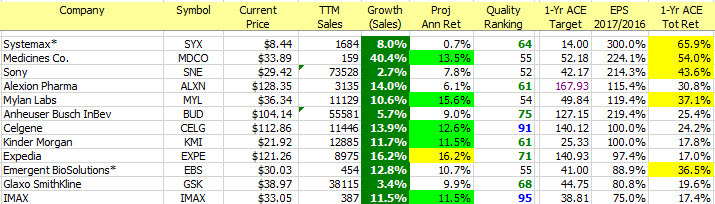
The Long & Short. (January 27, 2017) Projected Annual Return (PAR): Long term return forecast based on fundamental analysis and five year time horizon. Quality Ranking: Percentile ranking of composite that includes financial strength, earnings stability and relative growth & profitability. VL Low Total Return (VLLTR): Low total return forecast based on 3-5 year price targets via Value Line Investment Survey. Morningstar P/FV: Ratio of current price to fundamentally-based fair value via www.morningstar.com S&P P/FV: Current price-to-fair value ratio via Standard & Poor’s. 1-Year ACE Outlook: Total return forecast based on analyst consensus estimates for 1-year target price combined with current yield. The data is ranked (descending order) based on this criterion. 1-Year S&P Outlook: 1-year total return forecast based on S&P 1-year price target. 1-Yr “GS” Outlook: 1-year total return forecast based on most recent price target issued by Goldman Sachs.