“Stocks are rising: I wish I would have bought more at lower prices. Stocks are falling: Oh wait … Not these lower prices.” — Ben Carlson
“We believe that investing in emerging, well-managed small companies should be persistently pursued.” — Manifest Investing, November 2007
“A great small company, in our estimation, should exhibit the same characteristics as great medium and large companies.” — Ken Kavula, Expected Returns (December 2016)
This Week at MANIFEST (11/6/2020)
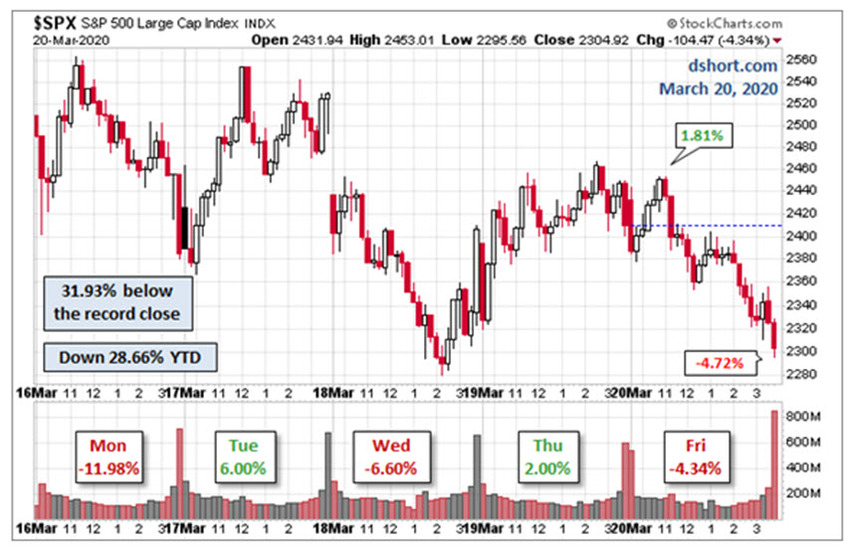
Stocks closed out their worst week since March. Anxiety is ruling the day on Wall Street with the collision of the pandemic and the upcoming election. (Morning Brew)
Stocks fell on Friday, led by the megacap tech names, to wrap up the worst week since March as coronavirus cases surged, U.S. fiscal stimulus talks broke down and traders braced for next week’s presidential election. Some buying in the last half hour of trading brought the major averages substantially off their lows of the day. Among the tech megacaps, only Google managed to eke out a gain following its Thursday earnings report, Apple pared more than 5% and is now more than 20% below its all-time high, Facebook fell 6% amid concerns about the 2021 ad market, and Twitter plunged 20% to wipe out its big run-up since mid-September. For the week, the Dow Jones average tumbled 6.5%, the S&P 500 sank 5.6%, and the Nasdaq lost 5.5%. (Seeking Alpha)
Best Small Companies (2020 Results)
Applause. Applause. There’s no way that celebrity audience at the Dorothy Chandler Pavilion could remain seated after seeing this. Get on your feet and celebrate another solid run for our Best Small Companies.

Yes, Virginia, that’s six in a row! The 2020 selections combine to deliver a total return of 13.3% versus 8.1% for the Wilshire 5000. The overall performance for the last six years now stands at 19.2% versus 9.7% for the total stock market.

VOTE For Remaining Fully Invested
I still need to dig up my research from a few years ago that makes the case that returns to investors is not about the party occupying the Oval Office. (Sorry if that doesn’t reconcile with your instincts or whatever proganda that current “journalists” are dishing out.)
As shown here, since Truman, it doesn’t make a whole lot of sense to “time” markets based on party affiliation.

Context & Perspective via Brian Wesbury, First Trust.

What If The White House and Senate Flip To The “Other Side?” Go shopping for some excellent companies. Assume ownership if the price (return forecast) is right. Maintain stewardship for as long as it makes sense to do so.
- 2. Cognizant Technology (CTSH)
- 4. Microsoft (MSFT)
- 6. Visa (V)
- 12. Alphabet/Google (GOOG)
- 28. FaceBook (FB)
- 32. Amazon (AMZN)
- 33. Oracle (ORCL)
- 34. Wells Fargo (WFC)
- 37. T. Rowe Price (TROW)
- Amazon (AMZN)
- Booking (BKNG)
- Cognizant Technology (CTSH)
- EPAM Systems (EPAM)
- FaceBook (FB)
- Fleetcor Technologies (FLT)
- Google (GOOG)
- InfoSys Tech (INFY)
- Microsoft (MSFT)
- SEI Investments (SEIC)
- T. Rowe Price (TROW)
- Truist (TFC)
- VMWare (VMW)
- Investing Round Table — August 2020 (BMRN, BP, FFIN, PAYX)
- Investing Round Table — September 2020 (BP, SIRI, TFC, UHS)
- Investing Round Table — October 2020 (AX, BP, CBOE, UFPI)
Results, Remarks & References
- How Comfortable Are You Holding Stocks For 30 Years? (Ben Carlson)
- The Investor’s Speech (March 2011)
- Jim Bowen: Crushing Narratives, Continued … (Jim Bowen, First Trust)
- Retail Sales Rose 1.9% In September (Brian Wesbury, First Trust)
- Dillard’s +46% After ‘Buffett’ Declares Stake (Business Insider)
- Every Time Out It’s A Guess (Ben Carlson)
- Crossing Wall Street — Market Review (10/30/2020) (Eddy Elfenbein) (AFL, FISV, CERN, CHD, ICE, MCO, SYK, BR)
- Tricks, Treats or Traps? (Expected Returns, November 2007)
- Best Gifts Sometimes Come In Small Packages (Ken Kavula)
- The 2020 Election And Stocks (Brian Wesbury, First Trust)
P.S. As always, your feedback and contributions on these weekly emails is welcome. If you come across some awesome content, please send it to markr@manifestinvesting.com
Attached file: First_Trust_Covid_19_Tracker_20201030.pdf (369 KB)
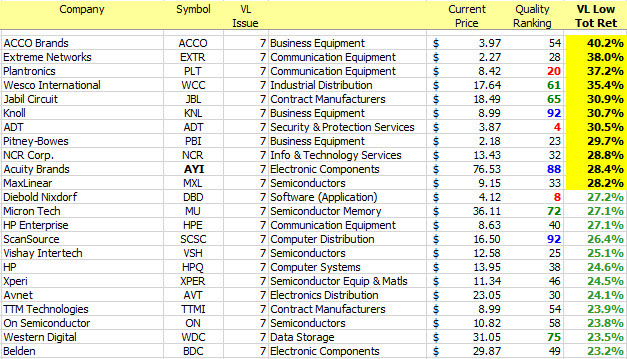
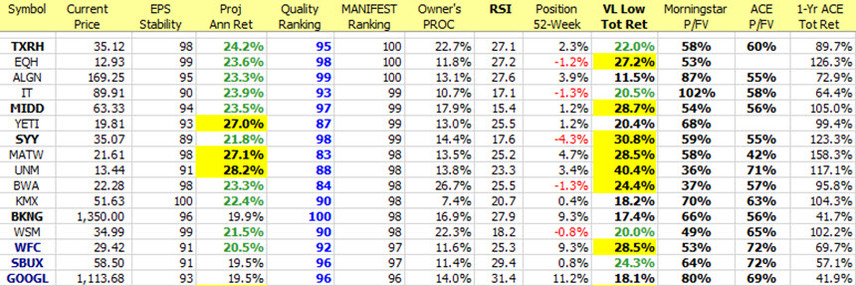
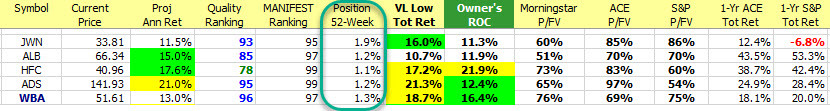
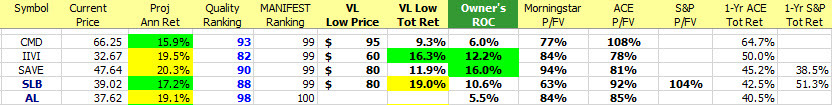
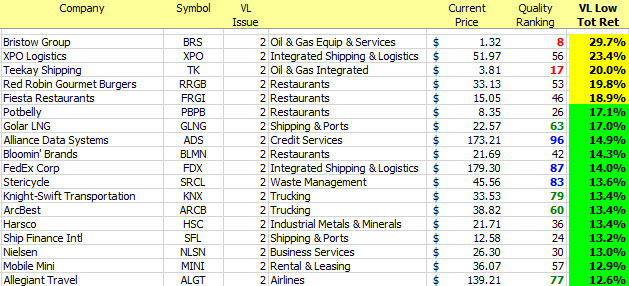
Companies of Interest: Value Line (11/6/2020)
The median Value Line low total return forecast for the companies in this week’s update batch is 7.1% vs.7.9% for the Value Line 1700 ($VLE).

Materially Stronger: Groupon (GRPN), Amazon (AMZN), 1-800-Flowers.com (FLWS), Cadence Design (CDNS), Cloudfare (NET), Square (SQ)
Materially Weaker: SAP (SAP)
Discontinued:
Demoted:
Note: The ticker for Absolute Software has changed from ABT.TO to ABST.
Market Barometers
“There’s a huge difference between an expectation and a forecast in investing. An expectation is an high-probability acknowledgment of how things might happen. A forecast is a specific prediction. In investing, forecasts are dangerous.” — Titan Research

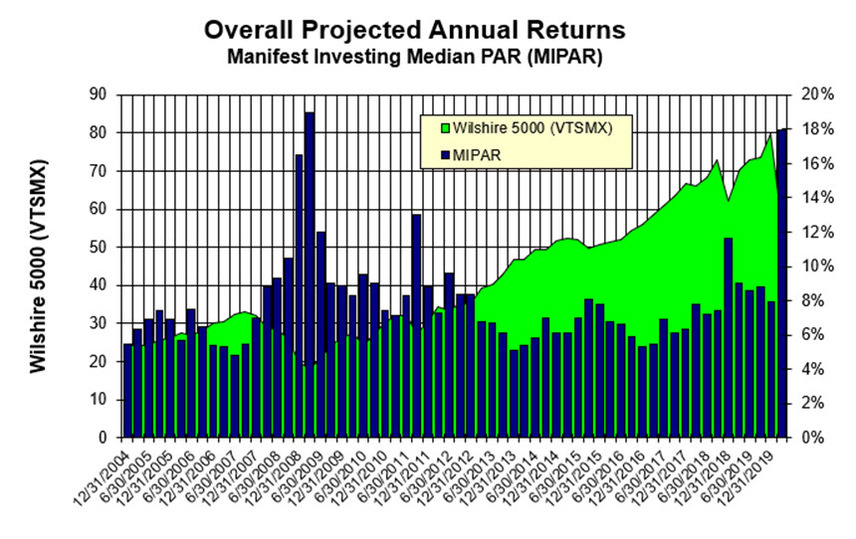
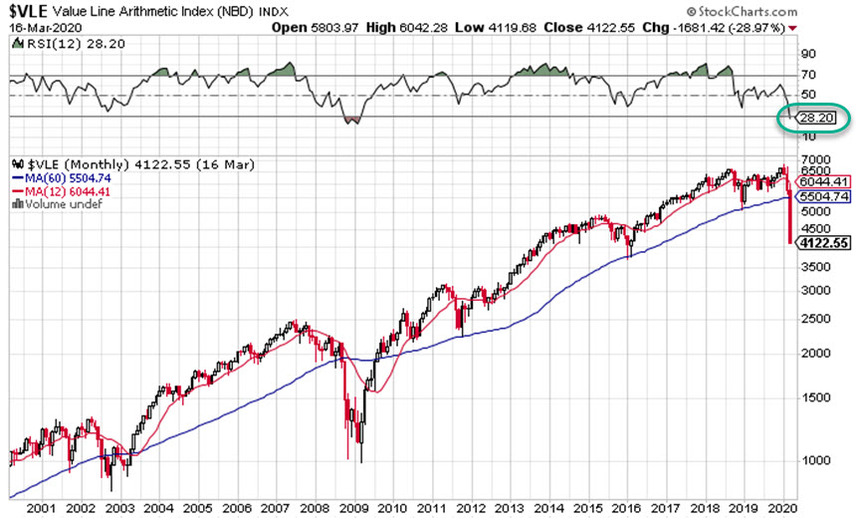
Value Line Median Appreciation Projection (VLMAP) Forecast. The long-term median appreciation projection for the 1700 companies featured in the Value Line Investment Survey is 10.7%, unchanged from 10.7% last week. For context, this indicator has ranged from low single digits (when stocks are generally overvalued) to approximately 25% when stocks are in the teeth of bear markets like 2008-2009