Fave Five (12/30/2016)

Fave Five (12/30/2016)

The primary screening criteria is the MANIFEST Rank, our combination of return forecast and quality. By screening for companies greater than 99.44 — we’re looking at the top half of the top percentage of companies qualifying.

This week’s stock study selections are top shelf candidates — right next to the holiday elf.

For context, the average 1-year ACE total return forecast is currently 8.3% for the approximately 2400 companies in our coverage.

The Fave Five This Week: Five Ideas to Float

  • Abbvie (ABBV)
  • Buffalo Wild Wings (BWLD)
  • Cognizant Technology (CTSH)
  • CVS Health (CVS)
  • Silicon Motion Tech (SIMO)

The Long and Short of This Week’s Fave Five (Ivory Soap Special Edition)

Fave Five: The Long & Short. (December 30, 2016) Projected Annual Return (PAR): Long term return forecast based on fundamental analysis and five year time horizon. Quality Ranking: Percentile ranking of composite that includes financial strength, earnings stability and relative growth & profitability. VL Low Total Return (VLLTR): Low total return forecast based on 3-5 year price targets via Value Line Investment Survey. Morningstar P/FV: Ratio of current price to fundamentally-based fair value via www.morningstar.com S&P P/FV: Current price-to-fair value ratio via Standard & Poor’s. 1-Year ACE Outlook: Total return forecast based on analyst consensus estimates for 1-year target price combined with current yield. The data is ranked (descending order) based on this criterion. 1-Year S&P Outlook: 1-year total return forecast based on S&P 1-year price target. 1-Yr GS: 1-year total return forecast based on most recent price target issued by Goldman Sachs.

Fave Five Legacy (Tracking Portfolio)

The relative/excess return for the Fave Five tracking portfolio is +3.1% since inception. 44.4% of selections have outperformed the Wilshire 5000 since original selection.

Tracking Dashboard: https://www.manifestinvesting.com/dashboards/public/fave-five

This Week at MANIFEST (12/30/2016)

This Week at MANIFEST (12/30/2016)

What I think a lot of great marathon runners do is envision crossing that finish line. Visualization is critical. But for me, I set a lot of little goals along the way to get my mind off that overwhelming goal of 26.2 miles. I know I’ve got to get to 5, and 12, and 16, and then I celebrate those little victories along the way.” — Bill Rancic

As most of you have guessed, our playful emphasis on Dow 20,000 is precisely that — playful.

We seem to pay way too much attention to essentially arbitrary piles of numbers and the rhinos life expectancy can be shortened by how they measure up quarter-to-quarter and year-to-year.

Brad Perry was right. A successful long-term investing experience is a marathon. And Bill Rancic is also correct, milestones matter. There’s plenty of noise, chaos and confusion that complicates life for average investors.

We’re thankful for a community of investors that is willing to focus on visions of the future and a willingness to imagine. We believe that our emphasis on return expectations and vigilance on fundamental threats and opportunity — is a path to better finish lines.

Value Line Arithmetic Average. Annual Returns. (1990-2016). The average annual total return for the equal-weight Value Line Arithmetic Average is 13.3% since 1990. The S&P 500 (VFINX) checks in at 9.3%. That Dow Jones Industrial Average that everyone is hyperventilating over has delivered 7.6% over the same time frame.

The November-December surge in the market pushed this year’s all-of-the-above index from 10-20% to 20-30%. This image will serve as the centerpiece for the January 2017 newsletter. Ask us again if we believe in a blend of small, medium and large companies as a crucial element of portfolio design and management.

MANIFEST 40 Updates

  • 1. Apple (AAPL)
  • 23. Intel (INTC)

Round Table Stocks

  • Apple (AAPL)
  • Intel (INTC)
  • IPG Photonics (IPGP)
  • Skyworks (SWKS)
  • Universal Display (OLED)

Best Small Companies

  • 6. Universal Display (OLED)
  • 18. Mellanox Technologies (MLNX)
  • 27. IPG Photonics (IPGP)

Results, Remarks & References

Companies of Interest: Value Line (12/30/2016)

The average Value Line low total return forecast for the companies in this week’s update batch is 2.1% vs. 3.4% for the Value Line 1700 ($VLE).

Materially Stronger: Logitech (LOGI), Seagate Tech (STX), Applied Materials (AMAT), Micron Technology (MU)

Materially Weaker: Fitbit (FIT), Cray (CRAY), Stratasys (SSYS), Nimble Storage (NMBL), 3D Systems (DDD), HP Enterprise (HPE)

Discontinued: Lexmark (LXK), Imgram Micro (IM), Skulcandy (SKUL), Fairchild Semiconductor (FCS)

Market Barometers

Value Line Low Total Return (VLLTR) Forecast. The long-term low total return forecast for the 1700 companies featured in the Value Line Investment Survey is 3.4%, up from 3.3% last week. For context, this indicator has ranged from low single digits (when stocks are generally overvalued) to approximately 20% when stocks are in the teeth of bear markets like 2008-2009.

Stocks to Study (12/30/2016)

There’s a wide variety of opinions in the manifest of stocks to study this weekend. But some community favorites, some widely-followed leaders and some of our recent Best Small Companies made the list.

The Long & Short. (December 30, 2016) Projected Annual Return (PAR): Long term return forecast based on fundamental analysis and five year time horizon. Quality Ranking: Percentile ranking of composite that includes financial strength, earnings stability and relative growth & profitability. VL Low Total Return (VLLTR): Low total return forecast based on 3-5 year price targets via Value Line Investment Survey. Morningstar P/FV: Ratio of current price to fundamentally-based fair value via www.morningstar.com S&P P/FV: Current price-to-fair value ratio via Standard & Poor’s. 1-Year ACE Outlook: Total return forecast based on analyst consensus estimates for 1-year target price combined with current yield. The data is ranked (descending order) based on this criterion. 1-Year S&P Outlook: 1-year total return forecast based on S&P 1-year price target. 1-Yr “GS” Outlook: 1-year total return forecast based on most recent price target issued by Goldman Sachs.

Festivus Five (12/23/2016)

Festivus Five (12/23/2016)

December 23. Happy Festivus! Festivus is both a parody and a secular holiday celebrated on December 23 that serves as an alternative to participating in the pressures and commercialism of the Christmas season. Originally a family tradition of Seinfield scriptwriter Dan O’Keefe, Festivus entered popular culture after it was made the focus of the 1997 episode “The Strike”. The non-commercial holiday’s celebration, as it was shown on Seinfeld, occurs on December 23 and includes a Festivus dinner, an unadorned aluminum Festivus pole, practices such as the “Airing of Grievances” and “Feats of Strength”, and the labeling of easily explainable events as “Festivus miracles”.

This week’s stock study selections are “a Festivus for the rest of us!”

The primary driver for the screening criteria was the 1-year total return (via analyst consensus estimates) but the field was limited to companies with a Manifest Investing rank of 90 and above (based on long-term return forecast and quality ranking).

For context, the average 1-year ACE total return forecast is currently 8.0% for the approximately 2400 companies in our coverage.

So we’re looking for that 1-year miracle … as a case in point, the analyst consensus for Rocky Mountain Chocolate Factory (RMCF) has a 1-year total return forecast of 78.6% based on an expected price of $18 and a 4.7% yield. The problem is that the ACE committee of analysts is N/A.

The Fave Five This Week: Festivus Special

The Long and Short of This Week’s Fave Five (Festivus Special Edition)

Festivus SPECIAL: The Long & Short. (December 23, 2016) Projected Annual Return (PAR): Long term return forecast based on fundamental analysis and five year time horizon. Quality Ranking: Percentile ranking of composite that includes financial strength, earnings stability and relative growth & profitability. VL Low Total Return (VLLTR): Low total return forecast based on 3-5 year price targets via Value Line Investment Survey. Morningstar P/FV: Ratio of current price to fundamentally-based fair value via www.morningstar.com S&P P/FV: Current price-to-fair value ratio via Standard & Poor’s. 1-Year ACE Outlook: Total return forecast based on analyst consensus estimates for 1-year target price combined with current yield. The data is ranked (descending order) based on this criterion. 1-Year S&P Outlook: 1-year total return forecast based on S&P 1-year price target. 1-Yr GS: 1-year total return forecast based on most recent price target issued by Goldman Sachs.

Fave Five Legacy (Tracking Portfolio)

The relative/excess return for the Fave Five tracking portfolio is +3.7% since inception. 46.3% of selections have outperformed the Wilshire 5000 since original selection.

Tracking Dashboard: https://www.manifestinvesting.com/dashboards/public/fave-five

Apple (AAPL): NeXT!

On this day 20 years ago, Apple (AAPL) announced it was going to buy NeXT (and with it Steve Jobs) for $400M. Greatest deal ever made?

Aapl chart 20yr 20161219

For those who have asked (and the rest of you who have wondered) the adjusted closing price for Apple (AAPL) back on 12/20/1996 was $0.76.

That’s an annualized total return of 28.6% over the last 20 years.

Grinchy Dow 20,000

This Week at MANIFEST (12/23/2016)

Grinchy Bill Griffeth and Rogue destroyer Janet Yellen squelched our Dow 20,000 rally and party hats last week. But we’re resilient and pressing on. This week’s update batch includes Procter & Gamble (PG), Tractor Supply (TSCO), Fastenal (FAST) and those homebuilders and building supply retailers.

Burnt Popcorn!

We refer to market fraught with turbulence and emotions as “popcorn days.” In most cases, it’s a spectator sport as panic or exuberance is met with explanations and rationale that are back-fitted for the day. And these memes are among the most recyclable phenomenon on the planet. The same logic often works in both directions. People are selling today because _____ aligns pretty nicely on other days with People are buying today because ______.

This week, I demonstrated (again) why I could never be a day trader. I really thought we’d reach Dow 20,000 although I would never have taken out a second mortgage on the theory.

Grinchy Bill Griffeth had some fun with the Dow 20,000 enthusiasts with the accompanying tweet made during Friday’s Closing Bell segment on CNBC.

Other antagonists sent messages that 4 days of prolonged Dow 20,000 watching should probably be treated with a trip to the doctor.

But, we got close … coming within 34 points before Janet Yellen and her Rogue storm troopers at the Fed rained on the parade at 2:30 PM ET on Wednesday. The rest of the week had some moments — but it was pretty much like watching salmon flipping up the ladder. We learned on our Alaska cruise that despite a brief fling when the salmon reach their birthplace, it doesn’t end well. And the week didn’t end well for our box of Dow 20K party hats.

MANIFEST 40 Updates

  • 3. Fastenal (FAST)
  • 15. Procter & Gamble (PG)
  • 30. Home Depot (HD)
  • 34. Lowe’s (LOW)

Round Table Stocks

  • Chicago Bridge & Iron (CBI)
  • Fastenal (FAST)
  • Tractor Supply (TSCO)

Best Small Companies

(None)

Results, Remarks & References

Companies of Interest: Value Line (12/23/2016)

The average Value Line low total return forecast for the companies in this week’s update batch is 2.9% vs. 3.3% for the Value Line 1700 ($VLE).

Materially Stronger: Pulte Homes (PHM)

Materially Weaker: Sunpower (SPWR). First Solar (FSLR)

Discontinued:

Market Barometers

Value Line Low Total Return (VLLTR) Forecast. The long-term low total return forecast for the 1700 companies featured in the Value Line Investment Survey is 3.3%, unchanged from 3.3% last week. For context, this indicator has ranged from low single digits (when stocks are generally overvalued) to approximately 20% when stocks are in the teeth of bear markets like 2008-2009.

Stocks to Study (12/23/2016)

Normally we “cut off” the list at a MANIFEST Rank of 95 or 90 … and you’ll note that we had to go a little deeper in order to have a list this week. Study and shop well.

The Long & Short. (December 23, 2016) Projected Annual Return (PAR): Long term return forecast based on fundamental analysis and five year time horizon. Quality Ranking: Percentile ranking of composite that includes financial strength, earnings stability and relative growth & profitability. VL Low Total Return (VLLTR): Low total return forecast based on 3-5 year price targets via Value Line Investment Survey. Morningstar P/FV: Ratio of current price to fundamentally-based fair value via www.morningstar.com S&P P/FV: Current price-to-fair value ratio via Standard & Poor’s. 1-Year ACE Outlook: Total return forecast based on analyst consensus estimates for 1-year target price combined with current yield. The data is ranked (descending order) based on this criterion. 1-Year S&P Outlook: 1-year total return forecast based on S&P 1-year price target. 1-Yr “GS” Outlook: 1-year total return forecast based on most recent price target issued by Goldman Sachs.

Fave Five (12/16/2016)

This weekly feature is now into its second year and we now have a handful of positions in the tracking portfolio with a holding period greater than a year.  The two-pronged screening method seems to have promise and it also serves as a “proving ground” for our exploration of excess/relative return-based selling guidelines.

Fave Five (12/16/2016)

Our Fave Five essentially represents a listing of stocks with favorable short term total return forecasts (1 year, according to Analyst Consensus Estimates, or ACE) combined with strong long-term return forecasts and good/excellent quality rankings. The average 1-year ACE total return forecast is 7.9%.

This week we’re renaming the tracking portfolio and will begin referring to it as the Fave Five Legacy.

It will reside at: https://www.manifestinvesting.com/dashboards/public/fave-five

For more information on joining our 11th annual Groundhog Challenge, launching 2/2/2017, as either a group or an individual investor, drop a note to markr@manifestinvesting.com.

The Fave Five This Week

  • Allergan (AGN)
  • Roche (RHHBY)
  • Rocky Mountain Chocolate (RMCF)
  • Silicon Motion Technology (SIMO)
  • Teva Pharma (TEVA)

The Long and Short of This Week’s Fave Five

The Long & Short. (December 16, 2016) Projected Annual Return (PAR): Long term return forecast based on fundamental analysis and five year time horizon. Quality Ranking: Percentile ranking of composite that includes financial strength, earnings stability and relative growth & profitability. VL Low Total Return (VLLTR): Low total return forecast based on 3-5 year price targets via Value Line Investment Survey. Morningstar P/FV: Ratio of current price to fundamentally-based fair value via www.morningstar.com S&P P/FV: Current price-to-fair value ratio via Standard & Poor’s. 1-Year ACE Outlook: Total return forecast based on analyst consensus estimates for 1-year target price combined with current yield. The data is ranked (descending order) based on this criterion. 1-Year S&P Outlook: 1-year total return forecast based on S&P 1-year price target. 1-Yr GS: 1-year total return forecast based on most recent price target issued by Goldman Sachs.

Fave Five Legacy (Tracking Portfolio)

The relative/excess return for the Fave Five tracking portfolio is +2.7% since inception. 50.6% of selections have outperformed the Wilshire 5000 since original selection.

Tracking Dashboard: https://www.manifestinvesting.com/dashboards/public/fave-five

Best Small Companies (2016)

Best Small Companies (2016)

We lamented the decision by Forbes to discontinue their annual Best Small Companies list last year. 36 years in the running, the list provided a number of actionable opportunities over the last couple of decades for many of us. That said, while sticking to their core criteria, we may have actually improved the discovery and screening process. The returns posted by the lists, orphaned for two years now, have been 19.0% and 21.6%, respectively. For context, the Wilshire 5000 checked in at approximately 4% for both periods. With this experience under our belts, we head for the haystack in search of promising smaller companies to bolster our all-of-the-above investing discipline and hoping for a solid January Effect.

The Russell 2000 (RUT) gained 2.5% from 10/31/2015 through Halloween 2016.

The Wilshire 5000 (VTSMX) did a little better, checking in at 4.1% during that same period.

Every Halloween, we remind our fellow investors to be extra vigilant for opportunities among smaller, faster-growing companies, during the 4th quarter of the year. History suggests that some opportunities are created by tax-related selling. The smaller companies are impacted the most and those with solid expectations often get a stock price boost during January when investors return after wash sale periods expire.

Small Cap Does Not Mean Small Company

It’s also a time when we are reminded that small cap does not mean small company. As a case in point, the average sales growth forecast for the Russell 2000 (EQWS) is approximately 6.0% — the type of growth more closely associated with stalwarts and larger blue chip contributors. If you’re really looking for small companies, we suggest an emphasis on higher growth rates. This month’s fund feature is Conestoga Small Cap (CCASX) featuring an average sales growth rate of 13%. Go ahead. Check out the companies held by Conestoga. (See page 4.) In a word, they obviously shop for leadership small companies in much the same way that we do and can/should be considered a qualified source of ideas. Conestoga features a +2.4% (annualized) excess return versus the S&P 500 over the last ten years.

The criteria used to build the list is largely faithful to the Forbes traditions. Specifically, annual revenues were limited to less than $1 billion, but required to be greater than $50 million. We also required a minimum stock price of $5. Because we feel the sales growth forecast is the strongest characteristic to define “small” — we required a minimum growth forecast of 10%. No asset-based companies from the financial sector were included. And finally, when we think about “Best” we think the combination of quality and return forecast is a great place to start.

This Year’s Haystack

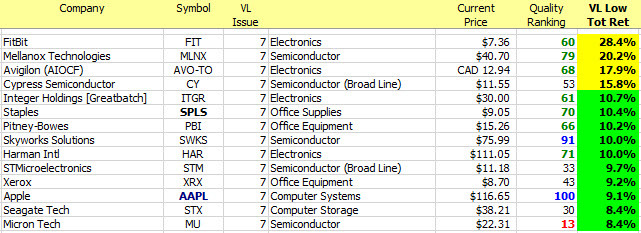
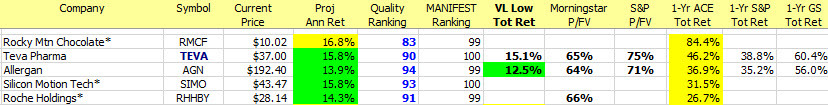
The companies that qualify for our 2016 Best Small Company Manifest are shown in the accompanying table.

Newcomer Meridian Bioscience (VIVO) checks in at #1. VIVO is covered in the Value Line Standard Edition and had a 16% low total return forecast (11/18/2016). Meridian Bioscience provides diagnostic test kits, purified reagents and related products, as well as biopharmaceutical enabling technologies. Products are marketed to hospitals, laboratories, veterinary centers, physician offices, diagnostic manufacturers and biotech companies worldwide. The company is headquartered in Cincinnati, Ohio and investors are encouraged to explore the investor relations materials at:
www.meridianbioscience.com

Diagnostics as a “theme” are fairly prevalent among the best small companies. Solomon Select feature Mesa Labs (MLAB) is one example and Mid-Michigan local favorite, Neogen (NEOG) is another. Both of these companies were “discovered” via the Forbes list and continue to qualify. Another company that qualifies as biopharma-enabling might well be Simulations Plus (SLP) but the company falls a little short of the annual revenues minimum.

We expected to lose last year’s #1, Forward Air (FWRD) to “graduation” but the recessionary conditions in transporting “stuff” kept FWRD below the $1 billion maximum. Forward Air had been a resident of the Forbes listing for seven years … so this makes it nine years for this logistics leader.

The top performer from last year’s best small companies was Ubiquiti Networks (UBNT) with a total return of 79.7%. Ubiquiti develops high performance networking technology for service providers and enterprises. UBNT is closing the digital divide by building network communication platforms and has 38 million devices worldwide. Ubiquiti just missed qualifying for this year’s list — ranking #41 as the UBNT return forecast is down to 7.9% following the robust performance over the last year.


Diagnosis: Ubiquitous

We think a ubiquitous haystack is a path to opportunity and success. We’re reminded that we can’t achieve proper balance unless we’re continuously searching for the next promising well-managed small company. We’re reassured by the presence of several long time favorites on this study list and look forward to discovering and diagnosing at will.

Favorite Screens: Launch Pad 2017

These Are A Few Of Our Favorite Screens

(30) Launch Pad Candidates (12/9/2016)

As 2016 winds to a close and we start thinking about the Groundhog 2017, it’s time to go shopping for the best opportunities in the coming year. As we recently featured and reminded, it can make sense to peruse the companies with the largest incremental step changes in earnings expectations for the coming year.

Yes, Virginia, we realize that virtually no one can portend stock prices and indices over such a short time frame — but as our contest participants have shown over the last several years, it can make sense to find stocks that look good for the long term that appear to be poised or perhaps about to experience some sort of catalyst. This was the Better Investing premise of featuring a long-term Stock to Study while also giving a nod to a shorter time horizon for the Undervalued feature.

This is also what we do with the weekly updates of the Fave Five and the Weekend Warrior tracking portfolio.

The accompanying figure demonstrates what we seek — companies with the biggest boost in expected earnings for 2017 versus 2016. As shown for Glaxo Smith Kline (GSK), their work in a number of key development areas could restore growth and profitability to this venerable pharmaceutical leader.

And if that doesn’t work out, there’s always AB InBev (BUD)

Screening Criteria

  • 2017 EPS/2016 EPS > +50.0%
  • Quality Ranking > 60 (Excellent or Good Quintiles)

For context, the median year-over-year (2017/2016) change in EPS is +11.8%.

The average 1-year total return forecast (ACE) is currently 8.1%.

Our median long term return forecast (MIPAR) is now 5.0%.

Launch pad screen 20161207

Fave Five: Escape Velocity

Fave Five (12/9/2016)

Our Fave Five essentially represents a listing of stocks with favorable short term total return forecasts (1 year, according to Analyst Consensus Estimates, or ACE) combined with strong long-term return forecasts and good/excellent quality rankings. The average 1-year ACE total return forecast is 8.1%.

Every year we run a stock selection challenge starting on Groundhog Day (February 2) and running for the next twelve months. Individual investors and groups like investment clubs are welcome to participate by choosing 5-20 stocks.

We’ve now got nine annual contests under our belt. We crown an individual and group champion every year.

Escape Velocity

In three of the last four years, the Broad Assets Investment Club of St. Louis has toppled dozens of competing groups — taking home multiple Groundhog stock selection championships.

I’ll let that sink in.

Three of the past four years. Their excess/relative return (annualized) since inception is +28.7%.

Let that sink in, too.

We want some of whatever they’re having. Seriously, we checked the water … asked what they had for breakfast, etc. in an effort to come to grips with the primary driver behind their stunning success and track record. We discovered one potential influence. It seems like Broad Assets latches on to companies that have huge incremental improvements in earnings forecasts for next year versus this year. We detailed our findings in our cover story, Victory By Escape Velocity?

This week’s Fave Five is based on companies with solid long-term outlooks that also have superior earnings forecasts for 2017 versus estimates for 2016. The bracketed column displays the top five year-over-year forecasts, according to analyst consensus estimates. [Source: ACE and finance.yahoo.com]

The median year-over-year (2017/2016) differential for the ~2400 companies we cover is currently 11.8%.

For more information on joining our 11th annual Groundhog Challenge, launching 2/2/2017, as either a group or an individual investor, drop a note to markr@manifestinvesting.com.

The Fave Five This Week

  • Allergan (AGN)
  • Baidu (BIDU)
  • Celgene (CELG)
  • Five Below (FIVE)
  • Universal Display (OLED)

The Long and Short of This Week’s Fave Five

The Long & Short. (December 9, 2016) Projected Annual Return (PAR): Long term return forecast based on fundamental analysis and five year time horizon. Quality Ranking: Percentile ranking of composite that includes financial strength, earnings stability and relative growth & profitability. VL Low Total Return (VLLTR): Low total return forecast based on 3-5 year price targets via Value Line Investment Survey. Morningstar P/FV: Ratio of current price to fundamentally-based fair value via www.morningstar.com S&P P/FV: Current price-to-fair value ratio via Standard & Poor’s. 1-Year ACE Outlook: Total return forecast based on analyst consensus estimates for 1-year target price combined with current yield. The data is ranked (descending order) based on this criterion. 1-Year S&P Outlook: 1-year total return forecast based on S&P 1-year price target. 1-Yr GS: 1-year total return forecast based on most recent price target issued by Goldman Sachs.

Weekend Warriors

The relative/excess return for the Weekend Warrior tracking portfolio is +5.8% since inception. 51.9% of selections have outperformed the Wilshire 5000 since original selection.

Tracking Dashboard: https://www.manifestinvesting.com/dashboards/public/weekend-warriors

Weekend Warrior Tracking Portfolio: Selling Discipline

There are two primary selling conditions for the Weekend Warrior tracking portfolio.

  • For the first year after selection, if the excess/relative return (vs. the Wilshire 5000) becomes less than -20%, the position is closed.
  • A position is also closed (usually with a victory lap) when the return forecast (PAR) is less than the median return forecast (MIPAR).

This week, Stifel Financial (SF) and Raymond James (RJF) have both been on a surge, gaining 65% since selection. With return forecasts of 2-4% when the median return forecast is now 5% — both positions were closed. [High Five]

Invest Like Spock

Invest Like Spock

This morning, Forbes featured a column with the comment:

“Invest Like Mr. Spock . Okay, so I’m a trekkie. I like Mr. Spock’s ability to be human, yet make big decisions based on rationality.” — John Wasik

This nudges fond memories of a Round Table discussion by Hugh McManus (February 2011) that covers investing psychology and avoiding ending up on the wrong end of a spear as a happy resident in a Vulcan retirement home.

https://www.youtube.com/watch?v=LScAky5IhjM&t=947s

From “fat” as the “perfect food” to campfires at night, taking turns sleeping, to hunting in packs … to recognizing that investment disruptions are rarely fatal … to maintaining a true long-term perspective — with your Friends.