This Week at MANIFEST (8/25/2017)
There is no science in this world like physics. Nothing comes close to the precision with which physics enables you to understand the world around you. It’s the laws of physics that allow us to say exactly what time the sun is going to rise. What time the eclipse is going to begin. What time the eclipse is going to end. — Neil deGrasse Tyson

Whenever I sing ‘Total Eclipse of the Heart,’ the way people sing along with me still excites me. It’s one of the songs that audiences know all the lyrics to, and they sing along with me, and it makes me so happy. People also know my songs ‘Holding out for a Hero’ and ‘Lost in France,’ and this gives me so much joy on stage. — Bonnie Tyler
Mark: Ken, You know what makes me sad?
Ken: What’s that, Mark?
Mark: When you and I take a road trip that takes us nearly within walking distance to Punxsutawney, Pennsylvania … and you’re unwilling to make a slight detour.
Ken: Friends, that “slight detour” would have added nearly two hours to a trip that would already require 9 hours. Besides, on both excursions, we were blasted with a deluge that probably drowned Punxsy Phil in all its fury.
Mark: Go ahead, big guy, make light of these tears. Besides, we know that Noah keeps the ark just south of Cincinnati.
Ken: Mark, you know what makes me happy?
Mark: You mean besides dinner with investing friends in Cleveland at Corky & Lenny’s?
Ken: Well, that too. But once again we discover a local conspiracy of investing educators who nurture excellence in long-term investing.
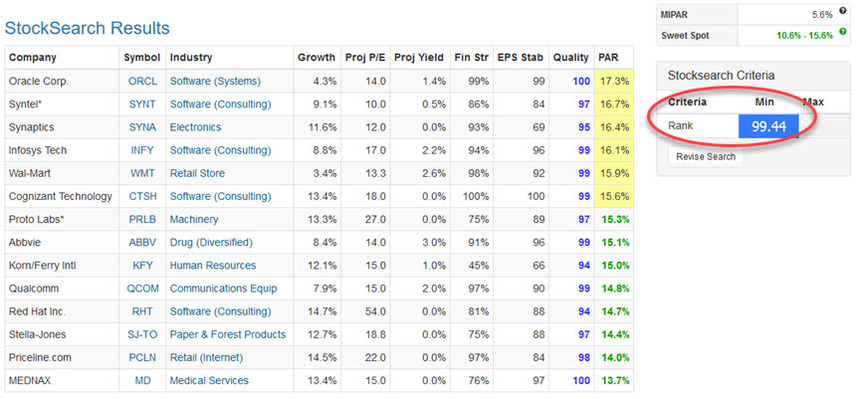
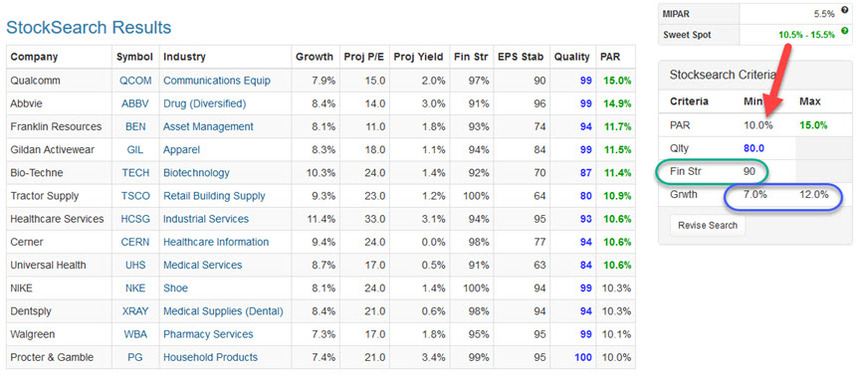
Mark: No kidding. We reviewed four investment club portfolios during the Keystone Strategies conference. All of them were well-positioned, adhering to design targets — most notable in that ALL OF THEM contained a sufficient number of faster-growing companies to keep the overall portfolio growth rate in the 10-12% range.
Ken: Folks, we don’t see this kind of thing very often — and it bodes well for the like-minded investors of Central Pennsylvania.
Mark: Absolutely. It reminded me of Cow Tipping in places like Beardstown and Faribault, Minnesota.
Ken: I can only imagine the detours involved there and I’m probably grateful that I wasn’t in the car. But go ahead, humor me.
Mark: And the wonderful achievements of the Broad Assets investment club of St. Louis. The River Oaks Investment Club has won the Keystone Strategies stock picking contest three out of the last four years in the group category.
Ken: I’ll give you that. The Keystone Strategies contest is outstanding and they’re to be commended. We recommend this type of activity as a path to learning, discovery, sharing of ideas and socializing with successful investors to all communities that we visit.
Mark: … which brings us to Neil deGrasse Tyson.
Ken: I feel a cosmic-sized detour coming on.
Mark: I think we can almost compare the behavior of the stock market in 2008-2009 to an eclipse. In hindsight, it didn’t really last that long but it was scary … but from an epic long-term perspective, we probably should have been looking at the Great Recession with a colander on our heads.

Ken: For some reason, I’m not having much trouble picturing you with …
Mark: [interrupting] I’m serious. Most of “Investor” Nation spends every waking moment worrying about price drops and whether or not it’s possible to time the market ad nauseam. This notion has been very destructive to so many as it has delivered pessimism-driven conservative approaches to asset allocation, etc. as the “gold standard” of prudent investing. For those with long time horizons — and a few more total solar eclipses in their future — there’s no need to think of price volatility as RISK.
Ken: In that case, I think you’re right. And we should point people to the work of our own Cy Lynch on the real definition and impact of RISK in our investing efforts.
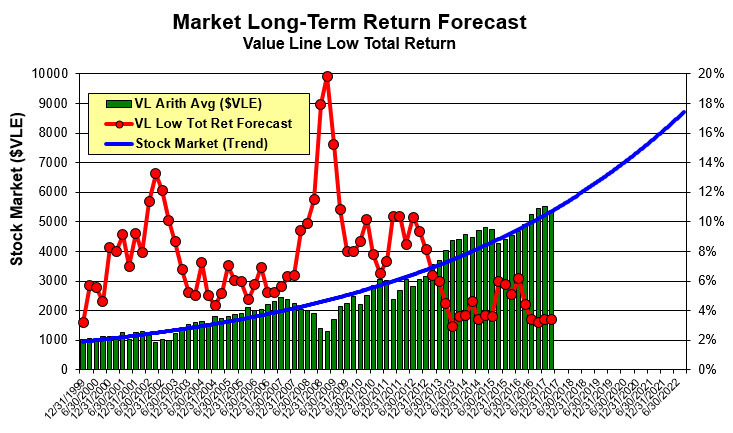
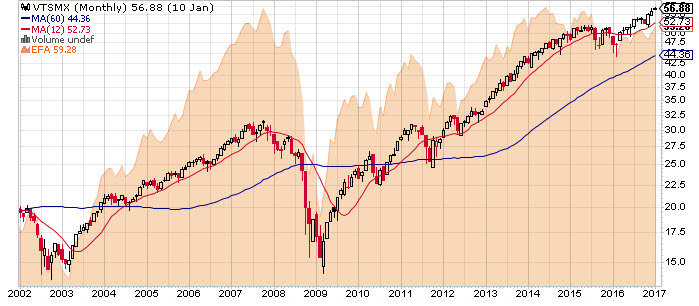
Mark: Cy is right about this. And so is AAII’s James Cloonan. Fear of “Risk” has destroyed a lot of capital over the decades. And that leads me to another twisted perception that we’ve been jousting with for years. This turned out to be one of our favorite slides from the weekend.

Mark: [continuing] There’s a couple of things that we can see here. First, we counsel in a BIG way, the importance of all-of-the-above investing. We define this as a blend of fast-growing promising upstarts, a suitable dose of medium-sized workhorse companies growing near average growth rates and a dash of blue-chip stalwarts growing at low single-digit slower growth rates. We build and maintain our portfolios at a 10-12% average sales growth forecast for the portfolio. We can generally point to the Value Line Arithmetic Average as “beating” the S&P 500, largely because of the contribution of the small and medium components. However, this graph shows that the red hot S&P 500 has caught the Value Line 1700 of late, something we’ve not seen since the late 1990s and rarely over the last 60 years. Read Josh Brown’s Just Say No to the S&P 500 from this perspective. But beyond that, notice the roller coaster (volatility) of the S&P 500 versus the Value Line average. Which one is “riskier?” Take it a step further and remove the S&P 500 from the Value Line average (mentally) and imagine how much less bumpy (“riskier”) the remaining small- and medium-sized companies must be.
Ken: This puts our long-held perspective on full display. Fast-growing and medium-sized companies of suitably high quality do not have to be roller coasters. We might also observe our strong emphasis on the S&P 500 field of opportunity approximately five years ago.
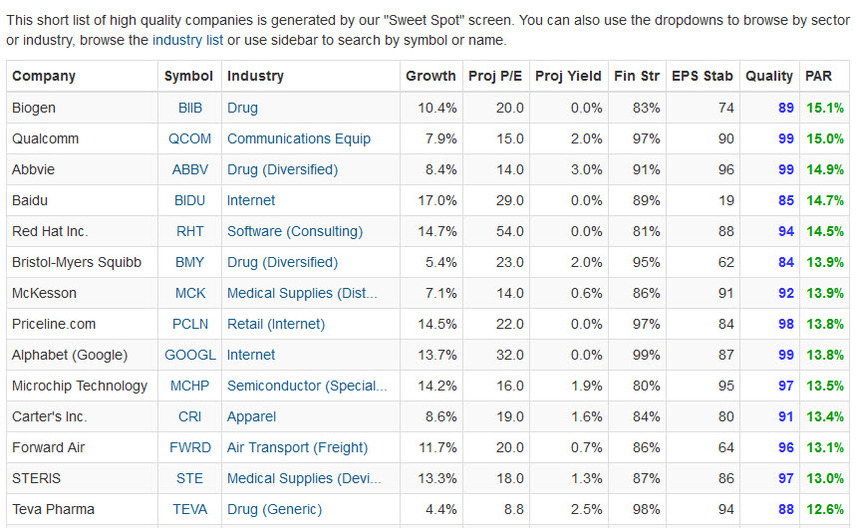
Mark: Right. How ya like my colander now? We’ll take a closer look at the S&P 600 and S&P 400 in coming weeks, but we’re launching our Fast Growing Company safari season with a few of the companies we discovered among the entries for the Keystone Strategies contest portfolios. You know what makes me happy? Investing better, with friends, whether the sun is shining or when the moon gets in the way for a few minutes. I’m always holding out for a few more Heroes. (Certain apologies to Bonnie Tyler)
Ken: We visit a lot of chapters and investment clubs. And the efforts of Chuck Reinbrecht, Richard Lindsay and Bruce Kennedy are exemplary as well as the support and achievements we witnessed by the likes of Kyle Blevins, Donna & John Diercks, Ken Mobley, Mary Ann Rentsch and the Cleveland team, John Varner and Barbara Vinson.
Mark: We’re also grateful for the support provided by bivio’s Laurie Madison for the Keystone Strategies contest and event. We look forward to future visits to share ideas and thoughts with the investors of Cleveland and Central Pennsylvania. And that visit to Punxsy Phil’s neighborhood is still on my Bucket List.

MANIFEST 40 Updates
- 10. FactSet Research (FDS)
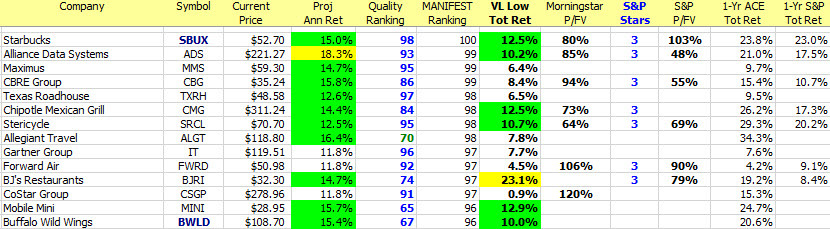
- 27. Starbucks (SBUX)
- 29. Buffalo Wild Wings (BWLD)
Round Table Stocks
- Buffalo Wild Wings (BWLD)
- C.H. Robinson (CHRW)
- Forward Air (FWRD)
- Maximus (MMS)
- McDonald’s (MCD)
- Standard & Poor’s Global (SPGI)
- Starbucks (SBUX)
- Stericycle (SRCL)
- Waste Connections (WCN)
Round Table Session Recordings Added
- February 2017 (EPAM, CSD, MD, SYNA)
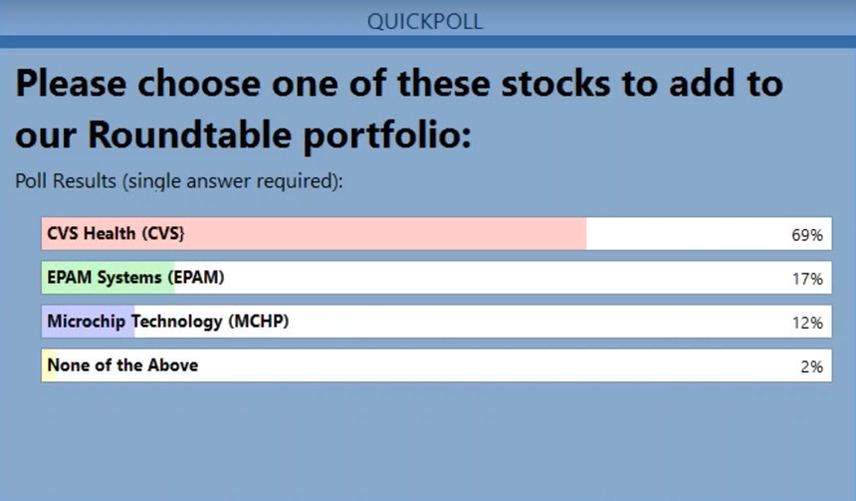
- March 2017 (EPAM,CVS, MCHP)
- April 2017 (BMY, HSNI, MMS)
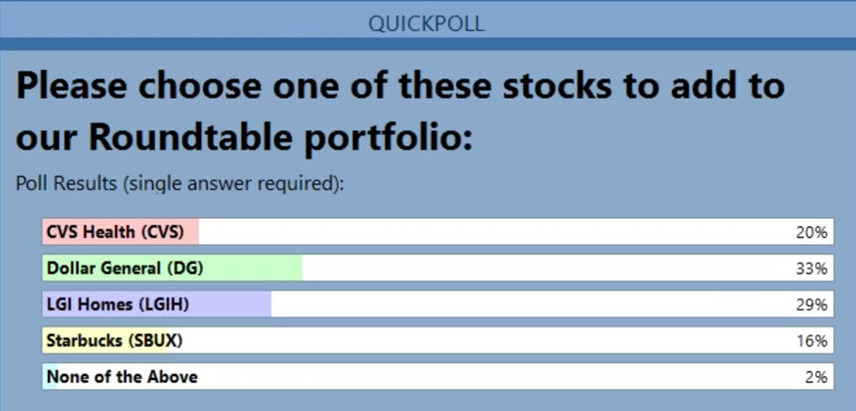
- May 2017 (CVS, LGIH, SBUX, DG)
- June 2017 (EPAM, KR, MIDD)
- July 2017 (GE, GNTX, PCLN, ZOES)
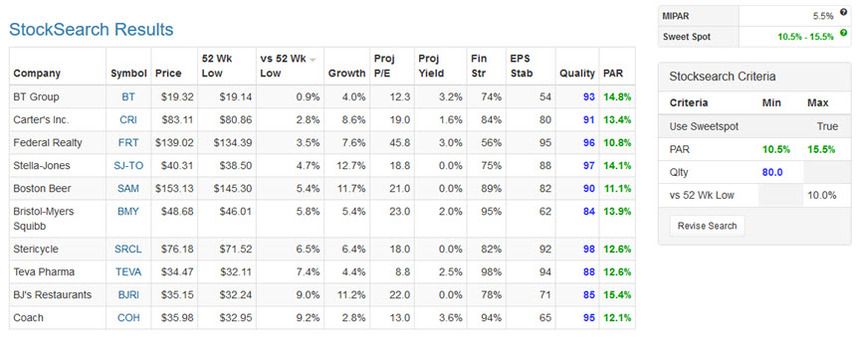
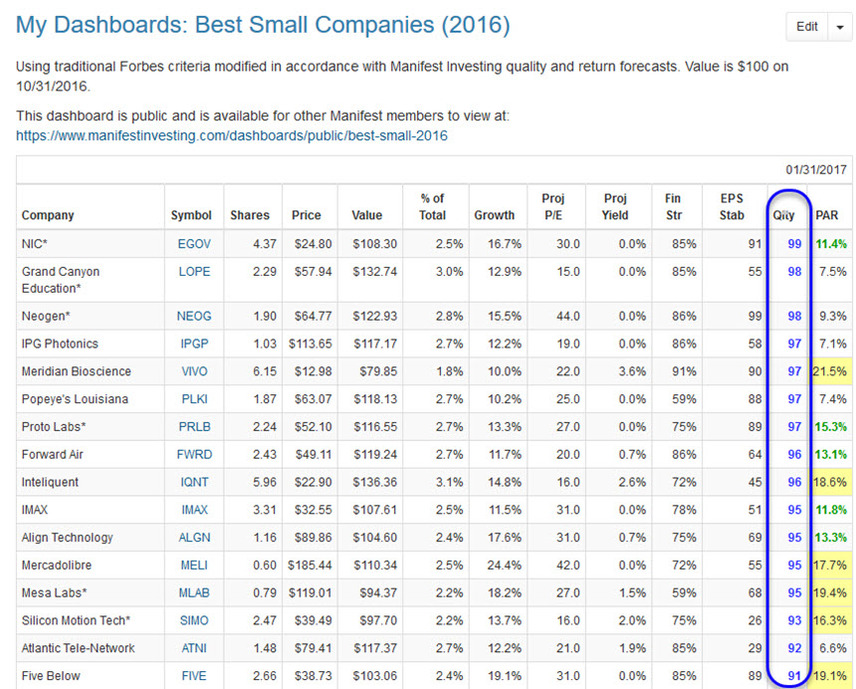
Best Small Companies
- 3. Forward Air (FWRD)
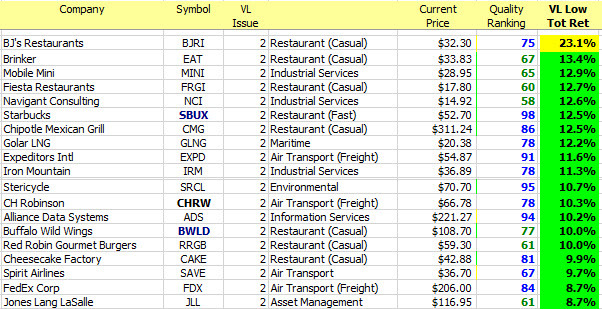
- 13. BJ’s Restaurants (BJRI)
Results, Remarks & References