Round Table (July 2018)

Our Round Table … is a free monthly webcast that celebrated its 8th anniversary on 7/31/2018.  The concept is simple. Contributors share their best current actionable ideas. Rinse. Repeat. Beat the market. The rate of return for the tracking portfolio (since inception) is 18.2% — topping the Wilshire 5000 by 5.5 percentage points.  The monthly sessions are sponsored by the NAIC Mid-Michigan chapter and Manifest Investing and stock selections/analysis and portfolio stewardship is demonstrated by a number of community participants who have successful stock selection experience and superior performance.

Round Table (July 2018)

The rate of return for the Round Table tracking portfolio stands at 18.2% over the last 8.0 years.

Our July Round Table celebrated our 8th anniversary. It all started with, “Sure … a monthly demonstration of WHAT WE DO would be great … but NO COSTUMES!” — Ken ‘Party Wrecker’ Kavula.  (July 2010)

So no costumes. Occasional hats.

Frequent solid ideas for further study.


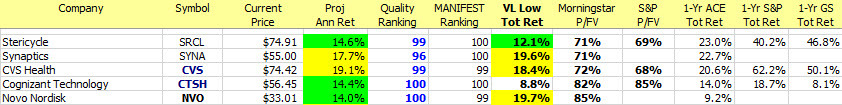
Stocks featured during the July session included Cognizant Technology (CTSH) — our most frequently selected stock over the trailing eight years, Coherent (COHR), Ionis Pharma (IONS) and Skechers (SKX).  The audience selected Coherent (COHR).

The slides used during the session are available on request via Mark Robertson (markr@manifestinvesting.com).

The video archive is available via YouTube at Round Table — July 2018 If you’d like to be notified whenever videos are uploaded to this channel, subscribe using the button on the page.

Green Room, References Mentioned …

IPG Photonics (IPGP) took quite a hit in trading on Tuesday with the price dropping approximately 26% during the day. See Why IPG Is Falling Hard (Brian Feroldi, Motley Fool) for more information on the situation. The drop would have been enough to dislodge IPGP as the best performing stock from 2016 if Tuesday’s price action were included. We noted that Mark’s selection of Mercadolibre (MELI) would be the new leader for active holdings from 2016.

Signature Bank (SBNY) appeared at the top of the “Closest to 52-Week Low” screen used during the session. Investors are reminded that Eddy Elfenbein of Crossing Wall Street follows SBNY fairly closely as a component of his current Buy List and a number of play-by-play commentaries can be found there. Go to the site and search by ticker (SBNY) if you’re interested in a plethora of features regarding Signature Bank.

Attophysics defined.

One of the books mentioned during the session was Factfulness by Hans Rosling. I’m sure that we’ll be talking more about this in coming weeks and months. For more on this, check out the Forum Post by Sunil Veluvali

The Basics of Tariffs and Trade Barriers (Investopedia)

Links to Challenge Stock Audits:

None of the challenge stocks were sold but we dialed up vigilance on Cambrex (CBM) if the price continues to run in the absence of a robust increase in fundamental expectations.

The tracking portfolio (dashboard) can be found at https://www.manifestinvesting.com/dashboards/public/round-table


Fave Five (12/30/2016)

Fave Five (12/30/2016)

The primary screening criteria is the MANIFEST Rank, our combination of return forecast and quality. By screening for companies greater than 99.44 — we’re looking at the top half of the top percentage of companies qualifying.

This week’s stock study selections are top shelf candidates — right next to the holiday elf.

For context, the average 1-year ACE total return forecast is currently 8.3% for the approximately 2400 companies in our coverage.

The Fave Five This Week: Five Ideas to Float

  • Abbvie (ABBV)
  • Buffalo Wild Wings (BWLD)
  • Cognizant Technology (CTSH)
  • CVS Health (CVS)
  • Silicon Motion Tech (SIMO)

The Long and Short of This Week’s Fave Five (Ivory Soap Special Edition)

Fave Five: The Long & Short. (December 30, 2016) Projected Annual Return (PAR): Long term return forecast based on fundamental analysis and five year time horizon. Quality Ranking: Percentile ranking of composite that includes financial strength, earnings stability and relative growth & profitability. VL Low Total Return (VLLTR): Low total return forecast based on 3-5 year price targets via Value Line Investment Survey. Morningstar P/FV: Ratio of current price to fundamentally-based fair value via www.morningstar.com S&P P/FV: Current price-to-fair value ratio via Standard & Poor’s. 1-Year ACE Outlook: Total return forecast based on analyst consensus estimates for 1-year target price combined with current yield. The data is ranked (descending order) based on this criterion. 1-Year S&P Outlook: 1-year total return forecast based on S&P 1-year price target. 1-Yr GS: 1-year total return forecast based on most recent price target issued by Goldman Sachs.

Fave Five Legacy (Tracking Portfolio)

The relative/excess return for the Fave Five tracking portfolio is +3.1% since inception. 44.4% of selections have outperformed the Wilshire 5000 since original selection.

Tracking Dashboard: https://www.manifestinvesting.com/dashboards/public/fave-five

Fave Five (11/18/2016)

Fave Five (11/18/2016)

Our Fave Five essentially represents a listing of stocks with favorable short term total return forecasts (1 year, according to Analyst Consensus Estimates, or ACE) combined with strong long-term return forecasts and good/excellent quality rankings.

This week, we seek the companies with the best return forecasts, highest quality and in a tribute to www.morningstar.com — the companies with the lowest price-to-fair value ratios as being potentially “on sale.” Context: A P/FV = 100% would indicate that a stock is priced at its fair value according to Morningstar.

The Fave Five This Week

  • Cognizant Technology (CTSH)
  • CVS Health (CVS)
  • Novo Nordisk (NVO)
  • Stericycle (SRCL)
  • Synaptics (SYNA)

The Long and Short of This Week’s Fave Five

The Long & Short. (November 18, 2016) Projected Annual Return (PAR): Long term return forecast based on fundamental analysis and five year time horizon. Quality Ranking: Percentile ranking of composite that includes financial strength, earnings stability and relative growth & profitability. VL Low Total Return (VLLTR): Low total return forecast based on 3-5 year price targets via Value Line Investment Survey. Morningstar P/FV: Ratio of current price to fundamentally-based fair value via www.morningstar.com S&P P/FV: Current price-to-fair value ratio via Standard & Poor’s. 1-Year ACE Outlook: Total return forecast based on analyst consensus estimates for 1-year target price combined with current yield. The data is ranked (descending order) based on this criterion. 1-Year S&P Outlook: 1-year total return forecast based on S&P 1-year price target. 1-Yr GS: 1-year total return forecast based on most recent price target issued by Goldman Sachs.

Weekend Warriors

The relative/excess return for the Weekend Warrior tracking portfolio is +5.0% since inception. 50.7% of selections have outperformed the Wilshire 5000 since original selection.

Tracking Dashboard: https://www.manifestinvesting.com/dashboards/public/weekend-warriors

Fave Five (10/21/2016)

Fave Five (10/21/2016)

Our Fave Five essentially represents a listing of stocks with favorable short term total return forecasts (1 year, according to Analyst Consensus Estimates, or ACE) combined with strong long-term return forecasts and good/excellent quality rankings.

So you’re looking at the stocks in the top 1% of all companies according to MANIFEST Rank (Return Forecast and Quality combination) that have the highest 1-year total return forecasts according to the analyst consensus estimates. (ACE)

The Fave Five This Week

  • Air Lease (AL)
  • Celgene (CELG)
  • Cognizant Technology (CTSH)
  • Novo Nordisk (NVO)
  • Universal Display (OLED)

Context: The median 1-year return forecast (ACE) is 10.6%.

The Long and Short of This Week’s Fave Five

The Long & Short. (October 21, 2016) Projected Annual Return (PAR): Long term return forecast based on fundamental analysis and five year time horizon. Quality Ranking: Percentile ranking of composite that includes financial strength, earnings stability and relative growth & profitability. VL Low Total Return (VLLTR): Low total return forecast based on 3-5 year price targets via Value Line Investment Survey. Morningstar P/FV: Ratio of current price to fundamentally-based fair value via www.morningstar.com S&P P/FV: Current price-to-fair value ratio via Standard & Poor’s. 1-Year ACE Outlook: Total return forecast based on analyst consensus estimates for 1-year target price combined with current yield. The data is ranked (descending order) based on this criterion. 1-Year S&P Outlook: 1-year total return forecast based on S&P 1-year price target. 1-Yr GS: 1-year total return forecast based on most recent price target issued by Goldman Sachs.

Weekend Warriors

The relative/excess return for the Weekend Warrior tracking portfolio is +12.9% since inception. 42.6% of selections have outperformed the Wilshire 5000 since original selection.

Tracking Dashboard: https://www.manifestinvesting.com/dashboards/public/weekend-warriors

Fave Five (10/14/2016)

Fave Five (10/14/2016)

Our Fave Five essentially represents a listing of stocks with favorable short term total return forecasts (1 year, according to Analyst Consensus Estimates, or ACE) combined with strong long-term return forecasts and good/excellent quality rankings.

So you’re looking at the stocks in the top 1% of all companies according to MANIFEST Rank (Return Forecast and Quality combination) that have the highest 1-year total return forecasts according to the analyst consensus estimates. (ACE)

The Fave Five This Week

  • Aaron’s Rents (AAN)
  • Celgene (CELG)
  • Cognizant Technology (CTSH)
  • Novo Nordisk (NVO)
  • Universal Display (OLED)

Context: The median 1-year return forecast (ACE) is 9.9%.

The Long and Short of This Week’s Fave Five

The Long & Short. (October 14, 2016) Projected Annual Return (PAR): Long term return forecast based on fundamental analysis and five year time horizon. Quality Ranking: Percentile ranking of composite that includes financial strength, earnings stability and relative growth & profitability. VL Low Total Return (VLLTR): Low total return forecast based on 3-5 year price targets via Value Line Investment Survey. Morningstar P/FV: Ratio of current price to fundamentally-based fair value via www.morningstar.com S&P P/FV: Current price-to-fair value ratio via Standard & Poor’s. 1-Year ACE Outlook: Total return forecast based on analyst consensus estimates for 1-year target price combined with current yield. The data is ranked (descending order) based on this criterion. 1-Year S&P Outlook: 1-year total return forecast based on S&P 1-year price target. 1-Yr GS: 1-year total return forecast based on most recent price target issued by Goldman Sachs.

Weekend Warriors

The relative/excess return for the Weekend Warrior tracking portfolio is +9.8% since inception. 44.3% of selections have outperformed the Wilshire 5000 since original selection.

Tracking Dashboard: https://www.manifestinvesting.com/dashboards/public/weekend-warriors

MANIFEST 40 Update (9/30/2016)

Our MANIFEST 40 is a celebration of collective excellence in stock selection, strategy and disciplined patience.

“We have always believed that the collective decisions made by our community of long-term investors are worth huddling over … a place where ideas are born.”

The 40 stocks are something of a barometer because we know that these community favorites are not simply followed … most of them are also widely owned, with considerable diligence and vigilance.

The rate of return remains at 8.8% since inception (9/30/2005) vs. 5.8% for matching investments in the Wilshire 5000 for an excess/relative return of +3.0%. We believe that this portends success for many of our subscribers and investors.

MANIFEST 40: September 2016. Performance Results. These are the most widely followed stocks by Manifest Investing subscribers. Current leader Apple (AAPL) was added on 9/24/2009 and steadily climbed the ranks while generating a relative return of +19.1% (annualized). Figures in parentheses are the June 2016 rankings. Tracking dashboard: https://www.manifestinvesting.com/dashboards/public/manifest-40

Quality is still solid at 90 and the overall return forecast is 9.0%, pegged to slightly outperform the Wilshire 5000 or S&P 500. The average sales growth forecast is 6.6%. Again, we’d like to see an emphasis on discovering smaller, faster-growing companies — the focus of our Discovery Club efforts. We miss smaller, less discovered, companies poised to make difference, like Bio-Reference Labs (BRLI) did.

The top performers continue to be Apple (AAPL), Cognizant Technology (CTSH), Starbucks (SBUX), and Home Depot (HD). 57.5% of the decisions have outperformed the market.

Capturing Attention: Charger

CVS Health (CVS) advanced from #34 to #29. We’ve noted that CVS has been ubiquitous on screening results for a while and collectively, you’ve noticed. Fastenal and Microsoft swapped positions in the top 5 but there are no new entries to the 40 this quarter.

The results of $100 invested into any of these positions at the time of addition can be viewed at any time at: https://www.manifestinvesting.com/dashboards/public/manifest-40

We’ll continue to hope that a few promising faster growers will penetrate a future roll call.

Fave Five (9/16/2016)

Fave Five (9/16/2016)

Our Fave Five essentially represents a listing of stocks with favorable short term total return forecasts (1 year, according to Analyst Consensus Estimates, or ACE) combined with strong long-term return forecasts and good/excellent quality rankings.

So you’re looking at the stocks in the top 1% of all companies according to MANIFEST Rank (Return Forecast and Quality combination) that have the highest 1-year total return forecasts according to the analyst consensus estimates. (ACE)

The Fave Five This Week

  • Aaron’s (AAN)
  • Celgene (CELG)
  • Cognizant Tech (CTSH)
  • CVS Health (CVS)
  • Jazz Pharma (JAZZ)
  • Spirit Airlines (SAVE)

Context: The average 1-year total return forecast for the Value Line 1700 is 14.7%. The average 5-year return forecast for $VLE is 5.0% (annualized).

The Long and Short of This Week’s Fave Five

The Long & Short. (September 16, 2016) Projected Annual Return (PAR): Long term return forecast based on fundamental analysis and five year time horizon. Quality Ranking: Percentile ranking of composite that includes financial strength, earnings stability and relative growth & profitability. VL Low Total Return (VLLTR): Low total return forecast based on 3-5 year price targets via Value Line Investment Survey. Morningstar P/FV: Ratio of current price to fundamentally-based fair value viawww.morningstar.com S&P P/FV: Current price-to-fair value ratio via Standard & Poor’s. 1-Year ACE Outlook: Total return forecast based on analyst consensus estimates for 1-year target price combined with current yield. The data is ranked (descending order) based on this criterion. 1-Year S&P Outlook: 1-year total return forecast based on S&P 1-year price target. 1-Yr GS: 1-year total return forecast based on most recent price target issued by Goldman Sachs.

Weekend Warriors

The relative/excess return for the Weekend Warrior tracking portfolio is +5.8% since inception. 53.4% of selections have outperformed the Wilshire 5000 since original selection.

Tracking Dashboard: https://www.manifestinvesting.com/dashboards/public/weekend-warriors

Fave Five (8/19/2016)

Fave Five (8/19/2016)

Our Fave Five essentially represents a listing of stocks with favorable short term total return forecasts (1 year, according to Analyst Consensus Estimates, or ACE) combined with strong long-term return forecasts and good/excellent quality rankings. This week’s batch is a nod to Cy Lynch and Anne Manning who prefer considerable financial strength when return forecasts ebb lower. We also required top quintile EPS Stability — for dividend lovers, a bedrock of EPS is the source of dividends (along with the company check book.) Some of these are flying at lower altitudes — an acceptable condition for core positions but Morningstar believes all five have the potential to outperform the market over the long term.

The Fave Five This Week

  • Alphabet/Google (GOOG)
  • Cognizant Technology (CTSH)
  • Granger, W.W. (GWW)
  • Microsoft (MSFT)
  • Novartis (NVS)

Context: The average 1-year total return forecast (via ACE) for the Value Line 1700 is 14.2%. The average 5-year return forecast for $VLE is 6.6% (annualized).

The Long and Short of This Week’s Fave Five

The Long & Short. (August 19, 2016) Projected Annual Return (PAR): Long term return forecast based on fundamental analysis and five year time horizon. Quality Ranking: Percentile ranking of composite that includes financial strength, earnings stability and relative growth & profitability. VL Low Total Return (VLLTR): Low total return forecast based on 3-5 year price targets via Value Line Investment Survey. Morningstar P/FV: Ratio of current price to fundamentally-based fair value via www.morningstar.com S&P P/FV: Current price-to-fair value ratio via Standard & Poor’s. 1-Year ACE Outlook: Total return forecast based on analyst consensus estimates for 1-year target price combined with current yield. The data is ranked (descending order) based on this criterion. 1-Year S&P Outlook: 1-year total return forecast based on S&P 1-year price target. 1-Yr GS: 1-year total return forecast based on most recent price target issued by Goldman Sachs.

Weekend Warriors

The return for the Weekend Warrior tracking portfolio is 11.6% since inception. 43.2% of selections have outperformed the Wilshire 5000 since original selection.

Tracking Dashboard: https://www.manifestinvesting.com/dashboards/public/weekend-warriors

Fave Five (8/5/2016)

We took a different tack this week, focusing on companies with HUGE financial strength and combining those leaders with the best 1-year “sentiment” known as target prices. This week’s companies are: Alphabet (GOOG), Cognizant Technology (CTSH), Disney (DIS), Novartis (NVS) and Starbucks (SBUX).

Fave Five (8/5/2016)

Our Fave Five essentially represents a listing of stocks with favorable short term total return forecasts (1 year, according to Analyst Consensus Estimates, or ACE) combined with strong long-term return forecasts and good/excellent quality rankings.

The Fave Five This Week

  • Alphabet (GOOG)
  • Cognizant Technology (CTSH)
  • Disney, Walt (DIS)
  • Novartis (NVS)
  • Starbucks (SBUX)

Context: The average 1-year total return forecast (via ACE) for the Value Line 1700 is 15.7%. The average 5-year return forecast for $VLE is 5.9% (annualized).

The Long and Short of This Week’s Fave Five

The Long & Short. (August 5, 2016) Projected Annual Return (PAR): Long term return forecast based on fundamental analysis and five year time horizon. Quality Ranking: Percentile ranking of composite that includes financial strength, earnings stability and relative growth & profitability. VL Low Total Return (VLLTR): Low total return forecast based on 3-5 year price targets via Value Line Investment Survey. Morningstar P/FV: Ratio of current price to fundamentally-based fair value via www.morningstar.com S&P P/FV: Current price-to-fair value ratio via Standard & Poor’s. 1-Year ACE Outlook: Total return forecast based on analyst consensus estimates for 1-year target price combined with current yield. The data is ranked (descending order) based on this criterion. 1-Year S&P Outlook: 1-year total return forecast based on S&P 1-year price target. 1-Yr GS: 1-year total return forecast based on most recent price target issued by Goldman Sachs.

Weekend Warriors

The relative return for the Weekend Warrior tracking portfolio is +4.3% since inception. 47.2% of selections have outperformed the Wilshire 5000 since original selection.

Tracking Dashboard: https://www.manifestinvesting.com/dashboards/public/weekend-warriors

Stocks to Study (5/13/2016)

This Week at MANIFEST (5/13/2016)

“Science and technology revolutionize our lives, but memory, tradition and myth frame our response.” – Arthur Schlesinger

“The real danger is not that computers will begin to think like men, but that men will begin to think like computers.” – Sydney Harris

This week’s update batch has a number of community favorites in the mix. The following companies are all members of the MANIFEST 40 — the most widely-followed companies by our subscribers:

  • Cognizant Technology (2)
  • Microsoft (3)
  • Oracle Corp. (16)
  • Alphabet/Google (19)
  • Wells Fargo (22)
  • Price T. Rowe (36)

Amazon (AMZN) has been an important contributor to Hugh McManus and his superior returns as a participant in the Round Table. AMZN ranks as the all-time leading selection despite that lonely selection in Chicago a few years ago. Other companies that have been featured in Round Table sessions include: Alphabet/Google (GOOG), Bank of America (BAC), Bank of New York Mellon (BK), Cognizant Technology (CTSH), eBay (EBAY), Global Payments (GPN), Infosys Tech (INFY), Microsoft (MSFT), Oracle (ORCL), PayPal (PYPL), Priceline (PCLN), SEI Investments (SEIC), T. Rowe Price (TROW) and Western Union (WU).

Results, Remarks & References

Companies of Interest: Value Line (5/13/2016)

The average Value Line low total return forecast for the companies in this week’s update batch is 6.9% vs. 5.4% for the Value Line 1700 ($VLE).

Materially Stronger: SLM (SLM), Priceline.com (PCLN), Western Union (WU), BlackRock (BLK), Earthlink (ELNK), Adobe Systems (ADBE), Facebook (FB), Overstock.com (OSTK), Amazon (AMZN)

Materially Weaker: Invesco (IVZ), EZCorp (EZPW)

Discontinued:

Coverage Initiated/Restored:

Market Barometers

Value Line Low Total Return (VLLTR) Forecast. The long-term low total return forecast for the 1700 companies featured in the Value Line Investment Survey is 5.4%, unchanged from 5.4% last week. For context, this indicator has ranged from low single digits (when stocks are generally overvalued) to approximately 20% when stocks are in the teeth of bear markets like 2008-2009.

Stocks to Study (5/13/2016)

  • RedHat (RHT) — Highest MANIFEST Rank
  • Citigroup ( C ) — Highest Low Return Forecast (VL)
  • Priceline (PCLN) — Lowest P/FV (Morningstar)
  • Priceline (PCLN) —Lowest P/FV (S&P)
  • H&R Block (HRB) — Best 1-Yr Outlook (ACE)
  • Symantec (SYMC) — Best 1-Yr Outlook (S&P)
  • Netflix (NFLX) — Best 1-Yr Outlook (GS)

The Long & Short of This Week’s Update Batch

The Long & Short. (May 13, 2016) Projected Annual Return (PAR): Long term return forecast based on fundamental analysis and five year time horizon. Quality Ranking: Percentile ranking of composite that includes financial strength, earnings stability and relative growth & profitability. VL Low Total Return (VLLTR): Low total return forecast based on 3-5 year price targets via Value Line Investment Survey. Morningstar P/FV: Ratio of current price to fundamentally-based fair value via www.morningstar.com S&P P/FV: Current price-to-fair value ratio via Standard & Poor’s. 1-Year ACE Outlook: Total return forecast based on analyst consensus estimates for 1-year target price combined with current yield. The data is ranked (descending order) based on this criterion. 1-Year S&P Outlook: 1-year total return forecast based on S&P 1-year price target. 1-Yr “GS” Outlook: 1-year total return forecast based on most recent price target issued by Goldman Sachs.

May Round Table May 22, 2016 at 11 AM ET ONLINE

Stocks Featured: TBD

The Round Table tracking portfolio has beaten the market by 3-4 percentage points over the last five years. Consider joining Ken Kavula, Cy Lynch and Mark Robertson as they share their current favorite stock study ideas.

The May session will be simulcast from the NAIC Better Investing national convention near Washington D.C.

Registration: https://attendee.gotowebinar.com/register/8401811825391796481