


We up the ante on last week’s shopping theme as this week’s update includes a mother lode of retail and we resume our monthly shopping fireside chat with Tuesday night’s Round Table.
In order to help our subscribers find the companies that are “way off the map,” we’re expanding and digging into some areas that will provide a wider berth of study opportunities.

Round Table Stocks: Coach (COH), Costco Wholesale (COST), Dollar Tree Stores (DLTR), Fossil (FOSL), Hibbett Sporting Goods (HIBB), Vera Bradley (VRA)
Results, Remarks & References
The average Value Line low total return forecast for the companies in this week’s update batch is 6.6% vs. 5.7% for the Value Line 1700 ($VLE).

Materially Stronger: IMAX (IMAX)
Materially Weaker: Conn’s (CONN), Buckle (BKE), Ralph Lauren (RL), Nordstrom (JWN), Penney (JCP), Gap (GPS)
Discontinued: Aeropostale (ARO), Pacific Sunwear (PSUN)
Value Line Low Total Return (VLLTR) Forecast. The long-term low total return forecast for the 1700 companies featured in the Value Line Investment Survey is 5.7%, down from 5.9% last week. For context, this indicator has ranged from low single digits (when stocks are generally overvalued) to approximately 20% when stocks are in the teeth of bear markets like 2008-2009.

The Long & Short. (July 29, 2016) Projected Annual Return (PAR): Long term return forecast based on fundamental analysis and five year time horizon. Quality Ranking: Percentile ranking of composite that includes financial strength, earnings stability and relative growth & profitability. VL Low Total Return (VLLTR): Low total return forecast based on 3-5 year price targets via Value Line Investment Survey. Morningstar P/FV: Ratio of current price to fundamentally-based fair value via www.morningstar.com S&P P/FV: Current price-to-fair value ratio via Standard & Poor’s. 1-Year ACE Outlook: Total return forecast based on analyst consensus estimates for 1-year target price combined with current yield. The data is ranked (descending order) based on this criterion. 1-Year S&P Outlook: 1-year total return forecast based on S&P 1-year price target. 1-Yr “GS” Outlook: 1-year total return forecast based on most recent price target issued by Goldman Sachs.
![]()
“Dump your hedge funds and explore their small-cap stock picks.”
Small cap is not necessarily small (faster-growing) companies but in general, we like the idea of a nice blend. So yes, we’re interested in hunting down some actionable ideas among the most successful investors on our radar screen — seeking companies that aren’t on too many radar screens, yet.
The discovery of smaller, promising and faster-growing companies has always been one of our favorite (and rewarding) activities. In that spirit, we’re expanding our efforts in this realm. This week, we redouble our efforts to discover some smaller, less discovered companies and add them to our coverage. The EXTENDED EDITION of the Value Line Investment Survey will be the first resource scanned and we’ll also take a look at some new positions or significant accumulations among our Best Small Company Funds starting with Brown Small Company.
But it doesn’t end with only the smaller companies, we’ll also be vigilant for opportunities flagged by reviewing the quarterly filings of idea generation resources like the Renaissance Technologies hedge fund.
This Week’s Sources and Suggestions
Coverage Initiated/Restored: Fox Factory (FOXF), Bank Mutual (BKMU), ESSA Bancorp (ESSA), First Clover Leaf Financial (FCLF), First Defiance Financial (FDEF), First Savings Financial (FSFG), Greene County Bancorp (GCBC), Home Bancorp (HBCP), Pathfinder Bancorp (PBHC), Timberland Bancorp (TSBK), United Community Bancorp (UCBA)
![]()
Our Fave Five essentially represents a listing of stocks with favorable short term total return forecasts (1 year, according to Analyst Consensus Estimates, or ACE) combined with strong long-term return forecasts and good/excellent quality rankings.
The Fave Five This Week
Context: The average 1-year total return forecast (via ACE) for the Value Line 1700 is 16.1%. The median 5-year return forecast for $VLE is 6.8% (annualized).

The Long & Short. (July 29, 2016) Projected Annual Return (PAR): Long term return forecast based on fundamental analysis and five year time horizon. Quality Ranking: Percentile ranking of composite that includes financial strength, earnings stability and relative growth & profitability. VL Low Total Return (VLLTR): Low total return forecast based on 3-5 year price targets via Value Line Investment Survey. Morningstar P/FV: Ratio of current price to fundamentally-based fair value via www.morningstar.com S&P P/FV: Current price-to-fair value ratio via Standard & Poor’s. 1-Year ACE Outlook: Total return forecast based on analyst consensus estimates for 1-year target price combined with current yield. The data is ranked (descending order) based on this criterion. 1-Year S&P Outlook: 1-year total return forecast based on S&P 1-year price target. 1-Yr GS: 1-year total return forecast based on most recent price target issued by Goldman Sachs.
The relative return for the Weekend Warrior tracking portfolio is +1.5% since inception. 44.9% of selections have outperformed the Wilshire 5000 since original selection.
Tracking Dashboard: https://www.manifestinvesting.com/dashboards/public/weekend-warriors
![]()
Our Fave Five essentially represents a listing of stocks with favorable short term total return forecasts (1 year, according to Analyst Consensus Estimates, or ACE) combined with strong long-term return forecasts and good/excellent quality rankings.
The Fave Five This Week
Context: The average 1-year total return forecast (via ACE) for the Value Line 1700 is 17.6%. The median 5-year return forecast for $VLE is 6.9% (annualized).

The Long & Short. (July 22, 2016) Projected Annual Return (PAR): Long term return forecast based on fundamental analysis and five year time horizon. Quality Ranking: Percentile ranking of composite that includes financial strength, earnings stability and relative growth & profitability. VL Low Total Return (VLLTR): Low total return forecast based on 3-5 year price targets via Value Line Investment Survey. Morningstar P/FV: Ratio of current price to fundamentally-based fair value via www.morningstar.com S&P P/FV: Current price-to-fair value ratio via Standard & Poor’s. 1-Year ACE Outlook: Total return forecast based on analyst consensus estimates for 1-year target price combined with current yield. The data is ranked (descending order) based on this criterion. 1-Year S&P Outlook: 1-year total return forecast based on S&P 1-year price target. 1-Yr GS: 1-year total return forecast based on most recent price target issued by Goldman Sachs.
The relative return for the Weekend Warrior tracking portfolio is +5.0% since inception. 46.9% of selections have outperformed the Wilshire 5000 since original selection.
Tracking Dashboard: https://www.manifestinvesting.com/dashboards/public/weekend-warriors
![]()
Our Fave Five essentially represents a listing of stocks with favorable short term total return forecasts (1 year, according to Analyst Consensus Estimates, or ACE) combined with strong long-term return forecasts and good/excellent quality rankings.
The Fave Five This Week
Context: The average 1-year total return forecast (via ACE) for the Value Line 1700 is 18.2%. The median 5-year return forecast for $VLE is 6.9% (annualized).
The Long & Short. (July 15, 2016) Projected Annual Return (PAR): Long term return forecast based on fundamental analysis and five year time horizon. Quality Ranking: Percentile ranking of composite that includes financial strength, earnings stability and relative growth & profitability. VL Low Total Return (VLLTR): Low total return forecast based on 3-5 year price targets via Value Line Investment Survey. Morningstar P/FV: Ratio of current price to fundamentally-based fair value via www.morningstar.com S&P P/FV: Current price-to-fair value ratio via Standard & Poor’s. 1-Year ACE Outlook: Total return forecast based on analyst consensus estimates for 1-year target price combined with current yield. The data is ranked (descending order) based on this criterion. 1-Year S&P Outlook: 1-year total return forecast based on S&P 1-year price target. 1-Yr GS: 1-year total return forecast based on most recent price target issued by Goldman Sachs.
The relative return for the Weekend Warrior tracking portfolio is +3.0% since inception. 46.9% of selections have outperformed the Wilshire 5000 since original selection.
Tracking Dashboard: https://www.manifestinvesting.com/dashboards/public/weekend-warriors

“Self-taught, are you?” Julian Castle asked Newt.
“Isn’t everybody?” Newt inquired.
“Very good answer.” ― Kurt Vonnegut, Cat’s Cradle
Winter is Coming.
Huh? “We’re melting over here and you want to talk about winter?”
Well, yes.
This week’s update batch is pretty “dormant.” We’ve been doing this for a long time and don’t remember the last time we had so few changes and/or materially stronger/weaker triggers. There’s only a couple in this week’s batch.
And yes, it’s the lazy hazy days of summer when Wall Street packs it in early on Fridays, heads for the Hamptons, and the trading volumes wane. So we pass the ice cream and our thoughts turn to January.
January?
The January Effect is a result of tax-loss selling which causes investors to sell their losing positions at the end of December. The January Effect is predicated on the idea that these stocks, which have been sold off to realize the tax losses, will be at a discount to their market value.
And the effect is most prominently manifested among the smaller, faster-growing companies.
This is a best practice that we’ve counseled in the past. Start earlier. Don’t wait. Sell earlier (because the institutions are probably doing this) and build your shopping lists well. Hunt down the opportunities during the fourth quarter and use your best judgment about assuming ownership as the year winds down … or early in January.
In that spirit, Manifest Investing will be working to add more small companies. Every week we see a persistent attrition and a loss of companies in the Value Line universe of 6000+ companies as M&A continues and fewer new companies take shape. We’ll be gearing up for our Best Small Company list to be published around Halloween and will be adding companies in earnest between now and October 1. Monitor the coverage list here in the weekly updates for opportunity and Ken Kavula has suggested that he will chime in on discoveries of promising faster growers as they come into focus.
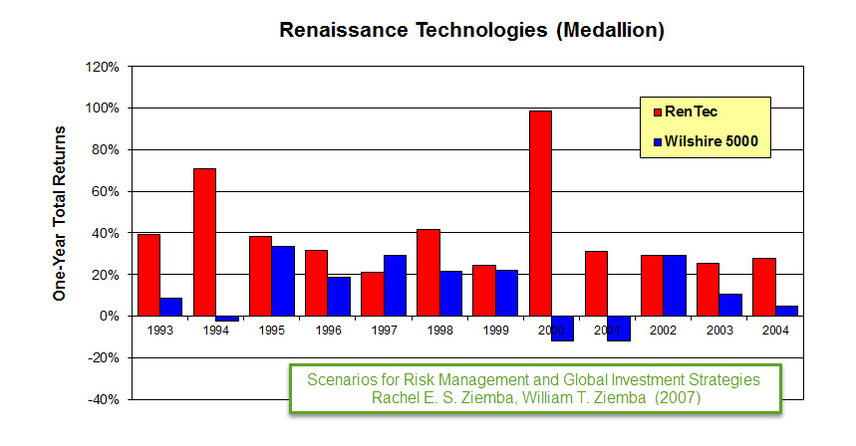
We’re also going to mine the list of holdings at Renaissance Technologies (RenTec) using a variety of resource including www.insidermonkey.com. Why monitor the exploits of Jim Simons and his team??? (1) Check out this TED Talk: The Mathematician Who Cracked The Wall Street Code and (2) this excerpt of the hedge fund’s track record …
Round Table Stocks: ABB (ABB), MSC Industrial (MSM), Stifel Financial (SF)
Results, Remarks & References
The average Value Line low total return forecast for the companies in this week’s update batch is 4.9% vs. 6.0% for the Value Line 1700 ($VLE).

Materially Stronger: AAON (AAON)
Materially Weaker: Stonemor (STON)
Discontinued: Constant Contact (CTCT)
Coverage Initiated/Restored: LGI Homes (LGIH), United-Guardian (UG), Nature’s Sunshine (NATR), WCI Communities (WCIC), Clearwater Paper (CLW), Huttig Building (HBP), Mastech (MHH), Citizen’s Holding (CIZN), United Bankshares (UBOH), Citizen’s Financial (CFG), Liberty Interactive (QVCA)

Value Line Low Total Return (VLLTR) Forecast. The long-term low total return forecast for the 1700 companies featured in the Value Line Investment Survey is 6.0%, down from 6.1% last week. For context, this indicator has ranged from low single digits (when stocks are generally overvalued) to approximately 20% when stocks are in the teeth of bear markets like 2008-2009.


The Long & Short. (July 15, 2016) Projected Annual Return (PAR): Long term return forecast based on fundamental analysis and five year time horizon. Quality Ranking: Percentile ranking of composite that includes financial strength, earnings stability and relative growth & profitability. VL Low Total Return (VLLTR): Low total return forecast based on 3-5 year price targets via Value Line Investment Survey. Morningstar P/FV: Ratio of current price to fundamentally-based fair value via www.morningstar.com S&P P/FV: Current price-to-fair value ratio via Standard & Poor’s. 1-Year ACE Outlook: Total return forecast based on analyst consensus estimates for 1-year target price combined with current yield. The data is ranked (descending order) based on this criterion. 1-Year S&P Outlook: 1-year total return forecast based on S&P 1-year price target. 1-Yr “GS” Outlook: 1-year total return forecast based on most recent price target issued by Goldman Sachs.
![]()
From the article, “How To Beat The Market By 20 Percentage Points”, the author suggested:
“Dump your hedge funds and imitate their small-cap stock picks.”
Small cap is not necessarily small (faster-growing) companies but in general, we like the idea of a nice blend. So yes, we’re interested in hunting down some actionable ideas among the most successful investors on our radar screen — seeking companies that aren’t on too many radar screens, yet.
The discovery of smaller, promising and faster-growing companies has always been one of our favorite (and rewarding) activities. In that spirit, we’re expanding our efforts in this realm. This week, we redouble our efforts to discover some smaller, less discovered companies and add them to our coverage. The EXTENDED EDITION of the Value Line Investment Survey will be the first resource scanned and we’ll also take a look at some new positions or significant accumulations among our Best Small Company Funds starting with Brown Small Company.
But it doesn’t end with only the smaller companies, we’ll also be vigilant for opportunities flagged by reviewing the quarterly filings of idea generation resources like the Renaissance Technologies hedge fund.
Coverage Initiated/Restored: LGI Homes (LGIH), United-Guardian (UG), Nature’s Sunshine (NATR), WCI Communities (WCIC), Clearwater Paper (CLW), Huttig Building (HBP), Mastech (MHH), Citizen’s Holding (CIZN), United Bankshares (UBOH), Citizen’s Financial (CFG)

https://www.manifestinvesting.com/dashboards/public/discovery-club-20160715
![]()
“A quick update on our model portfolio: WhiteWave Foods (WWAV), which is our largest holding, received an offer yesterday from Danone to be acquired at $56.40/share.” — Bespoke Investment Group
You know the words.
In today’s news, Company B was bought out at a lavish premium by Company A.
That “premium” is often uninformative — and can be misleading. (Yes, Virginia, that was sugar coating)
The premium is almost always a price comparison to the price of the previous day. Yesterday’s price may or may not be fully “representative” of the value of the company. We look to the return forecast, before and after — and Whitewave via Bespoke provides a pretty good example.
The most recent Value Line report (4/22/2016) on WWAV displayed a return forecast of approximately 8% with a stock price in the high 30s. The $56 offer takes the return forecast closer to zero — a condition that generally suggests a “fair offer” for the company. In some cases, like tech sector stocks, most buyouts happen at -5% to -10% with expectations of synergies, optimization … you know the drill.
So when you hear the news, think what’s PAR on this deal?

![]()
Our Fave Five essentially represents a listing of stocks with favorable short term total return forecasts (1 year, according to Analyst Consensus Estimates, or ACE) combined with strong long-term return forecasts and good/excellent quality rankings.
The Fave Five This Week
Context: The average 1-year total return forecast (via ACE) for the Value Line 1700 is 18.2%. The median 5-year return forecast for $VLE is 6.9% (annualized).

The Long & Short. (July 8, 2016) Projected Annual Return (PAR): Long term return forecast based on fundamental analysis and five year time horizon. Quality Ranking: Percentile ranking of composite that includes financial strength, earnings stability and relative growth & profitability. VL Low Total Return (VLLTR): Low total return forecast based on 3-5 year price targets via Value Line Investment Survey. Morningstar P/FV: Ratio of current price to fundamentally-based fair value via www.morningstar.com S&P P/FV: Current price-to-fair value ratio via Standard & Poor’s. 1-Year ACE Outlook: Total return forecast based on analyst consensus estimates for 1-year target price combined with current yield. The data is ranked (descending order) based on this criterion. 1-Year S&P Outlook: 1-year total return forecast based on S&P 1-year price target. 1-Yr GS: 1-year total return forecast based on most recent price target issued by Goldman Sachs.
The relative return for the Weekend Warrior tracking portfolio is +3.0% since inception. 46.9% of selections have outperformed the Wilshire 5000 since original selection.
Tracking Dashboard: https://www.manifestinvesting.com/dashboards/public/weekend-warriors
![]()
Our Fave Five essentially represents a listing of stocks with favorable short term total return forecasts (1 year, according to Analyst Consensus Estimates, or ACE) combined with strong long-term return forecasts and good/excellent quality rankings.
The Fave Five This Week
Context: The median 1-year total return forecast (via ACE) for the Value Line 1700 is 14.6%. The median 5-year return forecast for $VLE is 7.1% (annualized).
The Long & Short. (July 1, 2016) Projected Annual Return (PAR): Long term return forecast based on fundamental analysis and five year time horizon. Quality Ranking: Percentile ranking of composite that includes financial strength, earnings stability and relative growth & profitability. VL Low Total Return (VLLTR): Low total return forecast based on 3-5 year price targets via Value Line Investment Survey. Morningstar P/FV: Ratio of current price to fundamentally-based fair value via www.morningstar.com S&P P/FV: Current price-to-fair value ratio via Standard & Poor’s. 1-Year ACE Outlook: Total return forecast based on analyst consensus estimates for 1-year target price combined with current yield. The data is ranked (descending order) based on this criterion. 1-Year S&P Outlook: 1-year total return forecast based on S&P 1-year price target. 1-Yr GS: 1-year total return forecast based on most recent price target issued by Goldman Sachs.
The relative return for the Weekend Warrior tracking portfolio is +1.8% since inception. 41.7% of selections have outperformed the Wilshire 5000 since original selection.
Tracking Dashboard: https://www.manifestinvesting.com/dashboards/public/weekend-warriors
