We’re Not In Kansas, Anymore

This Week at MANIFEST (3/27/2020)

“Everybody who has ever invested during our darkest days has ultimately been rewarded. There’s no reason to think this time is different.” — Michael Batnick

“In the next two weeks we will witness a breathtaking degree of human ingenuity. It’s starting to bubble up now. The most capable among us are now fully engaged. That virus doesn’t know what’s coming for it.” — Scott Adams

“… for young investors, this is perhaps a once in a lifetime gift, and they should do their best to open and make maximum contributions… — Jim O’Shaughnessy, A Generational Opportunity

We’re Clearly NOT In Kansas, Anymore … Toto

The 1996 movie, Twister, features Helen Hunt, Bill Paxton, Jami Gertz and Cary Elwes, and depicts a group of storm chasers researching tornadoes during a severe outbreak in Oklahoma.

There’s a scene in the movie where the chasers dine at Aunt Meg’s house in a sort of scrambled eggs and pancakes royal feast. (And beef, it’s Oklahoma, after all…) They return to Aunt Meg’s a few hours later to find the house leveled by a tornado. Aunt Meg and her dog are rescued from the debris and the balance of the movie revolves around seeking refuge, dodging flying cows … and the ultimate final scenes where Helen Hunt and Bill Paxton strap themselves to a pipe in a barn as the entire enclosure is removed from around them. And then it’s gone … the sun comes out and clear skies manifest.

“Things go wrong. You can’t explain them, you can’t predict them. … You gotta move on. Stop living in the past, and look what you got right in front of you.” — Bill Harding (Bill Paxton)

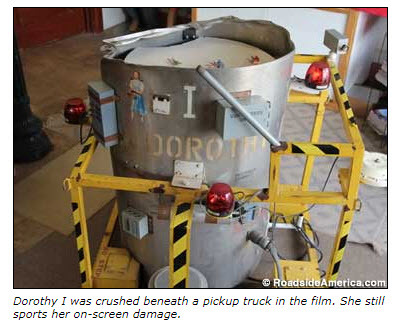
The central theme of the movie is to chase down and “inject” a tub of monitoring devices into the center of a tornado so that scientists could study anatomy, vectors, etc. and improve predictive capabilities for the benefit of many. One of these modules of sensors is shown in the accompanying figure and is named “Dorothy” in obvious tribute to those who’ve navigated over the rainbow.

But the real life, the device called “Dorothy” was actually named TOTO by the National Oceanic and Atmospheric Administration (NOAA). TOTO — which stands for “TOtable Tornado Observatory” — was a 55-gallon barrel outfitted to record storm data.

Enter our own “Dorothy” …

Whether we’re dealing with black swans, or a herd of buffalo simply trying to decide how to vector, or the wreckage from Aunt Meg’s house — clarity is a good thing. And although this won’t be perfect, at least we can come to terms with moderating forecasts as we attempt to understand how deep and how wide the current chasm challenge might be.

All 1400 companies that comprise the Value Industrials have current forecasts for 2020, 2021 and 2022 in our database. These are continuously updated (via YCharts) and will be shared frequently (at least weekly) going forward.

We’ve already seen that actual results for 2019 swooned while many people continued to marvel at “the best economy in the history of our country.” The rhinos on CNBC speak of unprecedented and undamaged “fundamentals.” They’re probably very, very wrong. My take is that it’s far from cataclysmic but not nearly as strong as many believe … and spew.

As recently as 3Q2019, expectations were for a median net margin of 8.5-9% for calendar 2019. As shown here, that didn’t happen. (Despite all of the fiscal stimulus and churning of stock buybacks, etc.) Expectations were for 9.0-9.5% in 2020. We’ll monitor very closely to see how much of a shortfall to expect, displaying it as soon as possible. But the 2020 year end median net margin went from 8.4% to 8.0% in just the last week.

[The main characters are in the shed hiding from an F5 tornado and Bill sees water pipes coming out of the floor.]

Bill: Here! These pipes go down at least thirty feet, if we anchor to them we might have a chance!
Jo: Have you lost your nerve?
Bill: Tighten your seatbelt.

Whether we’re talking about empty planes or empty restaurants… this too shall pass. We persisted through challenging times in November 2008 … backing up the truck and stepping on the gas in March 2009. We don’t have 30 feet of submerged pipe but we have nearly eight decades of wisdom and lessons deployed. We’ll chase the storm, dodge the flying cows … and attempt to navigate prudently this time, too.

MANIFEST 40 Updates

  • 1. Apple (AAPL)
  • 21. Skyworks Solutions (SWKS)
  • 25. Intel (INTC)

Round Table Stocks

  • Acuity Brands (AYI)
  • Apple (AAPL)
  • IPG Photonics (IPGP)
  • NVIDIA (NVDA)
  • Skyworks Solutions (SWKS)
  • Universal Display (OLED)

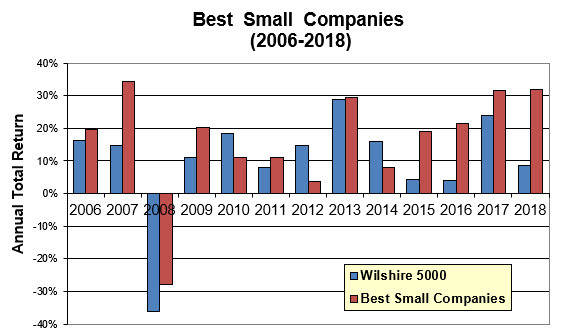
Best Small Companies (2020 Dashboard)

The status of the 2020 Best Small Companies can be tracked at: https://www.manifestinvesting.com/dashboards/public/best-small-companies-2020

Investing Round Table Sessions (Video Archives)

Investing Topics (Video Archives)

Results, Remarks & References

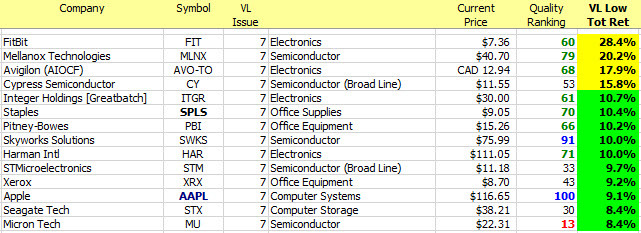
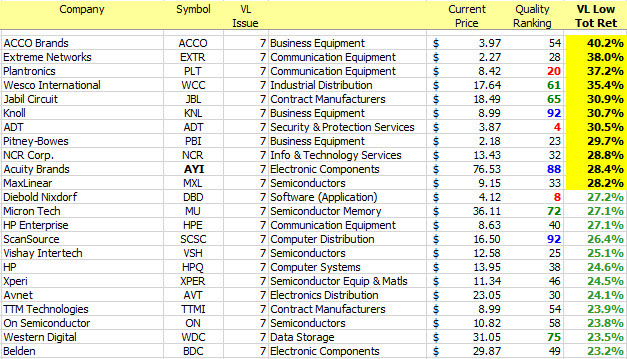
Companies of Interest: Value Line (3/27/2020)

The median Value Line low total return forecast for the companies in this week’s update batch is 14.7% vs. 18.1% for the Value Line 1700 ($VLE).

Materially Stronger: HP (HPQ), Skyworks Solutions (SWKS), Apple (AAPL)

Materially Weaker: Plantronics (PLT), Benchmark Electronics (BHE)

Discontinued: Pattern Energy (PEGI)

Market Barometers

“There’s a huge difference between an expectation and a forecast in investing. An expectation is an high-probability acknowledgment of how things might happen. A forecast is a specific prediction. In investing, forecasts are dangerous.” — Titan Research

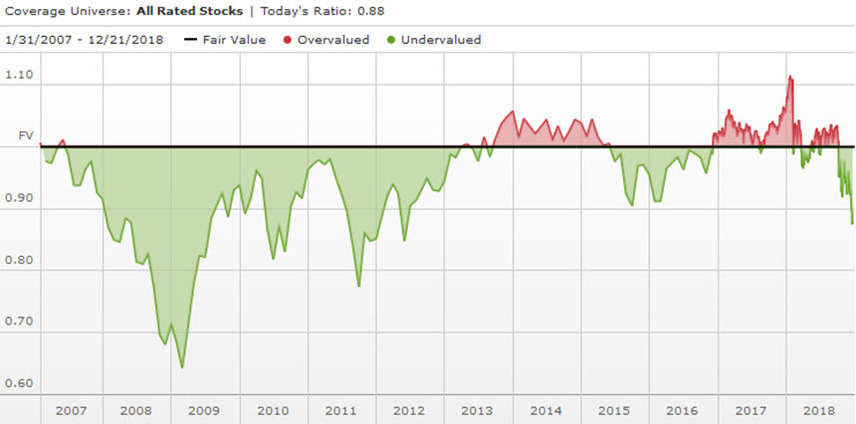
Value Line Median Appreciation Projection (VLMAP) Forecast. The long-term median appreciation projection for the 1700 companies featured in the Value Line Investment Survey is 21.8%, INCREASING from 15.8% last week. For context, this indicator has ranged from low single digits (when stocks are generally overvalued) to approximately 25% when stocks are in the teeth of bear markets like 2008-2009.

“It is my opinion that these future appreciation forecasts are going to be revised downward (and with larger downward revisions than currently expected/anticipated) faster than someone can yell, “Fire” in a crowded movie theatre.  In a word: It’s a Trap !!!” — Nick DiVirgilio

Nick is right.

Some of the geekier among us will recognize Admiral Ackbar from Star Wars:

The phrase stems from a memorable quote said by Admiral Ackbar (voiced by Erik Bauersfeld), the leader of Mon Calamari rebels, during the Battle of Endor in the 1983 Star Wars film Episode VI: Return of the Jedi. In the movie, as the Alliance mobilize its forces in a concerted effort to destroy the Death Star, Admiral Ackbar encounters an unexpected ambush, which leads him to exclaim, “It’s a trap!”

And we’re getting perhaps a little geeky, but here’s a snippet of how we’re approaching this … and why I’m optimistic that we’re barking at the right tree.

  • After the stock market closed on Friday and locked in prices for the weekend, the median projected return (MIPAR) was 18.1%.
  • A current data refresh of our database now displays a MIPAR of 17.4%.
  • The prices didn’t change. But YCharts has been busily and dutifully updating analyst forecasts (most likely from work-from-home environments) all weekend long and this bolsters my instincts on this.

There’s no way to know the duration and amplitude of this disruption — but at least we’re not flying blind with “static analyses” on the positions that we follow.

But … chances are … we’ll have a much better perspective on the CHASM than “average investors”.


Or, as Mr. Spock would say, “it’s only logical, Captain”.  — Ted Brooks


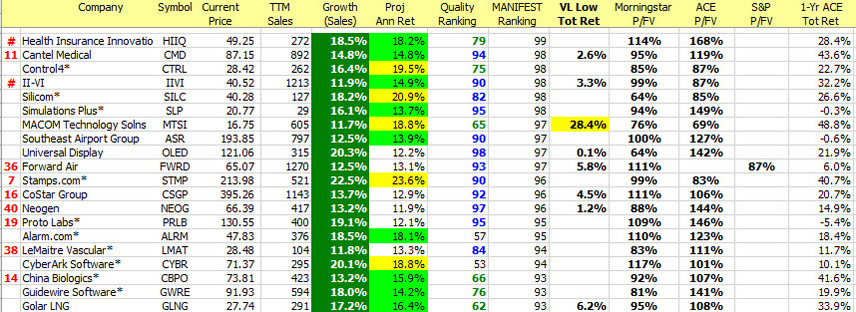
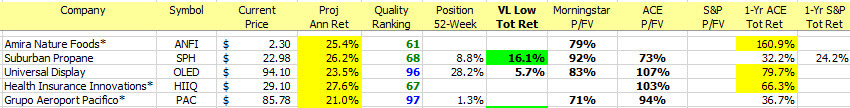
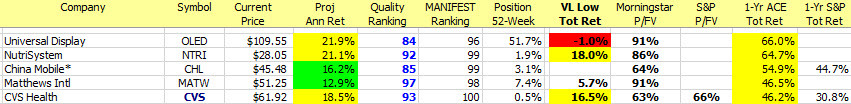
Update Batch: Stocks to Study (3/27/2020)

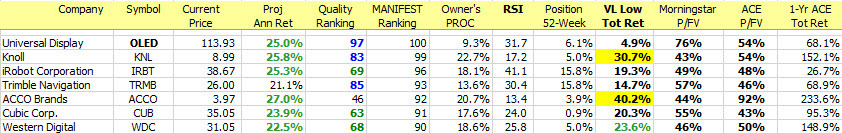
Long & Short Term Perspectives. (March 27, 2020) Proj Ann Return (PAR): Long term return forecast based on fundamental analysis and five year time horizon. Quality: Percentile ranking of composite that includes financial strength, earnings stability and relative growth & profitability. MANIFEST Ranking: Combination ranking that equally weights PAR and Quality. VL Low Tot Ret: Value Line forecast, expressed as low total return forecast. Owner’s PROC: Projected Return on Capital via 5-year EPS forecast versus current capital — equity and debt. Morningstar and ACE and P/FV: Price-to-Fair Value estimates from the (2) sources. 1-Yr ACE Tot Return: One year total return estimates via ACE.

Market Benchmarks (Continued)

Value Line Arithmetic Average. We’ve reached relative strength levels that suggest potentially oversold. But a reminder nudges away in that the bouncing ball bounced at a “bottom” for several months from November 2008-March 2009, a period that seemed like a very, very, long time.

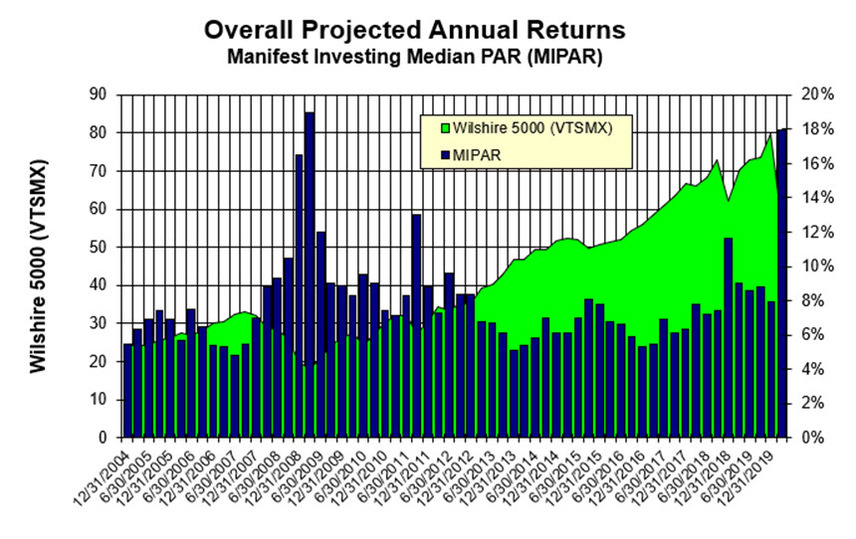
Manifest Investing Median Return Forecast (MIPAR). Reaching those levels seen in 2008-2009.

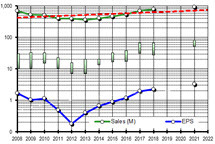
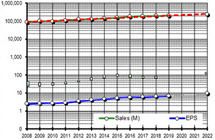
Value Line Industrials. Net Margin Not much change as the last few “precincts” for 2019 report in with their actual 4Q and 2019 year-end actuals. But we dropped from 8.4% to 8.0% on the 2020 estimates with a little erosion on the 2021-2024 expectations.

This one’s for Ted Brooks. Because he’s right about the algos and the Rise of the Machines.

You can’t look at this without noticing the daily transaction volume in the last 30 minutes or so (actually 15 … or 5) minutes of trading every day.

 spx last 30 20200320

Surrender, Dorothy?

Whoa.

We didn’t expect our version of “Dorothy” (or TOTO) to capture the changing landscape quite this quickly.

Sure. Our beloved Wall Street rhinos are back at their desks — many of them probably working from home — and they’re clearly not in a good mood. A quick comparison of this weekend’s chart shows no improvement in 2019 … with continued declines in 2020E and 2021E … and the slope of the long term trend has already deflected enough that we can “feel” it in our return forecasts.


There’s no place like home.  There’s no place like home.  There’s no place like home.

Get Me Through December … & Beyond

This Week at MANIFEST (12/28/2018)

“Patience is genius in disguise.” — Various, including Hugh McManus

“A 10% decline in the market is fairly common—it happens about once a year. Investors who realize this are less likely to sell in a panic, and more likely to remain invested, benefiting from the wealth building power of stocks.” — Christopher Davis

“You make most of your money in a bear market, you just don’t realize it at the time.” — Shelby Cullom Davis

“A market downturn doesn’t bother us. It is an opportunity to increase our ownership of great companies with great management at good prices.” — Warren Buffett

““Is value investing dead? I don’t know. I don’t care. I don’t know when we will know. What I do know is that Warren Buffett says that growth investing and value investing are actually joined at the hip. (Tom O’Hara said this, too.) Valuation Investing is the blend of growth and value investing.” — Joel Greenblatt

Get Me Through December?

Eddy Elfenbein shared the unpleasantness update in this week’s Market Review at crossingwallstreet.com:

The numbers are remarkable. On Thursday, the S&P 500 closed at its lowest level in 15 months. In the last 12 trading sessions, the S&P 500 has lost 11.6%. The details are even uglier. Within the index, 423 stocks are now trading below their 200-day moving average. On Thursday, new lows beat new highs 175-0.

20 Years With The Value Line Arithmetic Average ($VLE). Some context. We’ve seen similar moments like this before. But there’s no denying that the December “candlestick” is in a league of its own … rare company. We’re approaching long-term “Oversold” conditions as suggested by the relative strength index (RSI) nearing 30 and relative long-term lows. We’re reminded that the trailing 52-week returns have dipped sub-zero a few times in the last few years — so this should not be regarded as something new or unusual.

Manifest Investing Median Return Forecast (MIPAR). It’s clear that the median (basically average) return forecast for the 2300-2400 companies in our coverage universe have SUDDENLY shifted to new levels due to the price drop. This could also happen from a breach of fundamentals — but that is NOT the case, here … at least not yet. Return forecasts are now at levels we haven’t seen since 2008-2009.

Source: https://www.morningstar.com/tools/market-fair-value-graph.html

Beyond December — A Hope For Fewer Potholes …

My take on all of this carnage? It’s different this time.

Yes, I said the words.

Bear markets and corrections are pretty unique despite all of our attempts to slap historical price chart overlays and compare factors, etc. The simple truth is that (1) the sample size will never be statistically sufficient for any material conclusions to be reached. [Yet the Rhinos will continue to try. Smile and nod at them.] (2) Markets are not rational.

Current conditions definitely qualify for a sedative or something stronger.

Look no further than the accompanying weekly chart of the Value Line Low Total Return Forecast to see how sudden the current price correction has been. We’ve not seen a change with this velocity or ferocity since 2008. You remember, right? With Christmas carols humming in the background, recall the names Bear Stearns, Lehman, Merrill Lynch and things like credit default swaps and neighbor’s houses in foreclosure.

Yes, there’s a mountain of uncertainty and an abyss of incivility inside the Beltway and a President who’s certainly disruptive. But the core problem with the status is virtually unchanged — ALL of the political posers persist in patching or ignoring potholes (healthcare, immigration, infrastructure, federal capital structure, failed nation building, sloped international trade playing fields, the ostriches and lobbyists related to real capital markets reform, etc.). The hypocrisy is gut wrenchingly prevalent.

I think the stock market is legitimately tired of the perpetual motion of Congressional Kick The Can Down The Road — and corporations are suddenly much more guarded about faith in consistency and less optimistic that the moving targets have abated. As the foot comes off the accelerator and taps the brakes (again) we might return to the recessionary conditions of 2015-2016. Much of the globe is already headed there.

Unattended potholes become sinkholes.

Like snowflakes, it’s different this time. It’s always different. Trying to allocate assets or imagine outcomes based on historical models (even when powered by artificial intelligence) is a neural niblick.

So we turn to a constant. A constant that survived and thrived through the 1970s, 1987, 1994, Y2K and the gasping throes of 2008-2009. That constant is to eschew the chaos. Focus on what matters. Simply put, INVEST BETTER.

We accept that markets are not rational. We refuse to be surprised when they convulse.

We take the words of Warren Buffett quite seriously when he longs for corrective opportunities “a few more times during his investing lifetime” and speaks unflinchingly of tracking excellent companies and waiting for them to be available at attractive prices.

I believe one of those moments may have arrived. We don’t often make “market calls” but we did write about back-up-the-truck moments back in November 2008 (a wee bit early) and March 2009 (squarely in the bullseye). This could be another Buffett Bonanza.

So … we think it’s prudent to do what we’ve done for DECADES. Discover excellent companies, BETTER COMPANIES. Buy those that are priced well. BETTER PRICES FOR BETTER RETURNS.

Hugh McManus likes patience and its genius-making potential. He also likes excellent companies trading near their 52-week or multi-year lows. We’re thinking Hugh must be beside his Irish self these days and hope to hear from him during next weekend’s Round Table. Ken Kavula is sure to be swimming in the pool of sudden small company opportunity. Cy Lynch is likely to admire the latest bear market which will become a future blip. Rest assured that we’ll be more focused on the long term perspective than any pusillanimous politicians and their potholes, meandering Rhinos or any of those annoying talking heads who focus on “how much your 401(k) LOST since breakfast today.”

We promise to remain focused on the discovery and sharing of the best ideas — the opportunities we’ve known for decades as BETTER COMPANIES at BETTER PRICES.

Merry Christmas to our favorite nation of focused and compassionate investors!

Best Small Companies (2019 Dashboard)

The status of the 2019 Best Small Companies can be tracked at: https://www.manifestinvesting.com/dashboards/public/best-small-2019

MANIFEST 40 Updates

  • 1. Apple (AAPL)
  • 23. Skyworks Solutions (SWKS)
  • 26. Intel (INTC)

Round Table Stocks

  • Apple (AAPL)
  • IPG Photonics (IPGP)
  • MKS Instruments (MKSI)
  • Skyworks Solutions (SWKS)
  • Universal Display (OLED)

Round Table Sessions (Video Archives)

Turnout Tuesday Educational Sessions

Results, Remarks & References

Companies of Interest: Value Line (12/28/2018)

The median Value Line low total return forecast for the companies in this week’s update batch is 12.3% vs. 10.8% for the Value Line 1700 ($VLE).

Materially Stronger: Vishay Intertechnology (VSH), Office Depot (ODP), Kemet (KEM)

Materially Weaker: TTM Technologies (TTMI), Diebold Nixdorf (DBD), Western Digital (WDC), Plantronics (PLT), STMicroelectronics (STM), Micron Technology (MU), Cirrus Logic (CRUS), Lattice Semiconductor (LSCC), Celestica (CLS), 3D Systems (DDD)

Discontinued: Spectra Energy Partners (SEP)

Market Barometers

The thing very few people tell you about “overvalued” markets is that, occasionally, the fundamentals arrive to justify them. — Joshua Brown

Value Line Low Total Return (VLLTR) Forecast. The long-term low total return forecast for the 1700 companies featured in the Value Line Investment Survey is 10.8%, increasing from 8.5% last week. For context, this indicator has ranged from low single digits (when stocks are generally overvalued) to approximately 20% when stocks are in the teeth of bear markets like 2008-2009.

Of Tortoises & Rabbits

Four years ago, we lamented the decision by Forbes to discontinue their annual Best Small Companies list. 36 years in the running, the list provided a number of actionable opportunities over the last couple of decades for many of us. That said, while sticking to their core criteria, we may have actually improved the discovery and screening process.

The Best Small Company tracking portfolio has now beaten the Wilshire 5000 in 10-of-13 years. The last four years have delivered 19.0%, 21.6%, 31.7 and 32.0% respectively. The 32.0% was achieved versus a Wilshire 5000 at 8.6% for 10/31/2017-10/15/2018. For 2006-2018, the average annualized return is 16.5% versus 10.2% for the total stock market.

Note: The year-over-year results increased to 36% with the surge in the stock market on Tuesday.

When thinking about our experience over the last four years since adopting the orphaned Forbes mission — essentially seeking excellent faster-growing companies through the eyes of George Nicholson — we might want to switch the name of this campaign to Better Small Companies going forward.

As of 10/15/2018, the following (20) companies are on the “leader board” for the 2019 roster of Better Small Companies. Keep in mind that some of the fundamentals will be updated and price changes will cause some “drift”. We expect that 5-6 of these companies will be dislodged from the list as we complete the search for actionable ideas among the best-performing small company funds, Red Chip Review and American Association of Investors Shadow Stocks.

Bsc short list 20181016

The session recording is available here: https://www.youtube.com/watch?v=S_QZ97qlPPk
Go ahead.  Hug some red rabbits!


Fave Five (5/25/2018): Bottom Fishing

Fave Five (5/18/2018)

Our Fave Five essentially represents a listing of stocks with favorable short term total return forecasts (1 year, according to Analyst Consensus Estimates, or ACE) combined with strong long-term return forecasts and good/excellent quality rankings. The median 1-year ACE total return forecast is 12.6%.

This week we swing for the fences. The only restriction we placed on the long term perspective was to require that the stock be in the sweet spot (or above) with a minimum quality ranking of 60. So we’re looking at good or excellent companies with — in some cases — exorbitant long term forecast that also have out-sized total return forecasts for the next year or so.

Amira Nature Foods (ANFI) is a repeat participant. ANFI was added to the tracking portfolio back in June 2017 and was “expelled” for dropping more than 20% versus the market in fairly short order. The price at the time was $4.21, so today’s current price of $2.30 is 45% lower than that exit point. This is a potential example of the Rule-of-5 sell discipline that Ken Kavula and Mark Robertson discussed and presented at the NAIC national convention.

Universal Display (OLED) is an active holding in the tracking portfolio and increasingly, a community favorite. Added back in October 2016 at $49.69, the price reached $209 before retracing back to $99.28. (We did think about selling near that $209 peak based on projected return > median market forecast in the Round Table also, but we blinked.) At the current price, this holding has still outpaced the Wilshire 5000 by 40.1% (annualized.) We’ve heard unsubstantiated reports of newborn children and grandchildren being named “Universal Display.”

Suburban Propane (SPH), Health Insurance Innovations (HIIQ) and Grupo Aeroport Pacifico (PAC) are new additions.

Suburban Propane is a Master Limited Partnership and should be viewed as a more suitable individual portfolio component. See: Investing in MLPs (Source: bivio.com, Laurie Frederiksen) MLPs are generally challenging for club/partnership portfolios.

Health insurance is a mess. Perhaps it’s a field of opportunity. HIIQ could be worth a study to see if they’re making gains and solving the Rubik’s cube.

PAC is a Motley Fool favorite and was recommended in the October 2016 issue by David Gardner in their Stock Advisor newsletter. “Grupo Aeroportuario del Pacifico operates 12 airports in Mexico’s Pacific region, including popular destinations such as Guadalajara, Tijuana, and Puerto Vallarta. This is a great collection of assets just south of our border. Because airport facilities don’t change much from year to year, many costs are fixed. Its revenues, however, are expanding thanks to rising passenger volumes and more revenues from passenger services such as restaurants and car rental. And since each incremental traveler is mostly profit, profits have accelerated and has rewarded shareholders with an ever-growing dividend. Although friction in the relationship between the U.S. and Mexico is a risk factor here, we expect long-term travel and trade trends to ultimately carry the day. As a result, near-term stock price volatility is giving opportunistic long-term investors a real buying opportunity.” — (Excerpt from a Stock Advisor Update, 2/9/2017)

The Long and Short of This Week’s Fave Five

Long & Short Term Perspectives. (May 18, 2018) Projected Annual Return (PAR): Long term return forecast based on fundamental analysis and five year time horizon. Quality Ranking: Percentile ranking of composite that includes financial strength, earnings stability and relative growth & profitability. 52-Week Position: Position on scale between 52-week low price and 52-week target price. VL Low Total Return (VLLTR): Low total return forecast based on 3-5 year price targets via Value Line Investment Survey. Morningstar P/FV: Ratio of current price to fundamentally-based fair value via www.morningstar.com S&P P/FV: Current price-to-fair value ratio via Standard & Poor’s. 1-Year ACE Outlook: Total return forecast based on analyst consensus estimates for 1-year target price combined with current yield. The data is ranked (descending order) based on this criterion. 1-Year S&P Outlook: 1-year total return forecast based on S&P 1-year price target.

Fave Five Legacy (Tracking Portfolio)

The relative/excess return for the Fave Five tracking portfolio is +2.6% since inception.

The absolute annualized rate of return is 16.6%.

Tracking Dashboard: https://www.manifestinvesting.com/dashboards/public/fave-five

Fave Five (3/23/2018)

Fave Five (3/23/2018)

Our Fave Five essentially represents a listing of stocks with favorable short term total return forecasts (1 year, according to Analyst Consensus Estimates, or ACE) combined with strong long-term return forecasts and good/excellent quality rankings. The median 1-year ACE total return forecast is 16.2%.

Our five stocks this week hail from the top quintile (top 20%) of all stocks ranked by quality. We then sought the five highest 52-week total return forecasts according to analyst consensus.

NutriSystem (NTRI) rejoins the Fave Five tracking portfolio after a brief hiatus. NTRI was selected back on 11/9/2017 and proceeded to recede more than 20% versus the general stock market, so it was jettisoned about a month ago. With the stock price dropping from $51 to $28, we’ll give it another go — but with a careful watch on the quality rating. Slowing of sales growth with 2017 year-end resembling 2016 is causing some consternation and we’ll keep the company under the microscope with the 4/19/2018 update.

CVS Health (CVS) has appeared frequently in Fave Five results and is featured in a number of portfolios, including its #12 ranking in the MANIFEST 40 most widely-followed companies. CVS was first added to the Fave Five tracking portfolio back in December 2015 … and has been fairly disappointing with a return of (-10.1% annualized) since selection. We also note that CVS Health has been showing up on a number of Triple Play screening results, so we’ll continue to hope that earnings will advance … and that stock price will follow EPS.

The Long and Short of This Week’s Fave Five

Long & Short Term Perspectives. (March 23, 2018) Projected Annual Return (PAR): Long term return forecast based on fundamental analysis and five year time horizon. Quality Ranking: Percentile ranking of composite that includes financial strength, earnings stability and relative growth & profitability. 52-Week Position: Position on scale between 52-week low price and 52-week target price. VL Low Total Return (VLLTR): Low total return forecast based on 3-5 year price targets via Value Line Investment Survey. Morningstar P/FV: Ratio of current price to fundamentally-based fair value via www.morningstar.com S&P P/FV: Current price-to-fair value ratio via Standard & Poor’s. 1-Year ACE Outlook: Total return forecast based on analyst consensus estimates for 1-year target price combined with current yield. The data is ranked (descending order) based on this criterion. 1-Year S&P Outlook: 1-year total return forecast based on S&P 1-year price target.

Fave Five Legacy (Tracking Portfolio)

The relative/excess return for the Fave Five tracking portfolio is +4.7% since inception.

The absolute annualized rate of return is 17.8%.

Tracking Dashboard: https://www.manifestinvesting.com/dashboards/public/fave-five

This Week at MANIFEST (12/30/2016)

This Week at MANIFEST (12/30/2016)

What I think a lot of great marathon runners do is envision crossing that finish line. Visualization is critical. But for me, I set a lot of little goals along the way to get my mind off that overwhelming goal of 26.2 miles. I know I’ve got to get to 5, and 12, and 16, and then I celebrate those little victories along the way.” — Bill Rancic

As most of you have guessed, our playful emphasis on Dow 20,000 is precisely that — playful.

We seem to pay way too much attention to essentially arbitrary piles of numbers and the rhinos life expectancy can be shortened by how they measure up quarter-to-quarter and year-to-year.

Brad Perry was right. A successful long-term investing experience is a marathon. And Bill Rancic is also correct, milestones matter. There’s plenty of noise, chaos and confusion that complicates life for average investors.

We’re thankful for a community of investors that is willing to focus on visions of the future and a willingness to imagine. We believe that our emphasis on return expectations and vigilance on fundamental threats and opportunity — is a path to better finish lines.

Value Line Arithmetic Average. Annual Returns. (1990-2016). The average annual total return for the equal-weight Value Line Arithmetic Average is 13.3% since 1990. The S&P 500 (VFINX) checks in at 9.3%. That Dow Jones Industrial Average that everyone is hyperventilating over has delivered 7.6% over the same time frame.

The November-December surge in the market pushed this year’s all-of-the-above index from 10-20% to 20-30%. This image will serve as the centerpiece for the January 2017 newsletter. Ask us again if we believe in a blend of small, medium and large companies as a crucial element of portfolio design and management.

MANIFEST 40 Updates

  • 1. Apple (AAPL)
  • 23. Intel (INTC)

Round Table Stocks

  • Apple (AAPL)
  • Intel (INTC)
  • IPG Photonics (IPGP)
  • Skyworks (SWKS)
  • Universal Display (OLED)

Best Small Companies

  • 6. Universal Display (OLED)
  • 18. Mellanox Technologies (MLNX)
  • 27. IPG Photonics (IPGP)

Results, Remarks & References

Companies of Interest: Value Line (12/30/2016)

The average Value Line low total return forecast for the companies in this week’s update batch is 2.1% vs. 3.4% for the Value Line 1700 ($VLE).

Materially Stronger: Logitech (LOGI), Seagate Tech (STX), Applied Materials (AMAT), Micron Technology (MU)

Materially Weaker: Fitbit (FIT), Cray (CRAY), Stratasys (SSYS), Nimble Storage (NMBL), 3D Systems (DDD), HP Enterprise (HPE)

Discontinued: Lexmark (LXK), Imgram Micro (IM), Skulcandy (SKUL), Fairchild Semiconductor (FCS)

Market Barometers

Value Line Low Total Return (VLLTR) Forecast. The long-term low total return forecast for the 1700 companies featured in the Value Line Investment Survey is 3.4%, up from 3.3% last week. For context, this indicator has ranged from low single digits (when stocks are generally overvalued) to approximately 20% when stocks are in the teeth of bear markets like 2008-2009.

Stocks to Study (12/30/2016)

There’s a wide variety of opinions in the manifest of stocks to study this weekend. But some community favorites, some widely-followed leaders and some of our recent Best Small Companies made the list.

The Long & Short. (December 30, 2016) Projected Annual Return (PAR): Long term return forecast based on fundamental analysis and five year time horizon. Quality Ranking: Percentile ranking of composite that includes financial strength, earnings stability and relative growth & profitability. VL Low Total Return (VLLTR): Low total return forecast based on 3-5 year price targets via Value Line Investment Survey. Morningstar P/FV: Ratio of current price to fundamentally-based fair value via www.morningstar.com S&P P/FV: Current price-to-fair value ratio via Standard & Poor’s. 1-Year ACE Outlook: Total return forecast based on analyst consensus estimates for 1-year target price combined with current yield. The data is ranked (descending order) based on this criterion. 1-Year S&P Outlook: 1-year total return forecast based on S&P 1-year price target. 1-Yr “GS” Outlook: 1-year total return forecast based on most recent price target issued by Goldman Sachs.

Fave Five: Escape Velocity

Fave Five (12/9/2016)

Our Fave Five essentially represents a listing of stocks with favorable short term total return forecasts (1 year, according to Analyst Consensus Estimates, or ACE) combined with strong long-term return forecasts and good/excellent quality rankings. The average 1-year ACE total return forecast is 8.1%.

Every year we run a stock selection challenge starting on Groundhog Day (February 2) and running for the next twelve months. Individual investors and groups like investment clubs are welcome to participate by choosing 5-20 stocks.

We’ve now got nine annual contests under our belt. We crown an individual and group champion every year.

Escape Velocity

In three of the last four years, the Broad Assets Investment Club of St. Louis has toppled dozens of competing groups — taking home multiple Groundhog stock selection championships.

I’ll let that sink in.

Three of the past four years. Their excess/relative return (annualized) since inception is +28.7%.

Let that sink in, too.

We want some of whatever they’re having. Seriously, we checked the water … asked what they had for breakfast, etc. in an effort to come to grips with the primary driver behind their stunning success and track record. We discovered one potential influence. It seems like Broad Assets latches on to companies that have huge incremental improvements in earnings forecasts for next year versus this year. We detailed our findings in our cover story, Victory By Escape Velocity?

This week’s Fave Five is based on companies with solid long-term outlooks that also have superior earnings forecasts for 2017 versus estimates for 2016. The bracketed column displays the top five year-over-year forecasts, according to analyst consensus estimates. [Source: ACE and finance.yahoo.com]

The median year-over-year (2017/2016) differential for the ~2400 companies we cover is currently 11.8%.

For more information on joining our 11th annual Groundhog Challenge, launching 2/2/2017, as either a group or an individual investor, drop a note to markr@manifestinvesting.com.

The Fave Five This Week

  • Allergan (AGN)
  • Baidu (BIDU)
  • Celgene (CELG)
  • Five Below (FIVE)
  • Universal Display (OLED)

The Long and Short of This Week’s Fave Five

The Long & Short. (December 9, 2016) Projected Annual Return (PAR): Long term return forecast based on fundamental analysis and five year time horizon. Quality Ranking: Percentile ranking of composite that includes financial strength, earnings stability and relative growth & profitability. VL Low Total Return (VLLTR): Low total return forecast based on 3-5 year price targets via Value Line Investment Survey. Morningstar P/FV: Ratio of current price to fundamentally-based fair value via www.morningstar.com S&P P/FV: Current price-to-fair value ratio via Standard & Poor’s. 1-Year ACE Outlook: Total return forecast based on analyst consensus estimates for 1-year target price combined with current yield. The data is ranked (descending order) based on this criterion. 1-Year S&P Outlook: 1-year total return forecast based on S&P 1-year price target. 1-Yr GS: 1-year total return forecast based on most recent price target issued by Goldman Sachs.

Weekend Warriors

The relative/excess return for the Weekend Warrior tracking portfolio is +5.8% since inception. 51.9% of selections have outperformed the Wilshire 5000 since original selection.

Tracking Dashboard: https://www.manifestinvesting.com/dashboards/public/weekend-warriors

Weekend Warrior Tracking Portfolio: Selling Discipline

There are two primary selling conditions for the Weekend Warrior tracking portfolio.

  • For the first year after selection, if the excess/relative return (vs. the Wilshire 5000) becomes less than -20%, the position is closed.
  • A position is also closed (usually with a victory lap) when the return forecast (PAR) is less than the median return forecast (MIPAR).

This week, Stifel Financial (SF) and Raymond James (RJF) have both been on a surge, gaining 65% since selection. With return forecasts of 2-4% when the median return forecast is now 5% — both positions were closed. [High Five]

Fave Five (10/21/2016)

Fave Five (10/21/2016)

Our Fave Five essentially represents a listing of stocks with favorable short term total return forecasts (1 year, according to Analyst Consensus Estimates, or ACE) combined with strong long-term return forecasts and good/excellent quality rankings.

So you’re looking at the stocks in the top 1% of all companies according to MANIFEST Rank (Return Forecast and Quality combination) that have the highest 1-year total return forecasts according to the analyst consensus estimates. (ACE)

The Fave Five This Week

  • Air Lease (AL)
  • Celgene (CELG)
  • Cognizant Technology (CTSH)
  • Novo Nordisk (NVO)
  • Universal Display (OLED)

Context: The median 1-year return forecast (ACE) is 10.6%.

The Long and Short of This Week’s Fave Five

The Long & Short. (October 21, 2016) Projected Annual Return (PAR): Long term return forecast based on fundamental analysis and five year time horizon. Quality Ranking: Percentile ranking of composite that includes financial strength, earnings stability and relative growth & profitability. VL Low Total Return (VLLTR): Low total return forecast based on 3-5 year price targets via Value Line Investment Survey. Morningstar P/FV: Ratio of current price to fundamentally-based fair value via www.morningstar.com S&P P/FV: Current price-to-fair value ratio via Standard & Poor’s. 1-Year ACE Outlook: Total return forecast based on analyst consensus estimates for 1-year target price combined with current yield. The data is ranked (descending order) based on this criterion. 1-Year S&P Outlook: 1-year total return forecast based on S&P 1-year price target. 1-Yr GS: 1-year total return forecast based on most recent price target issued by Goldman Sachs.

Weekend Warriors

The relative/excess return for the Weekend Warrior tracking portfolio is +12.9% since inception. 42.6% of selections have outperformed the Wilshire 5000 since original selection.

Tracking Dashboard: https://www.manifestinvesting.com/dashboards/public/weekend-warriors

Fave Five (10/14/2016)

Fave Five (10/14/2016)

Our Fave Five essentially represents a listing of stocks with favorable short term total return forecasts (1 year, according to Analyst Consensus Estimates, or ACE) combined with strong long-term return forecasts and good/excellent quality rankings.

So you’re looking at the stocks in the top 1% of all companies according to MANIFEST Rank (Return Forecast and Quality combination) that have the highest 1-year total return forecasts according to the analyst consensus estimates. (ACE)

The Fave Five This Week

  • Aaron’s Rents (AAN)
  • Celgene (CELG)
  • Cognizant Technology (CTSH)
  • Novo Nordisk (NVO)
  • Universal Display (OLED)

Context: The median 1-year return forecast (ACE) is 9.9%.

The Long and Short of This Week’s Fave Five

The Long & Short. (October 14, 2016) Projected Annual Return (PAR): Long term return forecast based on fundamental analysis and five year time horizon. Quality Ranking: Percentile ranking of composite that includes financial strength, earnings stability and relative growth & profitability. VL Low Total Return (VLLTR): Low total return forecast based on 3-5 year price targets via Value Line Investment Survey. Morningstar P/FV: Ratio of current price to fundamentally-based fair value via www.morningstar.com S&P P/FV: Current price-to-fair value ratio via Standard & Poor’s. 1-Year ACE Outlook: Total return forecast based on analyst consensus estimates for 1-year target price combined with current yield. The data is ranked (descending order) based on this criterion. 1-Year S&P Outlook: 1-year total return forecast based on S&P 1-year price target. 1-Yr GS: 1-year total return forecast based on most recent price target issued by Goldman Sachs.

Weekend Warriors

The relative/excess return for the Weekend Warrior tracking portfolio is +9.8% since inception. 44.3% of selections have outperformed the Wilshire 5000 since original selection.

Tracking Dashboard: https://www.manifestinvesting.com/dashboards/public/weekend-warriors