January Round Table
Our Round Table, a monthly session featuring our favorite stock ideas right now in true round table fashion will be held on Tuesday. January 31 at 8 PM ET.
Registration: https://www.manifestinvesting.com/events/207-round-table-january-2017
On the eve of Groundhog Day Eve, we’ll return to a tradition of visiting and reviewing a Few of Our Favorite Screens.
Stocks Likely To Be Discussed
- Dollar Tree Stores (DLTR)
- MEDNAX (MD)
- NIC (EGOV)
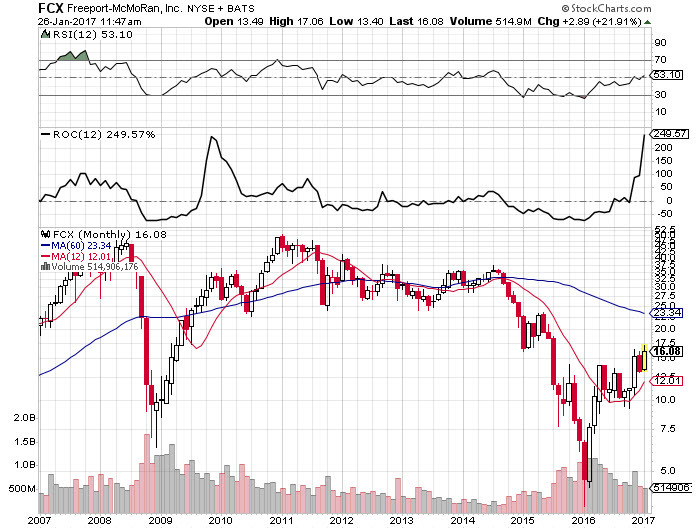
- Under Armour (UAA)
These Are A Few Of Our Favorite Screens
- Ivory Soap Screen
- Cy’s Strong Workhorse
- Kurt’s Sweet Spot Menu
- Broad Assets Launch Pad
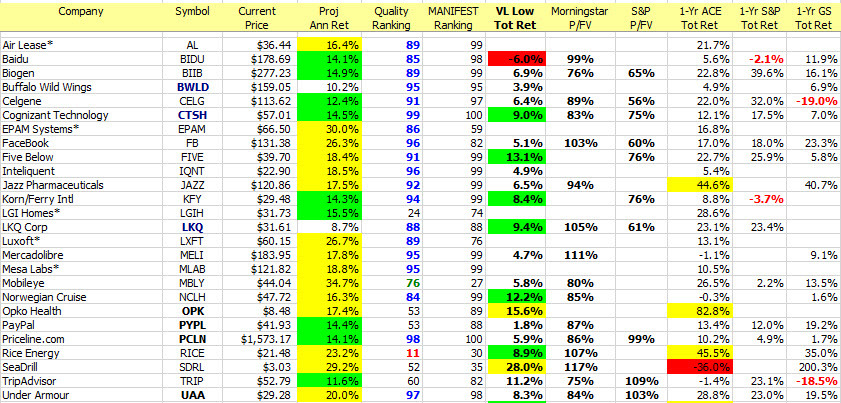
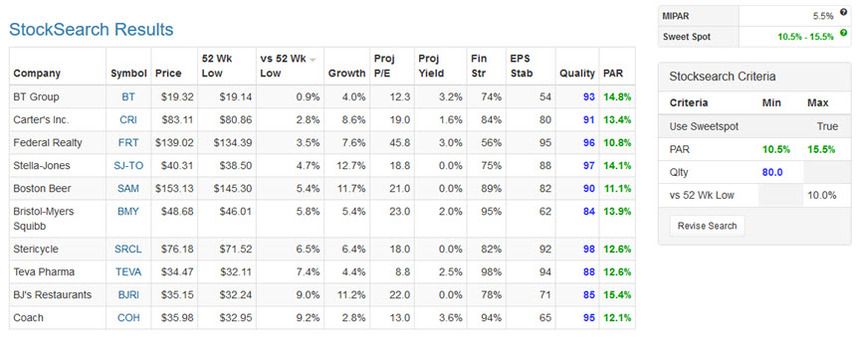
- Hugh’s 52-Week Low Proximity Screen
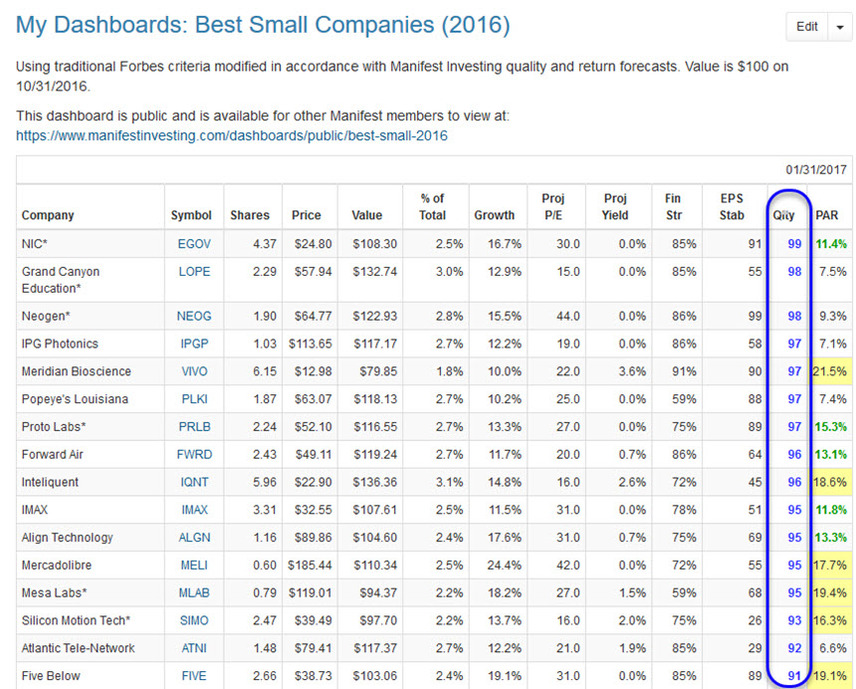
- Best Small Company Dashboard
- Global Treasures
- S&P Strong Buy — Long & Short
The stocks selected for this program over the last six years have collectively beaten the Wilshire 5000. We seek actionable opportunities to study and pursue.
The round table knights include small company champion and Mid-Michigan Director Ken Kavula; Cy (MythBuster) Lynch; pharmaceutical scientist Hugh McManus; and Manifest Investing’s Mark Robertson who will analyze their favorite stocks. Guest damsels have included Anne Manning, Susan Maciolek and Kim Butcher. Guest knights who have jousted include Nicholas Stratigos, Herb Lemcool and Matt Spielman
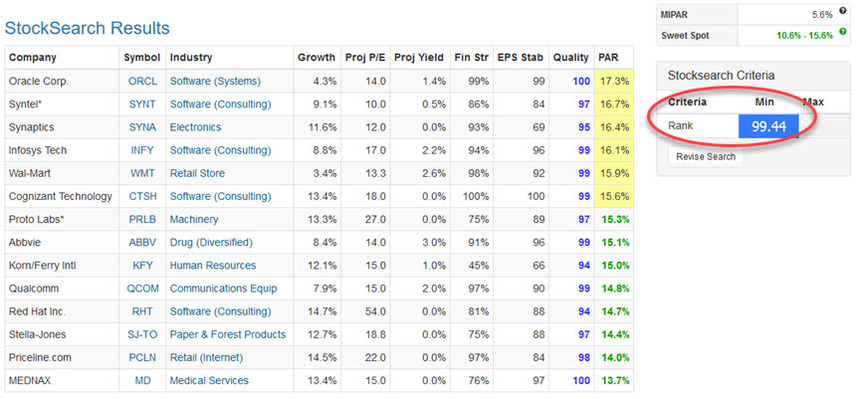
Ivory Soap Screen
We feature this one during most Round Tables. It’s still Mark’s favorite as it focuses screening targets on the most important characteristics — a combination of quality and return forecast — seeking the best companies at the best prices. As shown, enter 99.44 as the minimum Manifest Investing rank and we deliver a short list of high potential stock studies.
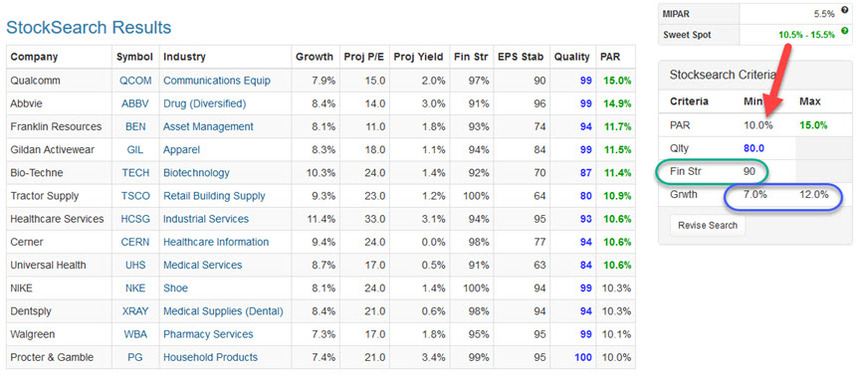
Cy’s Strong Workhorse Screen
This multi-purpose screen accomplishes several things, including an emphasis on that middle (medium-sized) company portion of your portfolios that supports size diversification. As he often reminds us, Cy prefers companies with high quality (excellent or greater than 80) AND high financial strength (A+ or greater than 80 or 90). In this case, he’s also moderated the return forecast target a bit (MIPAR +4.5%, as shown) in order to identify some solid returns from some companies in the steady growth segment (7-12% growth) that some of us might refer to as the “workhorse zone.”
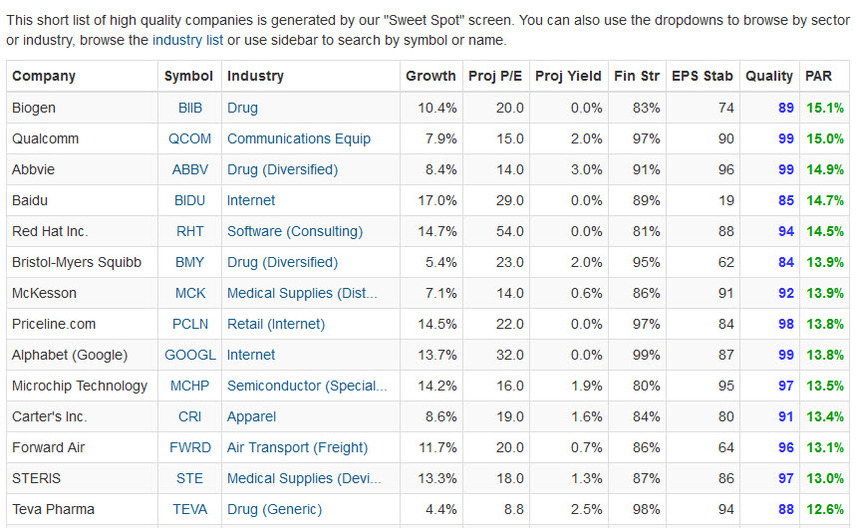
Kurt’s Sweet Spot & High Quality Screen
This one might be easiest — and among the more effective — of all. Kurt provides a continuously running screening result as one of our menu items. Click on Research > Companies and you get a current listing of potentially compelling studies.
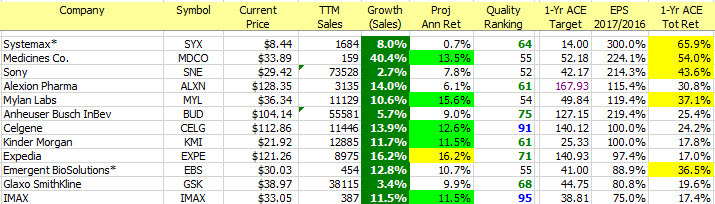
(Broad Assets) Launch Pad Concept Screen
This approach was explored in our Escape Velocity cover story (May 2014) where we attempted to explain some of the success of our 3-time group champions, Broad Assets of St. Louis. Part of the success was attributed to stocks like Lannett (LCI) which delivered massive returns, apparently operating near the point in a companies life cycle where EPS first break through into positive numbers and early stage growth can be powerful.
So three elements are probably important:
- Double digit growth — to isolate newer, promising companies with higher growth expectations.
- Exorbitant Slope on the EPS graphic. We screened for 2017 EPS vs. 2016 EPS here. The average is 11.4%. (FYI)
- Price Explosion Potential — The 1-year total return via ACE forecasts. The median forecast is 7.9%.
This could be a source of “different” ideas and would be considered part of a speculative component, by many.
Ken’s Quality Small Companies
Ken Kavula reminds us that we don’t have to compromise on quality when it comes to maintaining the small company component. This dashboard, inspired by the Forbes Best Small Companies, and published by Manifest Investing back around Halloween 2016 continues to flag opportunities. It has been sorted by Quality (Descending) and a number of sweet spot (and Speculative) opportunities are displayed.
Global Treasures
From January:
During his webcast on 1/10/2017, DoubleLine’s Jeff Gundlach suggested a search for equity opportunities in international baskets/markets and specifically called out India and Japan’s NIKKEI as potential targets.
We’ve been noticing a certain trend, alongside Mr. Gundlach, in recent weeks as the stocks featured in our Fave Five have been “dominated” by non-U.S. companies. Six of the last nine new editions to our Fave Five tracking portfolio (since 11/11/2016) have been ex-U.S. stocks.
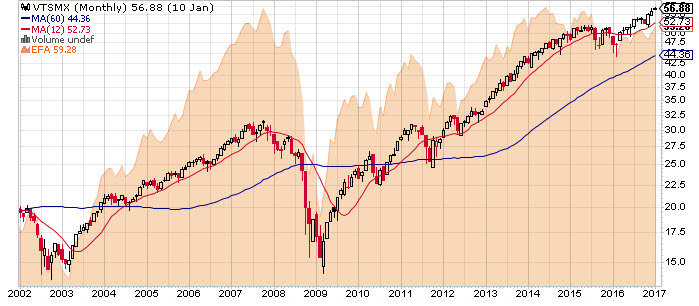
IShares MSCI EAFE ETF (EFA) offers broad, market-cap-weighted exposure to large- and mid-cap stocks across 21 developed markets outside the United States and Canada. Holdings include Nestle (NSRGY), Roche (RHHBY), Novartis (NVS), Toyota (TMC), Siemens (SIEGY), GlaxoSmithKline (GSK) and Bayer (BAYRY). As the accompanying chart shows, this index (orange area) peaked 10 years and has experienced its own lost decade since the Great Recession.
If you can discover one of these with strengthening fundamentals and you believe that the global recession will abate eventually, there could be considerable opportunity here.
S&P “Strong Buy” (5-Star) Long & Short
This screen is limited to S&P 5-Star qualifiers and is sorted by price-to-fair value (P/FV) ascending. The 1-year total return is included for a look at short term expectations.