Round Table (May 2017)

These excerpts are from our monthly webcast series (The Round Table) that usually airs on the last Tuesday at 8:30 PM ET.  The sessions are FREE and include the selection of 3-5 stocks to study with a demonstration of the analysis used to determine the quality and return forecast.  This demonstration has beaten the market over the last seven years, featuring a collective rate of return of 13.2%.  A tracking portfolio is maintained at:
If you would like to be added to the reminder list for future sessions, send a request to be added to the list maintained at nkavula1@comcast.net

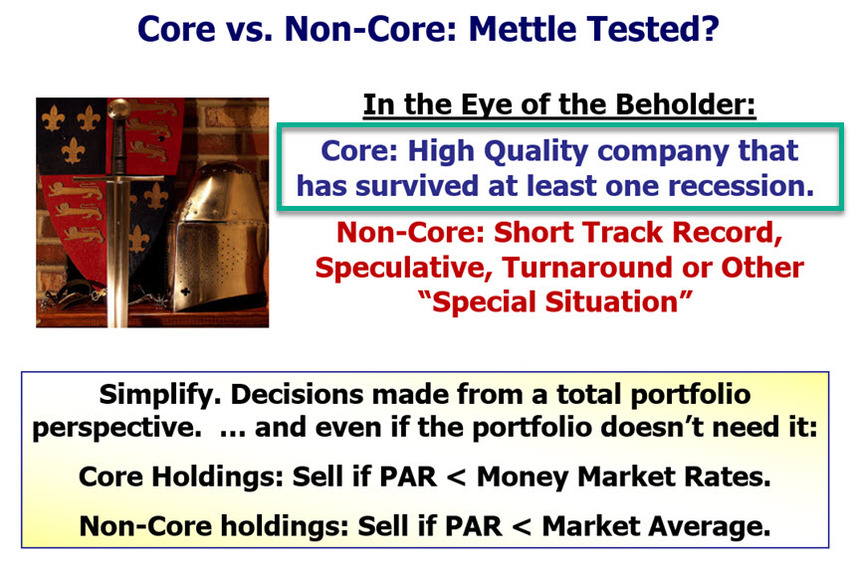
The Core/Non-Core discussion was a thought starter for sure. Clarifying my thought, adding ‘Successfully’ to ‘Survived At Least One Recession’ means to me that the company was ‘at least’ earnings profitable during a recession period. An example would be UTHR owned by the investment club I belong to. — Marty Eckerle, Cincinnati

[Here is one of the slides used in the discussion …]

Core mettle


Selling Decisions Based on Relative Return

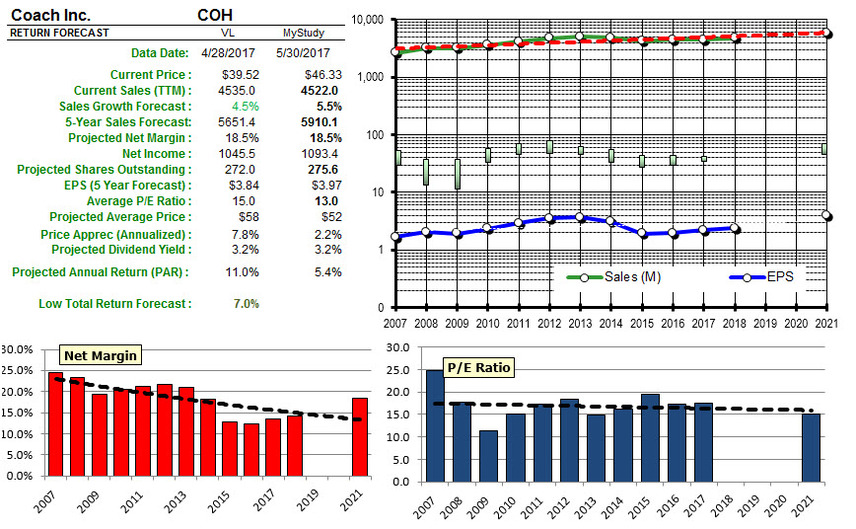
Nothing about the traditional selling decision, or Challenge, changes. We still sell with the overall portfolio characteristics in mind. It’s a standard procedure to challenge the holdings with the lowest return forecast. This was referred to by George Nicholson as “Rule One” for portfolio management. For this month’s meeting, Coach (COH) was challenged, updated, analyzed and sold to provide some boost to overall portfolio PAR.

Following that, any company selected within the trailing 12 months that lags (falls behind) the Wilshire 5000 and exhibits a relative return of -20% is subjected to some “head scratching.” The following flow/decision chart is an attempt to capture this process.

Rt flow chart 20170530

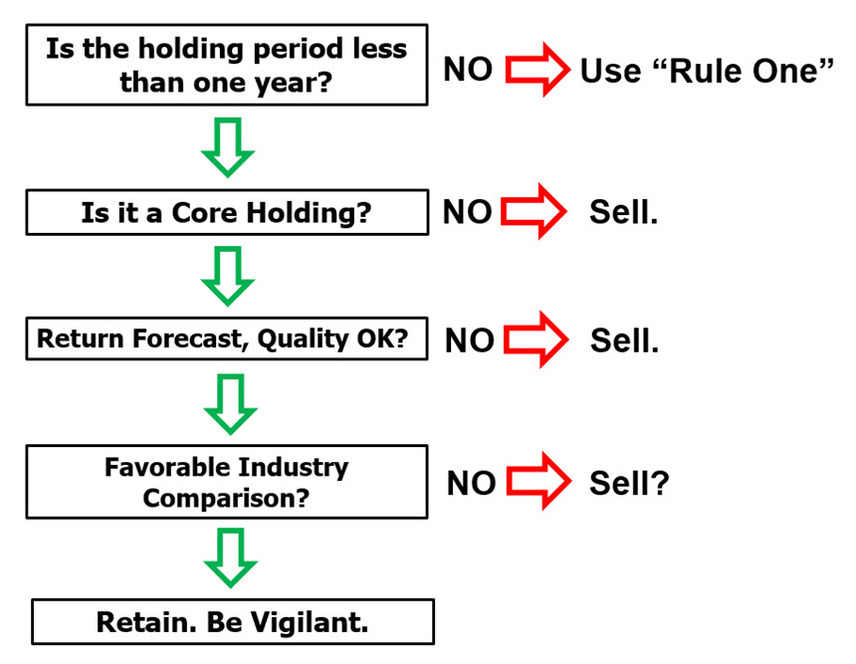
Selling Decisions (May 2017)

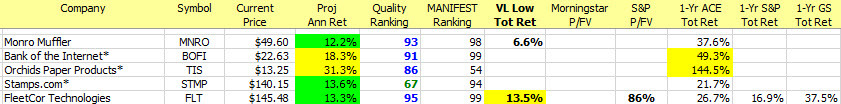
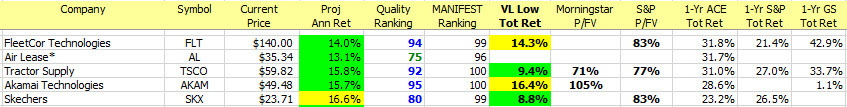
How To Use This Chart. This chart summarizes the decisions made by checking various attributes of stocks that have triggered the -20% relative return threshold over the last year.

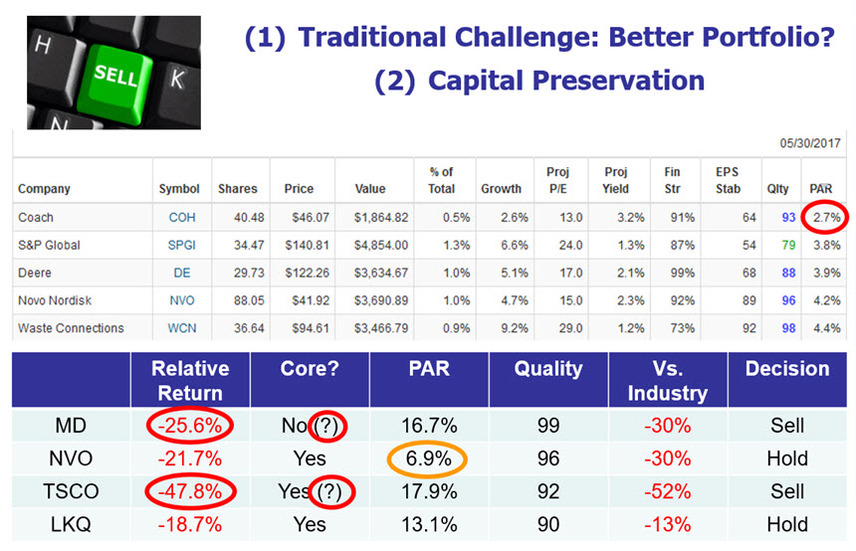
The first chart is a dashboard sorted by PAR (Ascending). The stock at the top of the sort, Coach (COH) is therefore — on the HOT SEAT. After further discussion and the update included in this thread (see below), Coach did not survive and was SOLD.

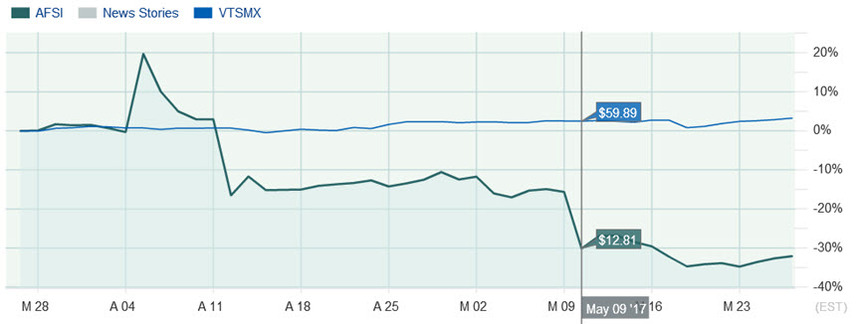
When a stock reaches a relative return of -20% (versus the Wilshire 5000, VTSMX) it qualifies for this raking over the coals. The relative performance is displayed in the Relative Return column. If LKQ (LKQ) can remain under -20%, it will be removed from this listing at future Round Tables.

Core? is a decision as to whether a stock should be subjected to tighter constraints or given “blue chip” treatment with a “longer leash.” Most participants tend to regard Retail/Apparel companies as Non-Core and we’ve found over the years that steady forecasts and steady results are generally the hallmark of companies that we consider to be core.

If a company is deemed to be core, a quick check of the return forecast (PAR) and Quality is in order to detect degradation or erosion of expectations. In this case NVO is definitely “on the fence” and we’re monitoring for signs of further weakness. It was noted that the stock price performance has been stronger over the last few weeks.

The last “life line” (vs. Industry) is a quick check to see if a company is actually faring relatively well versus its industry or peers while lagging the market. This essentially “saved” LKQ last month as we noted that the Auto & Commercial Vehicle Parts Index (BigCharts: WSJUSIXOTA) has lagged the overall stock market.

Coach (COH) was sold from the Round Table tracking portfolio on 5/30/2017.

Coh analysis 20170530

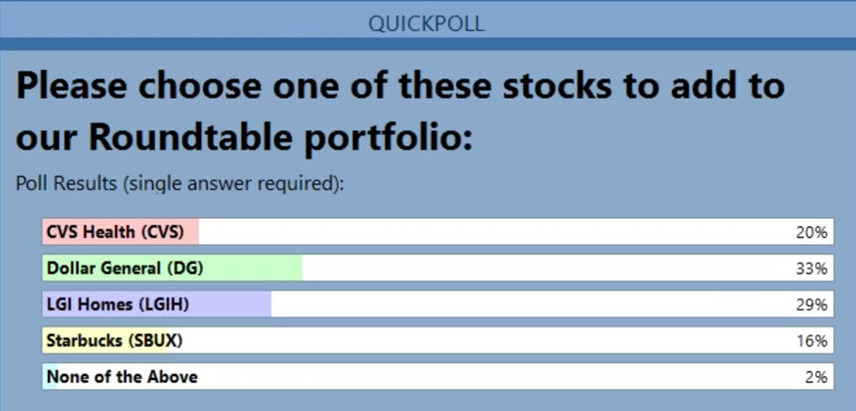
The Audience Poll was a bit of a photo finish for May 2017. We ruled that the audience selected both Dollar General (DG) and LGI Homes (LGIH) and will invest $1000 in each. The live audience in Cincinnati on 5/19/2017 selected CVS Health (CVS).

Rt poll 20170530

Fave Five (5/26/2017)

Perils of Bottom Fishing?

Fave Five (5/26/2017)

Our Fave Five essentially represents a listing of stocks with favorable short term total return forecasts (1 year, according to Analyst Consensus Estimates, or ACE) combined with strong long-term return forecasts and good/excellent quality rankings. The average 1-year ACE total return forecast is 9.6%.

The Fave Five This Week

  • Bank of the Internet (BOFI)
  • FleetCor Technologies (FLT)
  • Monro Muffler (MNRO)
  • Orchids Paper Products (TIS)
  • Stamps.com (STMP)

The Long and Short of This Week’s Fave Five

The Long & Short. (May 26, 2017) Projected Annual Return (PAR): Long term return forecast based on fundamental analysis and five year time horizon. Quality Ranking: Percentile ranking of composite that includes financial strength, earnings stability and relative growth & profitability. VL Low Total Return (VLLTR): Low total return forecast based on 3-5 year price targets via Value Line Investment Survey. Morningstar P/FV: Ratio of current price to fundamentally-based fair value via www.morningstar.com S&P P/FV: Current price-to-fair value ratio via Standard & Poor’s. 1-Year ACE Outlook: Total return forecast based on analyst consensus estimates for 1-year target price combined with current yield. The data is ranked (descending order) based on this criterion. 1-Year S&P Outlook: 1-year total return forecast based on S&P 1-year price target. 1-Yr GS: 1-year total return forecast based on most recent price target issued by Goldman Sachs.

Fave Five Legacy (Tracking Portfolio)

The relative/excess return for the Fave Five tracking portfolio is +1.8% since inception. 45.3% of selections have outperformed the Wilshire 5000 since original selection.

Tracking Dashboard: https://www.manifestinvesting.com/dashboards/public/fave-five

We had several stocks sold, stopping out on relative return less than -20% for non-core stocks in the tracking portfolio:

  • AmTrust Financial (AFSI)
  • Chicago Bridge & Iron (CBI)
  • Horizon Pharma (HZNP)
  • Opko Health (OPK)

Afsi relative 20170526

Profitability Forecasting

 We collectively owe all Value Line analysts an apology. We’ll use this household products leader — and walking, talking and breathing Up, Straight & Parallel business analysis — to take a closer look at profitability forecasting.

Church & Dwight (CHD)

Church & Dwight Co., Inc. engages in the development, manufacture, and market of household, personal care and specialty products. It sells consumer products under a variety of brands through a broad distribution platform that includes supermarkets, mass merchandisers, wholesale clubs, drugstores, convenience stores, dollar, pet and other specialty stores and websites all of which sell the products to consumers. The firm focuses its marketing efforts on its brands, which includes ARM & HAMMER, TROJAN Condoms, XTRA laundry detergent, OXICLEAN pre-wash laundry additive, NAIR depilatories, FIRST RESPONSE home pregnancy and ovulation test kits, ORAJEL oral analgesics and SPINBRUSH battery-operated toothbrushes. It operates through the following segments: Consumer Domestic, Consumer International and Specialty Products. The Consumer Domestic segment includes the eight power brands and other household and personal care products such as SCRUB FREE, KABOOM and ORANGE GLO cleaning products, ANSWER home pregnancy and ovulation test kits, ARRID antiperspirant, CLOSE-UP and AIM toothpastes. The Consumer International segment primarily sells a variety of personal care products, some of which use the same brands as its domestic product lines in international markets. The Specialty Products segment produces sodium bicarbonate, which it sells together with other specialty inorganic chemicals for a variety of industrial, institutional, medical and food applications in U.S. The company was founded by Dwight John and Austin Church in 1846 and is headquartered in Ewing, NJ. [Source: Wall Street Journal]


I think we might owe the Value Line analysts an apology.

This might be one of those moments when we realize that something we’ve believed, shared and taught just doesn’t work out the way we expected.

I hate when moments like these happen.

The culprit is usually a Value Line company report. You know the ones I’m talking about. The companies that have been running close to a 5.0% net margin for the last few years and the Value Line analyst has a 3-5 year forecast of 7.5% for the projected net margin. We snicker. Some of us guffaw. Almost all of us discount the forecast.

It’s probably time for a deep breath. A few more moments with curved shower rod curtains while we tack the ends of the ham and restore it to Grandma’s oven. (See Cutting Off The Ends for more on this subject)

The Management Report Card: Profitability

The second part of an SSG-based stock analysis includes a look at profitability trends.

Faced with slide rules and abacus beads, George Nicholson resorted to a moving average for “instant trend analysis.” It’s very straightforward. A comparison of current conditions (higher or lower) versus the trailing 5-year average tells us whether recent results are above (good) or below (bad?) the longer term trend. There is nothing wrong with this convention.

But we use the Preferred Procedure — a business model analysis — to build the long term return forecast for the companies we study and analyze. And we’ve generally used the trailing 5-year average net margin as the projected profitability.

(1) This will build in some conservatism, and (2) we lean on the “excuse” that we’re doing the analysis for each and every company the same — so it’s all “relative.” This too is a decent, but flawed, convention. Even if it’s WRONG.

The problem is that we’re striving for better absolute forecasts.

“The moving average forecast is based on the assumption of a constant model.” — University of Texas, Statistics


Does anything about that accompanying chart of long-term aggregate net margin (1940-Present) look CONSTANT???

Church & Dwight (CHD): Profitability Trends. The actual and forecast net margins for CHD are shown in the profitability graphic on the left. The graphic on the right supports a comparison of actuals (red bars, 2009-2016) versus the forecasts (purple bars) based on 5-year trailing averages back at the time the forecasts were formed.

The fact that we have embedded analyst estimates for profitability for this year, next year and 3-5 years out (when available) for our long-term forecasts means that we are less impacted by this condition than what is depicted on the right.

Bottom Line

I think it’s clear that we’d want a forecast for CHD that is essentially between the VL 3-5 year forecast and the exponential regression shown on the left image. It’s probably also clear that for a profitability profile like the one on the left, the trailing average forecast is going to consistently produce a lagging forecast.

Remember the example of margin expansion by Coca-Cola over the years cited by Steve Sanborn. It’s simply a reality that profitability characteristics shape and evolve over the life cycle of all companies.

The moving average forecast method really only works (accurately) for mature stocks with relatively constant profit margins.

The problem is that there aren’t very many companies that fit this description. Our database includes a forecast algorithm that essentially smoothes and weights the more recent years. When we use this method for Church & Dwight, our 5 year net margin forecast aligns very closely with Value Line’s 3-5 year construct. We checked about (50) more companies — and those forecasts that we snickered and guffawed about — all checked out very closely.

We may owe the Value Line analysts an apology.

We will begin infusing this method with updates going forward until the entire database (at Manifest Investing) is converted.

Fave Five (5/12/2017)

Fave Five (5/12/2017)

Our Fave Five essentially represents a listing of stocks with favorable short term total return forecasts (1 year, according to Analyst Consensus Estimates, or ACE) combined with strong long-term return forecasts and good/excellent quality rankings. The average 1-year ACE total return forecast is 9.1%.

This week we return to the triple play screening method for our five favorites. The triple play possibility occurs when you find a stock that is very depressed in price and also appears to be on the verge of substantially boosting its profit margins. The triple play effect is possible in that:

(1) The depressed price of the stock can return to normal levels;

(2) increased profit margins can produce increased EPS and a higher price;

(3) may also cause higher P/E ratios, or P/E expansion.

The Fave Five This Week

  • Air Lease (AL)
  • Akamai Technologies (AKAM)
  • FleetCor (FLT)
  • Skechers (SKX)
  • Tractor Supply (TSCO)

The Long and Short of This Week’s Fave Five

The Long & Short. (May 12, 2017) Projected Annual Return (PAR): Long term return forecast based on fundamental analysis and five year time horizon. Quality Ranking: Percentile ranking of composite that includes financial strength, earnings stability and relative growth & profitability. VL Low Total Return (VLLTR): Low total return forecast based on 3-5 year price targets via Value Line Investment Survey. Morningstar P/FV: Ratio of current price to fundamentally-based fair value via www.morningstar.com S&P P/FV: Current price-to-fair value ratio via Standard & Poor’s. 1-Year ACE Outlook: Total return forecast based on analyst consensus estimates for 1-year target price combined with current yield. The data is ranked (descending order) based on this criterion. 1-Year S&P Outlook: 1-year total return forecast based on S&P 1-year price target. 1-Yr GS: 1-year total return forecast based on most recent price target issued by Goldman Sachs.

Fave Five Legacy (Tracking Portfolio)

The relative/excess return for the Fave Five tracking portfolio is +2.0% since inception. 46.9% of selections have outperformed the Wilshire 5000 since original selection.

Tracking Dashboard: https://www.manifestinvesting.com/dashboards/public/fave-five