This Week’s Fave Five is brought to you by Pittsburgh’s own Pat Donnelly. Pat stopped me in the hall at the National Association of Investors annual conference and said, “You know what — among many things — I wonder about? Which Fave Five selection mode has delivered the best performance?” That’s a really, really good question. Pat is the chair of the NAIC volunteer advisory board.
Fave Five (5/24/2019)
We started the Fave Five as something of a whim. It was sort of the answer to the question, “Is it possible to highlight 3-5 companies a month, let alone a week?” After a few years, the results are becoming compelling and provocative. If you’ve been around here for more than a little while … you know that we treasure skepticism and critical thinking about the challenges and potential of investing.
It’s time to refine our characterization of the “Fave Five.”
Our Fave Five essentially represents a listing of stocks with favorable long term total return forecasts and good/excellent quality rankings. We basically screen on Manifest Ranking (equally-weighted PAR and Quality). This is the primary screening criteria every single week. The only variation is how “deep” we go into the percentile rankings. Sometimes we stop at 99.44% … other times sticking to the top 2% … or 5% … and when in a bottom fishing mode as low as top 50% or even “deeper.”
Selections
Keep in mind that a repeat appearance among the Fave Five for a given DOES NOT result in “accumulation.” Once a stock is “in”, it’s in until it’s “out.” So the accompanying image of results is measuring the performance of the tracking portfolio.
And speaking of “out”, we’ve been using this demonstration portfolio to deploy (1) Rule-of-5 “time outs” for companies that lag the market by more than 20 percentage points, (2) celebrate success as measured by a stock price soaring to the extent that the return forecast (PAR) approaches low single digits. These are fun. (3) We’ll be adding a quality degradation algorithm. Stay tuned.
Second Screens
So the real difference is the secondary screening criteria each week. The default setting is the highest 1-year total return forecast by analyst consensus. Hence the 112 selections. We’re elated to see a premise hold as the relative return for this most frequent criterion is beating the market.
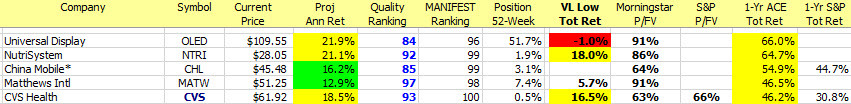
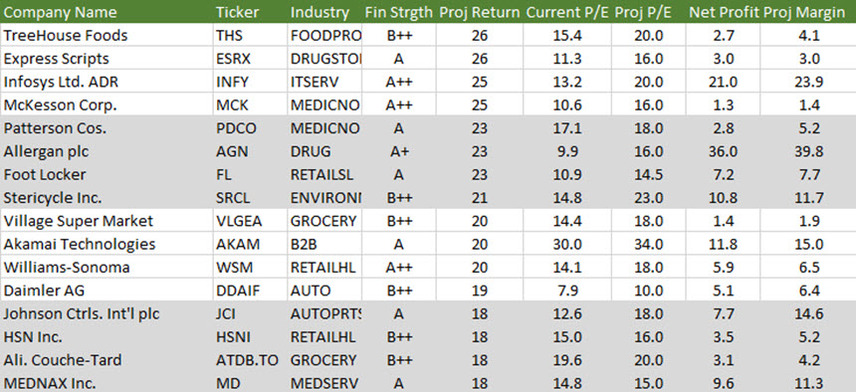
But the most compelling results come from three secondary screening criteria: (1) High Growth, (2) Irish Spring and (3) Triple Play. High Growth is just what you think it is. It’s compliant with our search for excellent smaller and faster-growing companies. The elevator speech is GREAT companies growing in double digits — with top line growth of 10% or 12% or more.
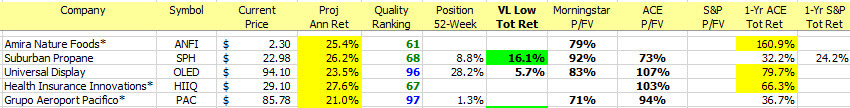
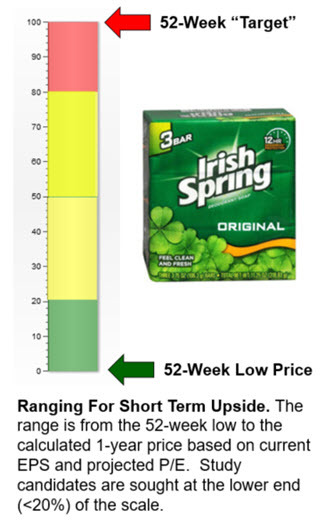
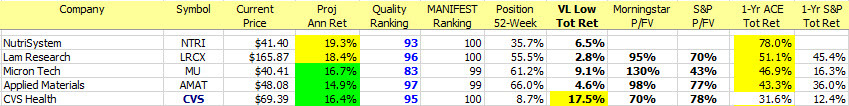
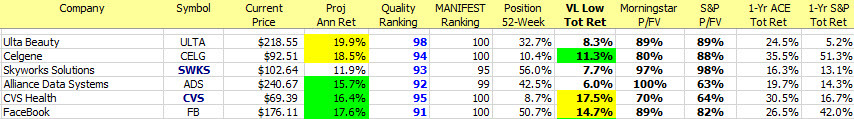
Irish Spring resonates with real “risk” reduction as our resident Irishman, Hugh McManus, has guided us to find GREAT companies available near their 52-week lows.
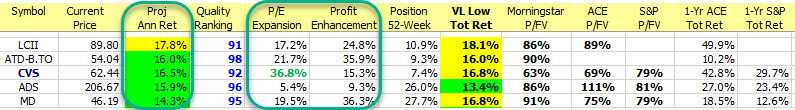
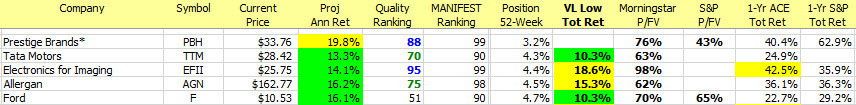
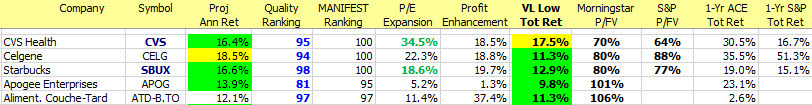
And Triple Play is a powerful nod to the legacy of the modern investment club movement and George Nicholson’s nudge to seek companies with (1) depressed stock prices, that (2) have the potential for margin enhancement and (3) P/E ratio expansion.
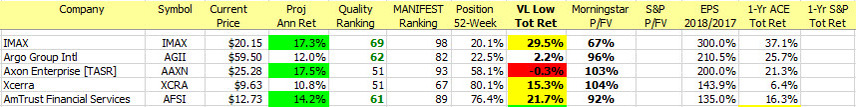
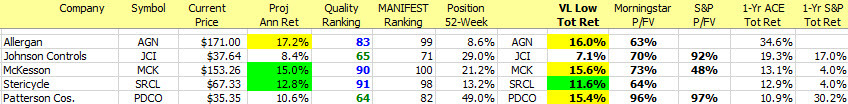
“Most Oversold” is simply the qualifiers with the lowest Relative Strength Index (RSI) courtesy of StockCharts.com. Yes, Virginia, it’s a technical indicator. But it could prove to be something that heeds Ralph Acampora’s advice in Chicago last weekend to “Go ahead and do all the wonderful things you do to study companies but before you press the BUY button, do Ralphie a favor and check the price trends. Is your discovery gaining or falling in stock price?” There’s only two selections in this category so far. That will change. Soon.
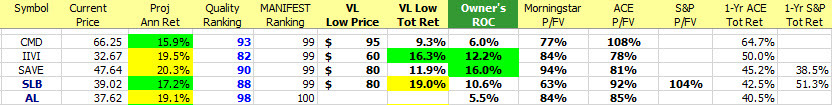
We’re also optimistic about Owner ROC. (More to follow on this) Anecdotally, we think it will remain faithful to virtually all of the foundational concepts while raising the awareness and emphasis on debt capital. Stay tuned here, too.
The Long and Short of This Week’s Fave Five
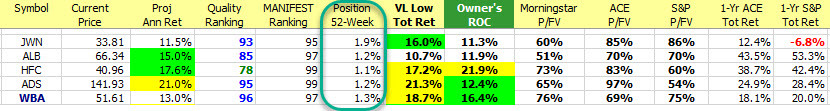
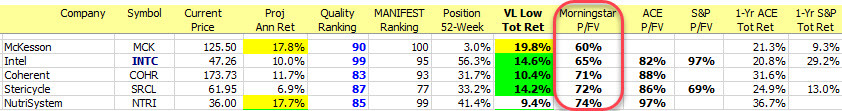
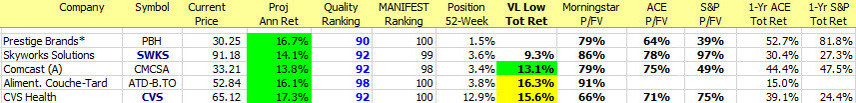
Long & Short Term Perspectives. (May 24, 2019) Projected Annual Return (PAR): Long term return forecast based on fundamental analysis and five year time horizon. Quality Ranking: Percentile ranking of composite that includes financial strength, earnings stability and relative growth & profitability. MANIFEST Ranking: Equally weighted ranking of Return Forecast (PAR) and Quality. 52-Week Position: Position on scale between 52-week low price and 52-week target price. VL Low Total Return (VLLTR): Low total return forecast based on 3-5 year price targets via Value Line Investment Survey. Morningstar P/FV: Ratio of current price to fundamentally-based fair value via www.morningstar.com ACE P/FV: based on analyst consensus for fair value. Owner’s Return On Capital: Return (Profitability, long term estimate) vs. Total Capital (equity + debt). S&P P/FV: Current price-to-fair value ratio via Standard & Poor’s. 1-Year ACE Outlook: Total return forecast based on analyst consensus estimates for 1-year target price combined with current yield. The data is ranked (descending order) based on this criterion. 1-Year S&P Outlook: 1-year total return forecast based on S&P 1-year price target.
Fave Five Legacy (Tracking Portfolio)
The relative/excess return for the Fave Five tracking portfolio is +2.4% since inception.
The absolute annualized rate of return is 11.8%.
Tracking Dashboard: https://www.manifestinvesting.com/dashboards/public/fave-five