Stericycle (SRCL)

Is Stericycle a Sell?

Stericycle (SRCL) was added to the Round Table tracking portfolio back in February 2014 at a stock price of $114.00. It has since lagged the market by some -21.5% (annualized) leaving some to wonder if it isn’t a sell candidate despite trading near 52-week lows.

Srcl analysis 20170920

The Value Line perspective — in a nutshell:

Our near-term investment outlook has grown more pessimistic over the past three months. Specifically, Stericycle is now ranked to under perform the broader market averages over the coming six to 12 months. The issue does hold wide recovery potential, assuming our long-term projections aren’t far off the mark. (Matthew E. Spencer, CFA August 25, 2017)

Perhaps, but trading near the 52-week low delivers a 1-year zoning position of 3.7% with a 1-year target price of $107. The “average stock” has a 1-year zoning position of approximately 80%.

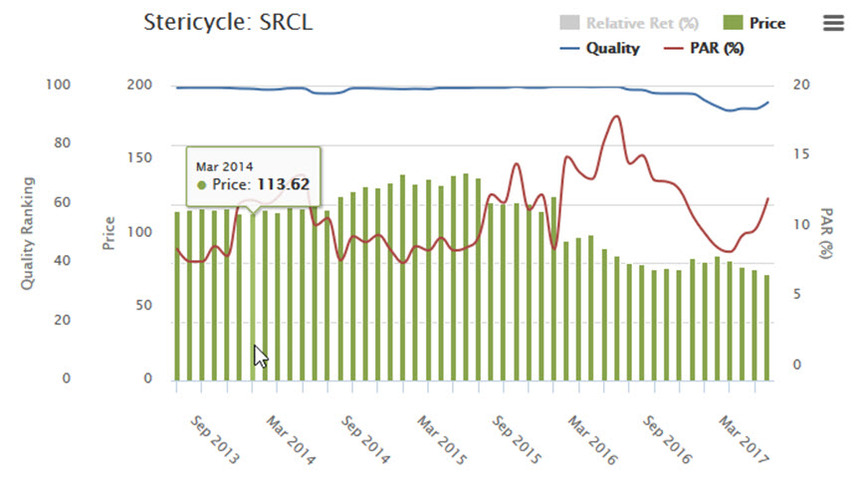
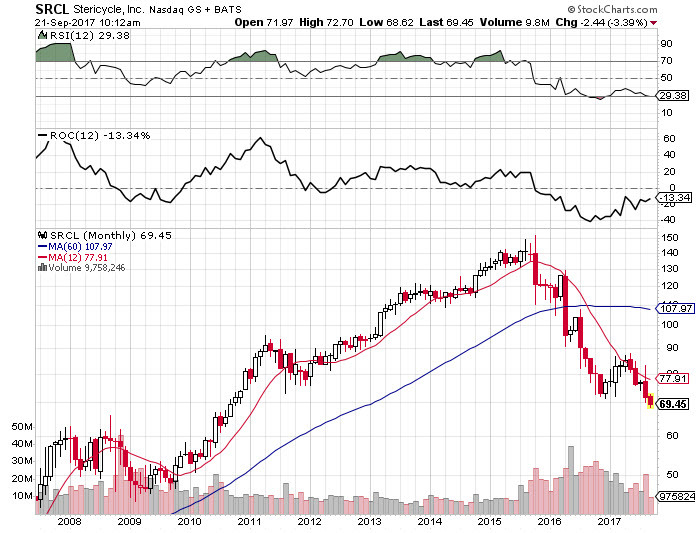
As shown in the accompanying chart, SRCL is now “oversold” (RSI<30).

Srcl chart 20170920

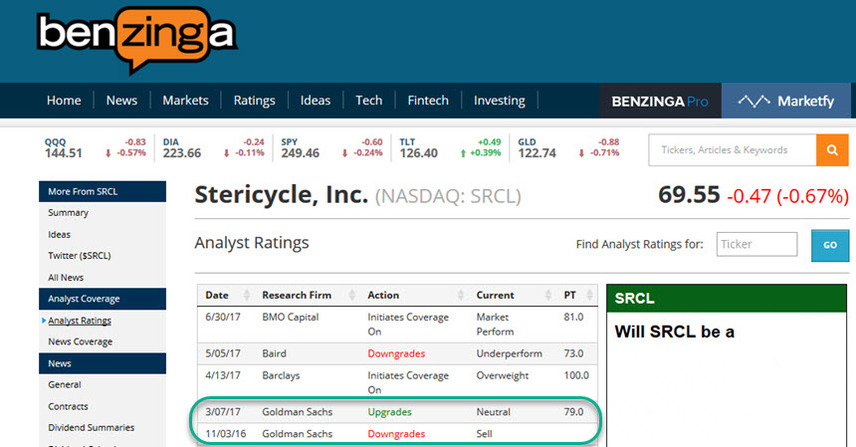
Goldman Sachs has not changed their outlook from March — at least not in a public release or not yet.

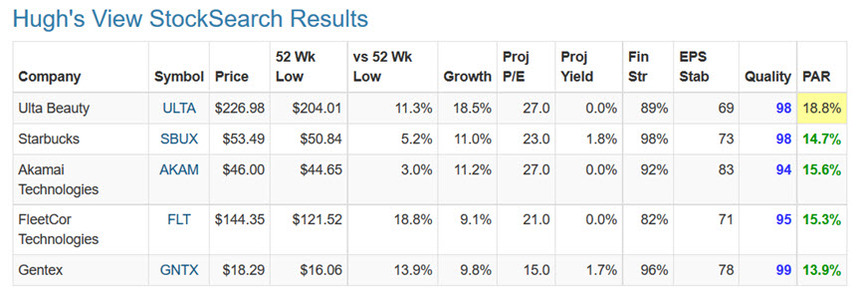
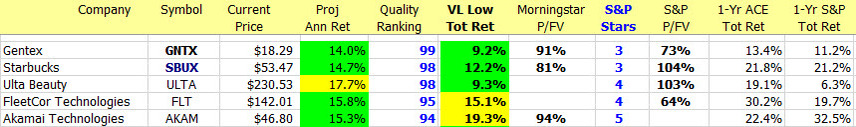
This overview does display a spectrum of expectations for the 1-year target range.

Srcl analysts 20170920

Morningstar continues to maintain a fair value of $110.

This delivers a price-to-fair value of 70/110 = 63.6%

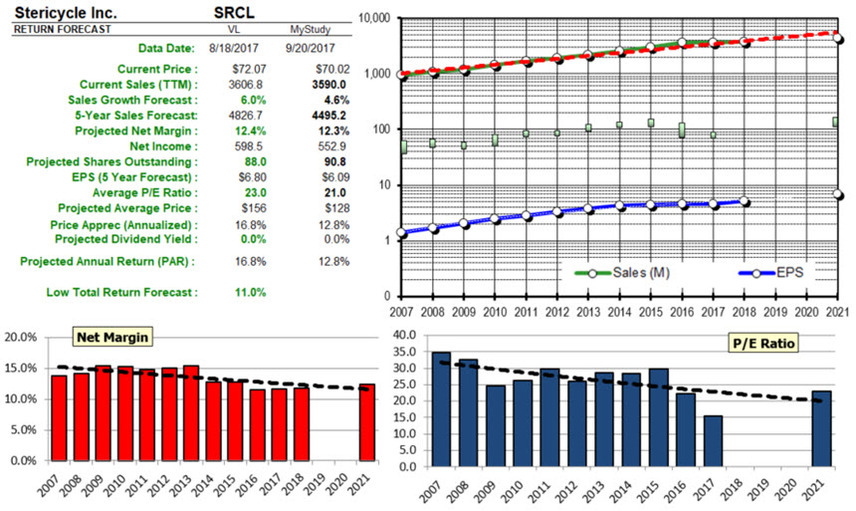
Growth: “These assumptions allow Stericycle to approach $4.5 billion in revenues by 2021, reflecting a five-year organic revenue CAGR of 3.7%.”

We expect the near term may yet be volatile as Stericycle continues to manage headwinds in its core business, integrate Shred-It, design and implement an enterprise wide information technology system, and ultimately restore confidence in a business that we continue to believe has the building blocks in place to produce reliable recurring revenue streams over the long run. (Barbara Noverini, August 10, 2017)

This Round Table perspective on Stericycle makes me question whether we should extend the -20% relative return selling criteria beyond one year.

Srcl rt relative return 20170920

Did we miss a “trough” in PAR — a potential selling opportunity when the stock price hit $151.6 during 2015?

How about quality degradation?

As the accompanying chronicle shows, the PAR did not reach “auto-sell” levels during 2015 — but this image does rekindle those questions about the notion of “support and resistance levels” on PAR charts also. For some stocks, should we be setting low-PAR and high-PAR triggers much like Bollinger bands in technical analysis? I don’t know. But it’s worth some considerations and a pile of case studies, I’d think.

Srcl chronicle 20170920

Bottom Line?
For current stakeholders, with the recent nudge upward in quality and the potential that the blending is going a little better, we think it prudent to hold through another earnings cycle and see if the “new company” can stabilize and move forward as suggested by the Value Line long-term outlook.

Be Careful Out There

This Week at MANIFEST (9/15/2017)

Tell me and I forget. Teach me and I remember. Involve me and I learn. — Ben Franklin

Be careful out there. — Phil Esterhaus, Hill Street Blues

“Historically, September is the worst month for U.S. stock market performance,” wrote Minerd. “Since 1929, the S&P Composite Index has averaged -1.1 percent for September, making it one of only three months with negative average returns over that time. The worst performing single month over this time period was September 1931, when the S&P composite fell 30 percent.” — Scott Minerd, Guggenheim Partners

Call it the Pre-January Effect if you’d like. It’s particularly relevant and pertinent for the smaller, faster-growing companies this time of year. With the January Effect, we benefit from reallocation and tax-related selling by investing in smaller companies that have been unduly punished during the fourth quarter with the hopes that repurchase and first quarter purchasing will restore many of the damaged prices.

The key word is “unduly.” And in the words of George Nicholson (via the 1984 NAIC Investors Manual) and Hill Street Blues Sergeant of the morning watch, Phil Esterhaus, “Be careful out there.”

Nicholson’s stark warning appears on page 98 of the 1984 Manual.

The guidance is offered in the context of his “Challenge”, a switching consideration that is intended to improve the overall portfolio by selling a holding and replacing it with a suitable, bolstering, substitute.

“When you begin this Challenge, the most important rule is requiring that the challenger (or replacement stock) is of equal or higher quality.” [His emphasis added, NOT mine.]

The accompany chart of screening results is from the Value Line Investment Analyzer. As shown, the listing is sorted by Projected 3-5 Year Total Return (Descending.) Needless to say, these return forecasts are red hot.

We draw your attention to the Financial Strength column where many of the companies are C, C+, etc. Remember, a “C” rating from Value Line is equivalent to an “F” from your school days. The ratings don’t get any lower than “C”. You have to reach for at least a “B++” to get above average.

We also note that many of these companies have stock prices less than $10. It’s one piece of the puzzle, but worthy of a yellow flag and caution.

And finally, check out the growth column. There’s not a whole lot of growth here. In the words of David L. Babson, growth conveys “grace” to long-term investors often healing wounds and compensating for buying a good stock at a price where you should have waited. So there’s not a lot of grace in this group … either.

Turnout Terraforming

As a reminder, the monthly Round Table webcasts will continue and not be disrupted by these new Tuesday sessions.

That said, we’ve heard from a number of you that you’d be interested in seeing us tackle some subjects, topics and methods independent of the Round Table sessions. So we will.

Tuesday seems to be a fairly optimum time to schedule additional sessions although we’ll likely have a few “Turnouts” on other days of the week.

We’d like to hear from you. (markr@manifestinvesting.com) What’s on your mind? What topics would you like to see covered? Here are some that have been suggested or considered so far:

  • Getting Risk Right (Cy Lynch)
  • Lessons From The Legends (Hugh McManus)
  • How Can We Calculate Relative Return?
  • Are Quality and Moats Related?
  • What Should Our Investment Club Meetings Look Like?

MANIFEST 40 Updates

  • 9. Cisco Systems (CSCO)
  • 11. Walgreen (WBA)
  • 12. Qualcomm (QCOM)
  • 26. CVS Health (CVS)
  • 28. LKQ (LKQ)

Round Table Stocks

  • Cisco Systems (CSCO)
  • CVS Health (CVS)
  • Gentex (GNTX)
  • LCI Industries (LCII)
  • LKQ (LKQ)
  • Qualcomm (QCOM)

Round Table Sessions (Video Archives)

Best Small Companies

  • 14. Gentherm (THRM)

Results, Remarks & References

Companies of Interest: Value Line (9/15/2017)

The average Value Line low total return forecast for the companies in this week’s update batch is 5.6% vs. 3.7% for the Value Line 1700 ($VLE).

Materially Stronger: Estee Lauder (EL), Modine Manufacturing (MOD)

Materially Weaker: Acacia Communications (ACIA), Synaptics (SYNA), Qualcomm (QCOM), Rite Aid (RAD), Harmonic (HLIT), BT Group (BT), Genuine Parts (GPC), Walgreen (WBA), CenturyLink (CTL), Commscope (COMM), Avon Products (AVP), Pharmerica (PMC), Infinera (INFN), ATN International (ATNI), Dish Network (DISH)

Discontinued: NeuStar (NSR), Reynolds American (RAI)

Market Barometers

Value Line Low Total Return (VLLTR) Forecast. The long-term low total return forecast for the 1700 companies featured in the Value Line Investment Survey is 3.7%, an increase from 3.5% last week. For context, this indicator has ranged from low single digits (when stocks are generally overvalued) to approximately 20% when stocks are in the teeth of bear markets like 2008-2009.

Update Batch: Stocks to Study (9/15/2017)

The average return forecast (PAR) for this week’s update batch is 9.0%.

The Long & Short. (September 15, 2017) Projected Annual Return (PAR): Long term return forecast based on fundamental analysis and five year time horizon. Quality Ranking: Percentile ranking of composite that includes financial strength, earnings stability and relative growth & profitability. VL Low Total Return (VLLTR): Low total return forecast based on 3-5 year price targets via Value Line Investment Survey. Morningstar P/FV: Ratio of current price to fundamentally-based fair value via www.morningstar.com S&P P/FV: Current price-to-fair value ratio via Standard & Poor’s. 1-Year ACE Outlook: Total return forecast based on analyst consensus estimates for 1-year target price combined with current yield. 1-Year S&P Outlook: 1-year total return forecast based on S&P 1-year price target.

Fave Five (9/8/2017)

Fave Five (9/8/2017)

Our Fave Five essentially represents a listing of stocks with favorable short term total return forecasts (1 year, according to Analyst Consensus Estimates, or ACE) combined with strong long-term return forecasts and good/excellent quality rankings. The average 1-year ACE total return forecast is 10.6%.

Our Favorite Bubbles …

… just might be the kind of bubbles that evolve when we blend Ivory Soap with Irish Spring. Hugh McManus likes to shop for opportunities among stocks that are trading near their 52-week lows and for non-core case studies, he’ll sometimes demand that the stock prices be near multi-year lows. Part of the driver behind this is the recognition that there’s often a large difference between 52-week highs and 52-week lows, even for some of the bluer chip established stocks. Isolating opportunities to invest when stocks are in the lower part of those annual ranges would seem to provide a margin of safety and reduce some of the downside … and “all things created equal” why should we shop anywhere else. (Read that in an Irish brogue for full effect.)

The five stocks flagged this week are repeat selections for the Fave Five tracking portfolio and as the parade of second opinions shows — there’s largely some consensus about expectations. FleetCor (FLT), Starbucks (SBUX) and Ulta Beauty (ULTA) also popped up as high-quality stocks with relatively outsized return potential in Ken Kavula’s review of the Forbes Most Innovative Companies. Gentex (GNTX) has also been a Round Table favorite with stellar performance over the years and Akamai Technologies (AKAM) has been featured as a worthy exploration consistent with the growing need for cyber security.

StockSearch Results using the stock screener at www.manifestinvesting.com with the following criteria: Manifest Rank (percentile ranking based on combination of quality and long term return forecast) greater than 99.44% — or top 1/2 of top percentile of all stocks covered, Financial Strength > B++ (70%) and stocks within 20% of their 52-week low.

The Long and Short of This Week’s Fave Five

The Long & Short. (September 8, 2017) Projected Annual Return (PAR): Long term return forecast based on fundamental analysis and five year time horizon. Quality Ranking: Percentile ranking of composite that includes financial strength, earnings stability and relative growth & profitability. VL Low Total Return (VLLTR): Low total return forecast based on 3-5 year price targets via Value Line Investment Survey. Morningstar P/FV: Ratio of current price to fundamentally-based fair value via www.morningstar.com S&P P/FV: Current price-to-fair value ratio via Standard & Poor’s. 1-Year ACE Outlook: Total return forecast based on analyst consensus estimates for 1-year target price combined with current yield. The data is ranked (descending order) based on this criterion. 1-Year S&P Outlook: 1-year total return forecast based on S&P 1-year price target. 1-Yr GS: 1-year total return forecast based on most recent price target issued by Goldman Sachs.

Fave Five Legacy (Tracking Portfolio)

The relative/excess return for the Fave Five tracking portfolio is +2.3% since inception.

The absolute annualized rate of return is 15.3%.

Tracking Dashboard: https://www.manifestinvesting.com/dashboards/public/fave-five