
This Week at MANIFEST (12/30/2016)
What I think a lot of great marathon runners do is envision crossing that finish line. Visualization is critical. But for me, I set a lot of little goals along the way to get my mind off that overwhelming goal of 26.2 miles. I know I’ve got to get to 5, and 12, and 16, and then I celebrate those little victories along the way.” — Bill Rancic
As most of you have guessed, our playful emphasis on Dow 20,000 is precisely that — playful.
We seem to pay way too much attention to essentially arbitrary piles of numbers and the rhinos life expectancy can be shortened by how they measure up quarter-to-quarter and year-to-year.
Brad Perry was right. A successful long-term investing experience is a marathon. And Bill Rancic is also correct, milestones matter. There’s plenty of noise, chaos and confusion that complicates life for average investors.
We’re thankful for a community of investors that is willing to focus on visions of the future and a willingness to imagine. We believe that our emphasis on return expectations and vigilance on fundamental threats and opportunity — is a path to better finish lines.
Value Line Arithmetic Average. Annual Returns. (1990-2016). The average annual total return for the equal-weight Value Line Arithmetic Average is 13.3% since 1990. The S&P 500 (VFINX) checks in at 9.3%. That Dow Jones Industrial Average that everyone is hyperventilating over has delivered 7.6% over the same time frame.
The November-December surge in the market pushed this year’s all-of-the-above index from 10-20% to 20-30%. This image will serve as the centerpiece for the January 2017 newsletter. Ask us again if we believe in a blend of small, medium and large companies as a crucial element of portfolio design and management.

MANIFEST 40 Updates
- 1. Apple (AAPL)
- 23. Intel (INTC)
- Apple (AAPL)
- Intel (INTC)
- IPG Photonics (IPGP)
- Skyworks (SWKS)
- Universal Display (OLED)
- 6. Universal Display (OLED)
- 18. Mellanox Technologies (MLNX)
- 27. IPG Photonics (IPGP)
Results, Remarks & References
- Trump-Impervious Market (Ken Fisher)
- How We Respond To Client Valuation Concerns (Joshua Brown, Ritholtz Wealth Management)
- TEVA — Is it Cheap Enough? (Integer Investments via Seeking Alpha)
Companies of Interest: Value Line (12/30/2016)
The average Value Line low total return forecast for the companies in this week’s update batch is 2.1% vs. 3.4% for the Value Line 1700 ($VLE).
Materially Stronger: Logitech (LOGI), Seagate Tech (STX), Applied Materials (AMAT), Micron Technology (MU)
Materially Weaker: Fitbit (FIT), Cray (CRAY), Stratasys (SSYS), Nimble Storage (NMBL), 3D Systems (DDD), HP Enterprise (HPE)
Discontinued: Lexmark (LXK), Imgram Micro (IM), Skulcandy (SKUL), Fairchild Semiconductor (FCS)
Market Barometers

Value Line Low Total Return (VLLTR) Forecast. The long-term low total return forecast for the 1700 companies featured in the Value Line Investment Survey is 3.4%, up from 3.3% last week. For context, this indicator has ranged from low single digits (when stocks are generally overvalued) to approximately 20% when stocks are in the teeth of bear markets like 2008-2009.
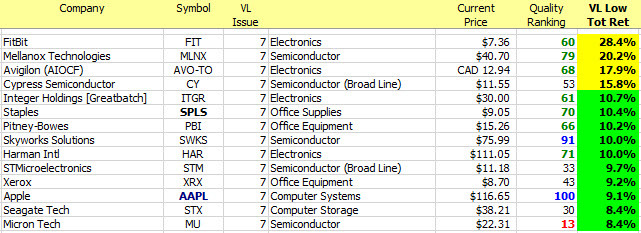
Stocks to Study (12/30/2016)
There’s a wide variety of opinions in the manifest of stocks to study this weekend. But some community favorites, some widely-followed leaders and some of our recent Best Small Companies made the list.

The Long & Short. (December 30, 2016) Projected Annual Return (PAR): Long term return forecast based on fundamental analysis and five year time horizon. Quality Ranking: Percentile ranking of composite that includes financial strength, earnings stability and relative growth & profitability. VL Low Total Return (VLLTR): Low total return forecast based on 3-5 year price targets via Value Line Investment Survey. Morningstar P/FV: Ratio of current price to fundamentally-based fair value via www.morningstar.com S&P P/FV: Current price-to-fair value ratio via Standard & Poor’s. 1-Year ACE Outlook: Total return forecast based on analyst consensus estimates for 1-year target price combined with current yield. The data is ranked (descending order) based on this criterion. 1-Year S&P Outlook: 1-year total return forecast based on S&P 1-year price target. 1-Yr “GS” Outlook: 1-year total return forecast based on most recent price target issued by Goldman Sachs.
