Fave Five (4/20/2018)
Our Fave Five essentially represents a listing of stocks with favorable short term total return forecasts (1 year, according to Analyst Consensus Estimates, or ACE) combined with strong long-term return forecasts and good/excellent quality rankings. The average 1-year ACE total return forecast is 13.4%.
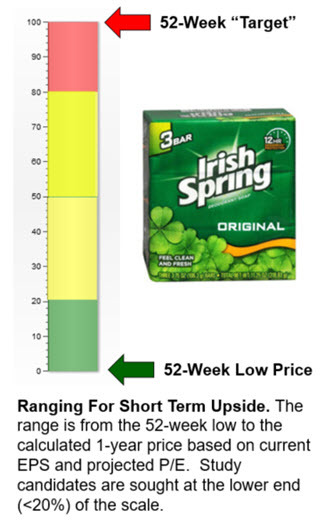
Homing In On The Range
One of our Round Table knights, Hugh McManus has a particularly strong track record over the last 7-8 years for our monthly webcast … so we’re obviously interested in better understanding his methods. Hugh McManus likes to shop for opportunities among stocks that are trading near their 52-week lows and for non-core case studies, he’ll sometimes demand that the stock prices be near multi-year lows. Part of the driver behind this is the recognition that there’s often a large difference between 52-week highs and 52-week lows, even for some of the bluer chip established stocks. Isolating opportunities to invest when stocks are in the lower part of those annual ranges would seem to provide a margin of safety and reduce some of the downside … and “all things created equal” why should we shop anywhere else. (Read that in an Irish brogue for full effect.)
Hugh has reminded us in the past that it’s not as simple as a percentage difference between the current price and the 52-week low. As shown here, it’s more of a range. The lower limit is indeed the 52-week low. But the higher limit of the range is a 1-year price target based on projected earnings and P/E ratio — using our assumptions for growth, profitability and long term valuation.
A stock trading near its 52-week low would have a “position-in-range” of 0%.
The Long and Short of This Week’s Fave Five
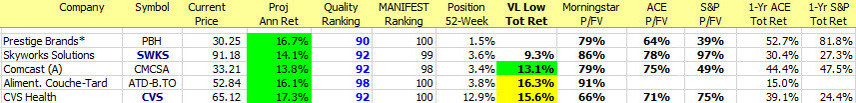
Long & Short Term Perspectives. (April 20, 2018) Projected Annual Return (PAR): Long term return forecast based on fundamental analysis and five year time horizon. Quality Ranking: Percentile ranking of composite that includes financial strength, earnings stability and relative growth & profitability. 52-Week Position: Position on scale between 52-week low price and 52-week target price. The data is ranked (ascending order) based on this criterion. VL Low Total Return (VLLTR): Low total return forecast based on 3-5 year price targets via Value Line Investment Survey. Morningstar P/FV: Ratio of current price to fundamentally-based fair value via www.morningstar.com S&P P/FV: Current price-to-fair value ratio via Standard & Poor’s. 1-Year ACE Outlook: Total return forecast based on analyst consensus estimates for 1-year target price combined with current yield. 1-Year S&P Outlook: 1-year total return forecast based on S&P 1-year price target.
Fave Five Legacy (Tracking Portfolio)
The relative/excess return for the Fave Five tracking portfolio is +5.1% since inception.
The absolute annualized rate of return is 18.5%.
Tracking Dashboard: https://www.manifestinvesting.com/dashboards/public/fave-five
