Be Careful Out There

This Week at MANIFEST (9/15/2017)

Tell me and I forget. Teach me and I remember. Involve me and I learn. — Ben Franklin

Be careful out there. — Phil Esterhaus, Hill Street Blues

“Historically, September is the worst month for U.S. stock market performance,” wrote Minerd. “Since 1929, the S&P Composite Index has averaged -1.1 percent for September, making it one of only three months with negative average returns over that time. The worst performing single month over this time period was September 1931, when the S&P composite fell 30 percent.” — Scott Minerd, Guggenheim Partners

Call it the Pre-January Effect if you’d like. It’s particularly relevant and pertinent for the smaller, faster-growing companies this time of year. With the January Effect, we benefit from reallocation and tax-related selling by investing in smaller companies that have been unduly punished during the fourth quarter with the hopes that repurchase and first quarter purchasing will restore many of the damaged prices.

The key word is “unduly.” And in the words of George Nicholson (via the 1984 NAIC Investors Manual) and Hill Street Blues Sergeant of the morning watch, Phil Esterhaus, “Be careful out there.”

Nicholson’s stark warning appears on page 98 of the 1984 Manual.

The guidance is offered in the context of his “Challenge”, a switching consideration that is intended to improve the overall portfolio by selling a holding and replacing it with a suitable, bolstering, substitute.

“When you begin this Challenge, the most important rule is requiring that the challenger (or replacement stock) is of equal or higher quality.” [His emphasis added, NOT mine.]

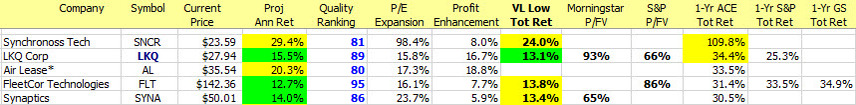
The accompany chart of screening results is from the Value Line Investment Analyzer. As shown, the listing is sorted by Projected 3-5 Year Total Return (Descending.) Needless to say, these return forecasts are red hot.

We draw your attention to the Financial Strength column where many of the companies are C, C+, etc. Remember, a “C” rating from Value Line is equivalent to an “F” from your school days. The ratings don’t get any lower than “C”. You have to reach for at least a “B++” to get above average.

We also note that many of these companies have stock prices less than $10. It’s one piece of the puzzle, but worthy of a yellow flag and caution.

And finally, check out the growth column. There’s not a whole lot of growth here. In the words of David L. Babson, growth conveys “grace” to long-term investors often healing wounds and compensating for buying a good stock at a price where you should have waited. So there’s not a lot of grace in this group … either.

Turnout Terraforming

As a reminder, the monthly Round Table webcasts will continue and not be disrupted by these new Tuesday sessions.

That said, we’ve heard from a number of you that you’d be interested in seeing us tackle some subjects, topics and methods independent of the Round Table sessions. So we will.

Tuesday seems to be a fairly optimum time to schedule additional sessions although we’ll likely have a few “Turnouts” on other days of the week.

We’d like to hear from you. (markr@manifestinvesting.com) What’s on your mind? What topics would you like to see covered? Here are some that have been suggested or considered so far:

  • Getting Risk Right (Cy Lynch)
  • Lessons From The Legends (Hugh McManus)
  • How Can We Calculate Relative Return?
  • Are Quality and Moats Related?
  • What Should Our Investment Club Meetings Look Like?

MANIFEST 40 Updates

  • 9. Cisco Systems (CSCO)
  • 11. Walgreen (WBA)
  • 12. Qualcomm (QCOM)
  • 26. CVS Health (CVS)
  • 28. LKQ (LKQ)

Round Table Stocks

  • Cisco Systems (CSCO)
  • CVS Health (CVS)
  • Gentex (GNTX)
  • LCI Industries (LCII)
  • LKQ (LKQ)
  • Qualcomm (QCOM)

Round Table Sessions (Video Archives)

Best Small Companies

  • 14. Gentherm (THRM)

Results, Remarks & References

Companies of Interest: Value Line (9/15/2017)

The average Value Line low total return forecast for the companies in this week’s update batch is 5.6% vs. 3.7% for the Value Line 1700 ($VLE).

Materially Stronger: Estee Lauder (EL), Modine Manufacturing (MOD)

Materially Weaker: Acacia Communications (ACIA), Synaptics (SYNA), Qualcomm (QCOM), Rite Aid (RAD), Harmonic (HLIT), BT Group (BT), Genuine Parts (GPC), Walgreen (WBA), CenturyLink (CTL), Commscope (COMM), Avon Products (AVP), Pharmerica (PMC), Infinera (INFN), ATN International (ATNI), Dish Network (DISH)

Discontinued: NeuStar (NSR), Reynolds American (RAI)

Market Barometers

Value Line Low Total Return (VLLTR) Forecast. The long-term low total return forecast for the 1700 companies featured in the Value Line Investment Survey is 3.7%, an increase from 3.5% last week. For context, this indicator has ranged from low single digits (when stocks are generally overvalued) to approximately 20% when stocks are in the teeth of bear markets like 2008-2009.

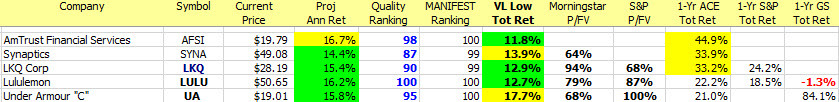
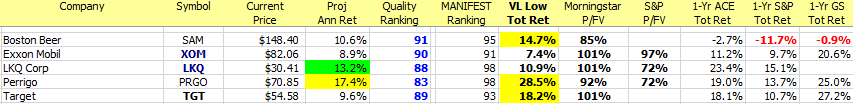
Update Batch: Stocks to Study (9/15/2017)

The average return forecast (PAR) for this week’s update batch is 9.0%.

The Long & Short. (September 15, 2017) Projected Annual Return (PAR): Long term return forecast based on fundamental analysis and five year time horizon. Quality Ranking: Percentile ranking of composite that includes financial strength, earnings stability and relative growth & profitability. VL Low Total Return (VLLTR): Low total return forecast based on 3-5 year price targets via Value Line Investment Survey. Morningstar P/FV: Ratio of current price to fundamentally-based fair value via www.morningstar.com S&P P/FV: Current price-to-fair value ratio via Standard & Poor’s. 1-Year ACE Outlook: Total return forecast based on analyst consensus estimates for 1-year target price combined with current yield. 1-Year S&P Outlook: 1-year total return forecast based on S&P 1-year price target.

Fave Five: Triple Play (4/14/2017)

Fave Five (4/14/2017)

Our Fave Five essentially represents a listing of stocks with favorable short term total return forecasts (1 year, according to Analyst Consensus Estimates, or ACE) combined with strong long-term return forecasts and good/excellent quality rankings. The average 1-year ACE total return forecast is 8.8%.

This week we return to the triple play screening method for our five favorites. The triple play possibility occurs when you find a stock that is very depressed in price and also appears to be on the verge of substantially boosting its profit margins. The triple play effect is possible in that:

(1) The depressed price of the stock can return to normal levels;

(2) increased profit margins can produce increased EPS and a higher price;

(3) may also cause higher P/E ratios, or P/E expansion.

The Fave Five This Week

  • Air Lease (AL)
  • FleetCor (FLT)
  • LKQ (LKQ)
  • Synaptics (SYNA)
  • Synchronoss Tech (SNCR)

The Long and Short of This Week’s Fave Five

The Long & Short. (April 14, 2017) Projected Annual Return (PAR): Long term return forecast based on fundamental analysis and five year time horizon. Quality Ranking: Percentile ranking of composite that includes financial strength, earnings stability and relative growth & profitability. VL Low Total Return (VLLTR): Low total return forecast based on 3-5 year price targets via Value Line Investment Survey. Morningstar P/FV: Ratio of current price to fundamentally-based fair value via www.morningstar.com S&P P/FV: Current price-to-fair value ratio via Standard & Poor’s. 1-Year ACE Outlook: Total return forecast based on analyst consensus estimates for 1-year target price combined with current yield. The data is ranked (descending order) based on this criterion. 1-Year S&P Outlook: 1-year total return forecast based on S&P 1-year price target. 1-Yr GS: 1-year total return forecast based on most recent price target issued by Goldman Sachs.

Fave Five Legacy (Tracking Portfolio)

The relative/excess return for the Fave Five tracking portfolio is +1.0% since inception. 49.5% of selections have outperformed the Wilshire 5000 since original selection.

Tracking Dashboard: https://www.manifestinvesting.com/dashboards/public/fave-five

Fave Five (4/7/2017)

Fave Five (4/7/2017)

Our Fave Five essentially represents a listing of stocks with favorable short term total return forecasts (1 year, according to Analyst Consensus Estimates, or ACE) combined with strong long-term return forecasts and good/excellent quality rankings. The average 1-year ACE total return forecast is 8.4%.

The stocks from the Finviz Week (3/24/2017) have been doing exceptionally well (relative return = +7.5% already) and we’ll make sure to visit that screening method again — and likely at least once/month.

The Fave Five This Week

  • AmTrust Financial Services (AFSI)
  • LKQ (LKQ)
  • LuLuLemon (LULU)
  • Synaptics (SYNA)
  • Under Armour (UA)

The Long and Short of This Week’s Fave Five

The Long & Short. (April, 2017) Projected Annual Return (PAR): Long term return forecast based on fundamental analysis and five year time horizon. Quality Ranking: Percentile ranking of composite that includes financial strength, earnings stability and relative growth & profitability. VL Low Total Return (VLLTR): Low total return forecast based on 3-5 year price targets via Value Line Investment Survey. Morningstar P/FV: Ratio of current price to fundamentally-based fair value via www.morningstar.com S&P P/FV: Current price-to-fair value ratio via Standard & Poor’s. 1-Year ACE Outlook: Total return forecast based on analyst consensus estimates for 1-year target price combined with current yield. The data is ranked (descending order) based on this criterion. 1-Year S&P Outlook: 1-year total return forecast based on S&P 1-year price target. 1-Yr GS: 1-year total return forecast based on most recent price target issued by Goldman Sachs.

Fave Five Legacy (Tracking Portfolio)

The relative/excess return for the Fave Five tracking portfolio is +1.3% since inception. (The absolute rate of return is 17.0%.) 50.2% of selections have outperformed the Wilshire 5000 since original selection.

Tracking Dashboard: https://www.manifestinvesting.com/dashboards/public/fave-five

Fave Five: Gone Irish (3/17/2017)

Fave Five (3/14/2017)

Our Fave Five essentially represents a listing of stocks with favorable short term total return forecasts (1 year, according to Analyst Consensus Estimates, or ACE) combined with strong long-term return forecasts and good/excellent quality rankings. The average 1-year ACE total return forecast is 7.1%.

The Fave Five This Week

  • Boston Beer (SAM)
  • Exxon Mobil (XOM)
  • LKQ Corp (LKQ)
  • Perrigo (PRGO)
  • Target (TGT)

Gone Shopping With Walter (Schloss) and Hugh

“When buying a stock, I find it helpful to buy near the low of the past few years. A stock may go as high as 125 and then decline to 60 and you think it attractive. 3 years before the stock sold at 20 which shows that there is some vulnerability in it.” — Walter Schloss

“…the analyst interested in value is likely to place only minor emphasis upon the short term earnings outlook; whereas the analyst who endeavors to anticipate the price movements of the near future will make such outlook his major concern.” —
Ben Graham, Security Analysis

Hugh McManus has been a regular — and very successful stock selector — as a participant in our monthly Round Table series over the last eight years or so. Even in the months when he’s globe trotting and unable to join us, we’ll generally take a quick look for opportunities with a quick stock screen for high quality companies priced near their 52-week (or multi-year) lows. For more on this subject, see: Gone Fishing — Patiently and Disciplined Fishing

If a company is primed for long-term growth, buying it when the price is depressed is better than buying it when it’s at a 52-week high. If the stock price drops to a new low, there’s always bad news to explain the fall, which is one of those obvious truths. I had to learn whether I wanted to fixate on the bad news or focus on the low price of a good company. Most people seem to be transfixed by the news. I take it one step further and hope the bad news persists for a while — it’s where the psychiatrist would step in — as it allows me to buy more.

In 1997, or thereabouts, Ken “Mr. NAIC” Janke, commented that members of the organization were masterful at identifying quality companies, but not nearly as good at picking a low price. I had already adopted the practice of buying companies when they reached or were close to a 52-week low. It’s a rule not a law: for an idealized growth company, today’s close is the new 52-week low.

Ken Janke often spoke of the reality between the high and low prices during a given year for virtually all companies. The range is bigger than most people realize, as underscored by the accompanying chart via Saber Capital Management and John Huber.

Patience is genius in disguise.

The Discipline of Time Arbitrage. Time arbitrage is being willing to maintain a 3-5 year time horizon when most investors
and analysts are thinking about the next quarter. [This represents] a willingness to buy stocks that others are selling for short-term reasons. Many market participants want/need short-term results and so focus is on things like: Catalysts, short-term expectations, quarterly results …

Why Does This Work? Focusing on the long-term is difficult because:

  • Takes patience — There can be periods of under performance.
  • Most investors (clients) want results quarterly, or at least yearly, and so most money managers try to accommodate these short-term demands. (i.e. who cares what Apple looks like in 3 years, how many iphones are they going to sell this quarter??)
  • Short-term thinking (among investors, fund managers, and corporate management teams) is pervasive now, and the speed of technology and information probably intensifies this view.

All of these decisions being made for short-term reasons creates opportunity (and the biggest market inefficiency in my opinion) for those who can look out 2-3 years. Source: Saber Capital Management

StockSearch Results: Hugh’s Hunt For 52 Week Lows. Hugh maintains a short list of vetted stocks, most of which he has been a long term shareholder. He monitors for accumulation opportunities when one of his favorites approaches a 52-week low. For the screening results shown, we’ve limited the field to high-quality (excellent) stocks that are within 5% of their 52-week low, while demanding above average financial strength. [Source: www.manifestinvesting.com StockSearch, 3/17/2017.]

The Long and Short of This Week’s Fave Five

The Long & Short. (March 17, 2017) Projected Annual Return (PAR): Long term return forecast based on fundamental analysis and five year time horizon. Quality Ranking: Percentile ranking of composite that includes financial strength, earnings stability and relative growth & profitability. VL Low Total Return (VLLTR): Low total return forecast based on 3-5 year price targets via Value Line Investment Survey. Morningstar P/FV: Ratio of current price to fundamentally-based fair value via www.morningstar.com S&P P/FV: Current price-to-fair value ratio via Standard & Poor’s. 1-Year ACE Outlook: Total return forecast based on analyst consensus estimates for 1-year target price combined with current yield. The data is ranked (descending order) based on this criterion. 1-Year S&P Outlook: 1-year total return forecast based on S&P 1-year price target. 1-Yr GS: 1-year total return forecast based on most recent price target issued by Goldman Sachs.

Fave Five Legacy (Tracking Portfolio)

The relative/excess return for the Fave Five tracking portfolio is +0.8% since inception. (The absolute rate of return is 19.0%.) 48.5% of selections have outperformed the Wilshire 5000 since original selection.

Tracking Dashboard: https://www.manifestinvesting.com/dashboards/public/fave-five

Fave Five (1/20/2017)

Fave Five (1/20/2017)

Our Fave Five essentially represents a listing of stocks with favorable short term total return forecasts (1 year, according to Analyst Consensus Estimates, or ACE) combined with strong long-term return forecasts and good/excellent quality rankings. The average 1-year ACE total return forecast is 7.7%.

This week we place a little extra emphasis on companies with a strong long-term outlook from S&P. (See S&P Price-to-Fair Value, P/FV)

For more information on joining our 11th annual Groundhog Challenge, launching 2/2/2017, as either a group or an individual investor, drop a note to markr@manifestinvesting.com.

The Fave Five This Week

  • Affiliated Managers (AMG)
  • LKQ Corp (LKQ)
  • Michael Kors (KORS)
  • Mylan Labs (MYL)
  • Perrigo (PRGO)

The Long and Short of This Week’s Fave Five

The Long & Short. (January 20, 2017) Projected Annual Return (PAR): Long term return forecast based on fundamental analysis and five year time horizon. Quality Ranking: Percentile ranking of composite that includes financial strength, earnings stability and relative growth & profitability. VL Low Total Return (VLLTR): Low total return forecast based on 3-5 year price targets via Value Line Investment Survey. Morningstar P/FV: Ratio of current price to fundamentally-based fair value via www.morningstar.com S&P P/FV: Current price-to-fair value ratio via Standard & Poor’s. 1-Year ACE Outlook: Total return forecast based on analyst consensus estimates for 1-year target price combined with current yield. The data is ranked (descending order) based on this criterion. 1-Year S&P Outlook: 1-year total return forecast based on S&P 1-year price target. 1-Yr GS: 1-year total return forecast based on most recent price target issued by Goldman Sachs.

Fave Five Legacy (Tracking Portfolio)

The relative/excess return for the Fave Five tracking portfolio is +3.0% since inception. 46.4% of selections have outperformed the Wilshire 5000 since original selection.

Tracking Dashboard: https://www.manifestinvesting.com/dashboards/public/fave-five

Fave Five (1/6/2017)

Fave Five (1/6/2017)

Our Fave Five essentially represents a listing of stocks with favorable short term total return forecasts (1 year, according to Analyst Consensus Estimates, or ACE) combined with strong long-term return forecasts and good/excellent quality rankings. The average 1-year ACE total return forecast is 7.9%.

For more information on joining our 11th annual Groundhog Challenge, launching 2/2/2017, as either a group or an individual investor, drop a note to markr@manifestinvesting.com.

The Fave Five This Week

  • Cerner (CERN)
  • LKQ Corp (LKQ)
  • Silicon Motion Technology (SIMO)
  • Teva Pharma (TEVA)
  • Under Armour (UAA)

The Long and Short of This Week’s Fave Five

The Long & Short. (January 6, 2017) Projected Annual Return (PAR): Long term return forecast based on fundamental analysis and five year time horizon. Quality Ranking: Percentile ranking of composite that includes financial strength, earnings stability and relative growth & profitability. VL Low Total Return (VLLTR): Low total return forecast based on 3-5 year price targets via Value Line Investment Survey. Morningstar P/FV: Ratio of current price to fundamentally-based fair value via www.morningstar.com S&P P/FV: Current price-to-fair value ratio via Standard & Poor’s. 1-Year ACE Outlook: Total return forecast based on analyst consensus estimates for 1-year target price combined with current yield. The data is ranked (descending order) based on this criterion. 1-Year S&P Outlook: 1-year total return forecast based on S&P 1-year price target. 1-Yr GS: 1-year total return forecast based on most recent price target issued by Goldman Sachs.

Fave Five Legacy (Tracking Portfolio)

The relative/excess return for the Fave Five tracking portfolio is +3.4% since inception. 43.9% of selections have outperformed the Wilshire 5000 since original selection.

Tracking Dashboard: https://www.manifestinvesting.com/dashboards/public/fave-five

Fave Five (10/28/2016)

Fave Five (10/28/2016)

Our Fave Five essentially represents a listing of stocks with favorable short term total return forecasts (1 year, according to Analyst Consensus Estimates, or ACE) combined with strong long-term return forecasts and good/excellent quality rankings.

So you’re looking at the stocks in the top 1% of all companies according to MANIFEST Rank (Return Forecast and Quality combination) that have the lowest price-to-fair value ratios (P/FV) according to S&P. The P/FV profile for the S&P Platinum Portfolio is shown here:

The Fave Five This Week

  • Abbvie (ABBV)
  • Celgene (CELG)
  • Deckers (DECK)
  • LKQ Corp (LKQ)
  • Stericycle (SRCL)

Context: The median S&P price to fair value ratio is 102%.

The Long and Short of This Week’s Fave Five

The Long & Short. (October 28, 2016) Projected Annual Return (PAR): Long term return forecast based on fundamental analysis and five year time horizon. Quality Ranking: Percentile ranking of composite that includes financial strength, earnings stability and relative growth & profitability. VL Low Total Return (VLLTR): Low total return forecast based on 3-5 year price targets via Value Line Investment Survey. Morningstar P/FV: Ratio of current price to fundamentally-based fair value via www.morningstar.com S&P P/FV: Current price-to-fair value ratio via Standard & Poor’s. 1-Year ACE Outlook: Total return forecast based on analyst consensus estimates for 1-year target price combined with current yield. The data is ranked (descending order) based on this criterion. 1-Year S&P Outlook: 1-year total return forecast based on S&P 1-year price target. 1-Yr GS: 1-year total return forecast based on most recent price target issued by Goldman Sachs.

Weekend Warriors

The relative/excess return for the Weekend Warrior tracking portfolio is +8.7% since inception. 42.6% of selections have outperformed the Wilshire 5000 since original selection.

Tracking Dashboard: https://www.manifestinvesting.com/dashboards/public/weekend-warriors

Morningstar Conference (2016)

Morningstar Investment Conference (2016)

“I see investing as the responsible act of the broad middle class, yet there’s still so many people we don’t touch today.” — Don Phillips, Morningstar

The annual shareholder meeting of Berkshire Hathaway has been called the Woodstock of capitalism, drawing tens of thousands of investors from all over the world.

I think the Morningstar Investment Conference might be “bigger” than the annual pilgrimage to Omaha.

Really? Yes, really. On a per capita basis, comparing the number of investors in Omaha versus the over 2000 advisors and practitioners in Chicago, the Morningstar Investment Conference, or #MICUS, might be a bigger “show.” Before you scoff, consider the population of registered advisors and representatives vs. how many attend. Morningstar puts on an effective event and while you’re scratching your head over the per capita comparison, don’t forget there’s an admission price for the Chicago program.

Make no mistake. Don Phillips and the Morningstar gang throw one heckuva party. We’re reminded about rampant fallacies with respect to passive vs. active investing, a growing discovery and emphasis on sustainability, the mistaken generalizations about advisors vs. registered reps, the new DOL fiduciary regulations and a litany of topics worthy of consideration and discussion.

  • “Supporting responsible investing is actually more closely related to behavior modification.” — Don Phillips
  • We’ve been fans of the Morningstar MOAT Fund for some time. Microsoft’s acquisition of LinkedIn (LNKD) provides quite a boost to the fund’s value in recent days. The merits of LinkedIn — and investment thesis — were covered by Morningstar’s Elizabeth Collins during an early panel session.
  • Best Ideas: Biogen (BIIB) and Williams-Sonoma (WSM). (Elizabeth Collins)
  • “Global growth over last four years has been slower … but it’s actually closer to long-term norms.” Prevalent themes: persistent strong U.S. dollar, U.S. treasury yields not justified and some scattered opportunities in emerging markets. (Michael Hasenstab, Franklin Templeton)
  • “Investors should not use a shot gun approach with respect to emerging markets. Use a rifle instead.” (Hasenstab)
  • Reminiscent of a couple of previous Morningstar conferences, Bill Bernstein served as this year’s “Grumpy Old Man” but he seems to agree with many of us on many issues. But he’s a delightful curmudgeon.
  • “The case for index and passive investing has been dramatically overstated.” (Phillips)
  • “Alternative funds are not an investment. They are a compensation scheme.” (Bernstein) [Told you …]
  • What hasn’t been overstated? The cleavage between high-cost and low-cost. (Phillips, Bernstein)
  • “I pride myself on not knowing what stocks are in my portfolios. I’m a Quant.” (Cliff Asness, AQR)
  • I respect and enjoy the work of Rob Arnott (Research Affiliates) and Cliff Asness (AQR). But watching them debate like sumo wrestlers trying to give each other a wedgie in a cage match on the head of a pin is not my favorite post-breakfast activity. I’m glad they believe in “Tin Cup”, grant permission for us to “sin a little” with asset allocation and speculation and I now have a greater appreciation for Smart/Strategic Beta and I’m thankful that at it’s core — we have been doing a lot of the factor-based opportunity stuff for a long time. But most of all, I’m grateful for the elegant simplicity of our methods. It’s a powerful reminder about Occam’s Razor.

(Continuing with our regularly scheduled programming and weekly update …)

MANIFEST 40 Updates

  • 9. Cisco Systems (CSCO)
  • 10. Qualcomm (QCOM)
  • 12. Walgreen Boots (WBA)
  • 37. CVS Health (CVS)
  • 40. LKQ Corp (LKQ)

Round Table Stocks: Cisco Systems (CSCO), CVS Health (CVS), Gentex (GNTX), Inteliquent (IQNT), ITC Holdings (ITC), LKQ Corp (LKQ), Neustar (NSR), Qualcomm (QCOM), Synaptics (SYNA)

Results, Remarks & References

Companies of Interest: Value Line (6/17/2016)

The average Value Line low total return forecast for the companies in this week’s update batch is 5.6% vs. 5.5% for the Value Line 1700 ($VLE).

Materially Stronger: Infinera (INFN), Drew Industries (DW)

Materially Weaker: American Movil (AMX), Synaptics (SYNA), Titan (TWI), Dish Network (DISH)

Discontinued: Time Warner Cable (TWC), Cleco (CNL), Fuel Systems Solutions (FSYS)

Coverage Initiated/Restored:

Market Barometers

Value Line Low Total Return (VLLTR) Forecast. The long-term low total return forecast for the 1700 companies featured in the Value Line Investment Survey is 5.6%, unchanged from 5.6% last week. For context, this indicator has ranged from low single digits (when stocks are generally overvalued) to approximately 20% when stocks are in the teeth of bear markets like 2008-2009.

Breaking.

Guggenheim has reinstated the S&P Small- and Mid-Cap equally-weighted funds: EWSC and EWMC

For a complete list of Guggenheim ETFs, see:

http://gi.guggenheiminvestments.com/products

Market Barometers (Continued)

In honor of this week’s Morningstar Investment Conference in Chicago, their weekly determination of stock prices in general vs. the “fair value” for the overall stock market.

Mstar market fair value 20160615

Stocks to Study (6/17/2016)

  • LKQ Corp (LKQ) — Highest MANIFEST Rank
  • Neustar (NSR) — Highest Low Return Forecast (VL)
  • Borg Warner (BWA) — Lowest P/FV (Morningstar)
  • Arris Group (ARRS) —Lowest P/FV (S&P)
  • China Auto Systems (CAAS) — Best 1-Yr Outlook (ACE)
  • Juniper Networks (JNPR) — Best 1-Yr Outlook (S&P)
  • Verifone Systems (PAY) — Best 1-Yr Outlook (GS)

The Long & Short of This Week’s Update Batch

The Long & Short. (June 17, 2016) Projected Annual Return (PAR): Long term return forecast based on fundamental analysis and five year time horizon. Quality Ranking: Percentile ranking of composite that includes financial strength, earnings stability and relative growth & profitability. VL Low Total Return (VLLTR): Low total return forecast based on 3-5 year price targets via Value Line Investment Survey. Morningstar P/FV: Ratio of current price to fundamentally-based fair value via www.morningstar.com S&P P/FV: Current price-to-fair value ratio via Standard & Poor’s. 1-Year ACE Outlook: Total return forecast based on analyst consensus estimates for 1-year target price combined with current yield. The data is ranked (descending order) based on this criterion. 1-Year S&P Outlook: 1-year total return forecast based on S&P 1-year price target. 1-Yr “GS” Outlook: 1-year total return forecast based on most recent price target issued by Goldman Sachs.

Press On: Six Stocks for 2016

Press on.  2016, so far, hasn’t been much to cheer about.  But the long-term perspective hasn’t cratered and your 401(k) isn’t locked in the Titanic safe while a bunch of icebergs make like rocket-powered grenade launchers — no matter what those news anchors say.  Based on the things that matter to long-term investors, press on.  Here are some shopping ideas to rake across the fireplace coals while remaining focused on what matters.

What Do We Do Now?

Answer: “Same thing we do every day, Pinky.” — The Brain.

Bottom Line: It’s still OK to be optimistic about the future. Invest. Invest well. Be selective and discover industry leaders when they’re on sale. Simply put, the same thing we do every day. Invest regularly. Although growth rates have moderated, Armageddon isn’t here yet and continue to design and maintain portfolios with overall average sales growth rates of 10-12% if you have a long time horizon and risk tolerance. Turbulent times shouldn’t be a surprise. To most of us, they’re not. Do not be surprised when P/E ratios moderate and retreat a bit as Quantitative Easing (QE) dwindles, interest rates swell a bit and the huffing and puffing that has bolstered the market over the last couple of years (while profitability was challenged) subsides.

Value Line 1700 ($VLE): Long Term Performance

On January 1, 2000 the even-weighted index value of the 1700 stocks featured in the Value Line Investment Survey was 1025.80. Sixteen years later, $VLE reached a value of 4358.69.

This is an annualized total return of 9.5%. (S&P 500 advanced 3.9% during the same 16-year period)

The world ended at least twice during that sixteen year period. During the most recent excursion during the Great Recession, Warren Buffett shared that he hoped that he lived long enough to experience the next market break. Once again, he may be right. And present.

Value Line 1700. The arithmetic average (equal weighting) means that the index didn’t get extra credit for Amazon, Apple, Facebook, Google or Netflix during 2015. As such, $VLE was down -6.9% during 2015 as shown by the 12-month rate of change (ROC) portion of the graphic.

Why The Value Line 1700?

9.5%. It bears repeating.

That’s 5.6 percentage points (560 bps) better than the S&P 500 during the 16-year period.

We like to do much of our shopping here. 39-of-the-40 most widely-followed stocks by Manifest Investing subscribers hail from the 1700. Only PRA Group (PRAA) is a current exception — and may actually warrant some accumulative speculation at this time. More on that later.

We believe in all-of-the-above shopping and we know that it makes strategic sense to discover and own large, medium and smaller companies in order to nail down that balance between the slower growing blue-chip stalwarts and the promising upstarts. The Value Line 1700 provides a pretty good vista of qualifying opportunities. We do look forward to the day when some of the Best Small Companies For 2016 join the VL 1700 and ultimately, the MANIFEST 40.

The other reason is that we like to be Schlossian in our investing efforts. For those unfamiliar, check out the works of Buffett colleague and friend, Walter Schloss, and his reinforcement that any and all of us can do this — and experience successful long-term investing. Walter rarely shopped outside the VL 1700.

Value Line 1700 Industrials: Sales History & Forecast Trend

The long-term growth rate of the aggregated sales for the Value Line industrials is now approximately 6% — a condition “eerily” suggested in our June-2009 cover story, Grated Expectations

If we squint, we can see 2015 take a “dip” that actually rivals 2008-2009 a bit. This probably accounts for much of the angst prevalent among most of the talking heads.

Yes, Europe continues to struggle. China slows. Demand for petroleum is stunningly low at a time when production is peaking despite the curtailment of higher-cost production alternatives that have terraformed the energy landscape over the last few years. The American consumer is better but still slogging through molasses when it comes to disposable income and consumption. Political candidates tell us just about anything they think we want to hear to get elected.

But it ain’t Armageddon. It’s not different this time.

And this is why we invest.

Value Line 1700 Industrials: Profitability Trends

This image is probably the keystone in our long term perspective.

First, it’s a tribute to the optimism of the Value Line analysts. Their 3-5 year forecast for most companies is perpetually unprecedented. Someday we’ll have the dream of commercialized nuclear fusion, a cure for cancer and the common cold and they’ll be right with the long term profitability forecast. But for now, it’s our reminder to shave a little off the top while performing our own studies and checking in with the Value Line net margin (and ROE) forecasts.

Second, although 2015 was nothing to write home about, it’s not Armageddon either. The relatively low net margin results (still taking shape, by the way, as the 4Q2015 company confessions roll in) go a long way to explain that Goldilocks aura that many of us feel. Things are better. But they’re not what they should be — at least not yet.

That said, even discounting the 2019 elephant on this graph, the long term trend is favorable and American innovation and optimism is still alive and kicking. Imagine if we’d ever start to tackle/eliminate the corporate income tax malignancy that continues to give the rest of the world a head start and tilted playing field when it comes to manufacturing and delivering goods to We, The People. It’s on the list with fusion, cancer cures and we can dare to dream.

Value Line Industrials ($VLE): Valuation Trends

It’s beginning to appear that 2014-2015 was something of a peak when it comes to P/E ratios.

The surge was likely fueled by low inflation/low interest rates, shadowy accumulation of stocks and continued respect for the best companies who seem to prevail and persist in the face of steep challenges.

That … and probably a little exuberance thrown in for good measure. We noted that the Value Line low total return forecast did hover at multi-decade lows during this period and the same has been true for MIPAR (median return forecast for all companies covered at Manifest Investing.)

The P/E that matters most to us is the projected average P/E in our forecasts and the average for the 3-5 year forecast at Value Line seems headed more for 18x than 22×. It’ll be interesting to see the Value Line expectations when the data array ratchets one column soon, displaying one year further out.

MANIFEST 40: The Long and Short

Price Targets and Veracity

In the preceding chart, some (including me) have wondered about the utility of gauging one-year expectations alongside our traditional long-term forecasts. Intuitively, I’d like to think that pursuing a company with a solid long-term perspective (relatively high return forecast) in combination with sentiment-fueled 1-year expectations could be an effective combination.

Looking back at the MANIFEST 40 from one year ago — the average 1-year total return forecast was 6.6%. The actual return from our favorite 40 stocks turned out to be 4.7%. (Keep in mind that the “average stock” was down -7%.)

But — for any given stock — as shown in the accompanying chart, it’s really pretty much of a “crap shoot” for one year results. This is not a surprise. We know this as the perpetual dance of the rhinos as short term forecasting is almost always Dremaned.

There is, however, a glimmer of hope. And it comes in the same type of condition that we witness with overall performance of portfolios vs. individual stocks. When gauging performance in groups, accuracy gets better.

In this case, the top six stocks with the best 1-year return expectations back in January 2015 actually delivered a combined performance of 16.7%. See FAST, GE, GOOG, JNJ, MSFT, and TEVA in the chart below.

The stocks with the six weakest 1-year expectations were CSCO, COH, CTSH, PAYX, QSII and WMT. These six combined for a collective result of 0.9%.

How To Read This Chart. This chart displays the actual 1-year total returns for most of the MANIFEST 40 most widely-followed stocks versus their 1-year total return forecast from January 2015. For example, General Electric (GE) had a total return forecast of 20.8%. This is plotted on the x-axis. The point (20.8%, 27.5%) provides the comparison of the 1-year result (27.5%) plotted on the y-axis.

Results, Conclusions and the 2016 Outlook

First and foremost, we’re reminded that these (40) stocks collectively represent a top shelf collection of high-quality companies that rank among the most closely-followed stocks by our subscribers. To me, that means it’s a fertile ground for promising opportunities under the right conditions.

The average 1-year total return forecast for these (40) stocks is 23.5% (1/18/2016). It will be interesting to see if this persists or drifts as the rhinos attempt to focus on the challenges ahead for 2016.

If we’re looking for shopping opportunities, it’s OK to focus on the best long-term return forecasts, for example Apple (AAPL), Buffalo Wild Wings (BWLD), Cognizant Technology (CTSH) and Gilead Sciences (GILD).

Based on the cursory observations made here, I think I’d be inclined to take a closer look at the six companies with the highest 1-year total return forecasts. Yes, I admit that I don’t expect correlation between forecast and actual for any of these flying on their own — but collectively, it’s as compelling as our dashboard-centered foundations. Those six stocks would be:

  • PRA Group (PRAA) — granted, something of a speculation and wrought with “turbulence”
  • Apple (AAPL) — well, just because.
  • Schlumberger (SLB) — because fossil fuels aren’t going away any time soon, sorry …
  • Qualcomm (QCOM) — because the juggernaut may still have some cards up its sleeve
  • LKQ Corp (LKQ) — because new car sales could peak and there’s still a lot of marginally skilled drivers out there.
  • Gilead Sciences (GILD) — because they persist in building solutions and chemistry that improves lives.

The average 1-year total return forecast for these six selections is 48.4%

The six stocks I’d avoid, or subject to a Spanish Inquisition if suggested any time soon, would be: Coca-Cola (KO), Exxon Mobil (XOM), FactSet Research (FDS), Fastenal (FAST), Quality Systems (QSII) and Wal-Mart (WMT). — because among many other factors, the rhinos haven’t forgiven some of these yet. (But it’s probably a temporary condition for most of them.)

With the maturity that embraces simplicity, Press On!

When Irish Cows Are Smiling

This Week at MANIFEST (3/20/2015)

“There is little value in the single cow.” — Irish Proverb

“Any man who owns a cow can always find a woman to milk her.” — Irish Saying

Happy St. Patrick’s Day, Daniella!

After spending last weekend in Chicago with some Badgers, Spartans, Buckeyes and various other varmints, I was reminded that Chicago starts St. Patrick’s Day early with a parade on Saturday. The streets were packed with throngs of green-clad celebrants and we watched as the Chicago River was dyed green in compliance. I’m not sure I understand the difference between an Irish proverb and an Irish saying … or what is the meaning behind the bovine suggestions here. But given a choice, I think every portfolio needs more than one cow to avoid the adverse effects of cow tipping.

Chicago also honors a famous cow with a play every March, “When Irish Cows Are Smiling.” Set in March 1872, five months since the Great Chicago Fire, the MOO-morial service, held at the Diggum, Deepe & Dye Funeral Parlour, pays tribute to Mrs. O’Leary’s cow, Daniella Joy, the infamous firebug.

Companies of Interest: Value Line

The average Value Line low total return forecast for the companies in this week’s update batch is 3.9% — slightly higher than the 3.7% for the Value Line 1700.

Materially Stronger: Gentex (GNTX), Synaptics (SYNA), Drew Industries (DW)

Materially Weaker: Avon Products (AVP), Windstream (WIN), Titan International (TWI), Cincinnati Bell (CBB)

Standard Coverage Initiated: Balchem (BCPC)

Discontinued:

Market Barometer

Value Line Low Total Return (VLLTR) Forecast. The long-term low total return forecast for the 1700 companies featured in the Value Line Investment Survey is 3.7%, up slightly from 3.6% last week. For context, this indicator has ranged from low single digits (when stocks are generally overvalued) to approximately 20% when stocks are in the teeth of bear markets like 2008-2009.

Stocks to Study (3/20/2015)

  • LKQ Corp (LKQ) – Highest MANIFEST Rank (100)
  • Neustar (NSR) – Highest Low Return Forecast (VL)
  • Express Scripts (ESRX) – Lowest P/FV (Morningstar)
  • Neustar (NSR) – Lowest P/FV (S&P)
  • Bioscrip (BIOS) – Best 1-Yr Outlook (ACE)
  • Neustar (NSR) – Best 1-Yr Outlook (S&P)

Breaking News: Rite-Aid (RAD) actually has a financial strength rating (2%). While Value Line maintains its “C” (0%) rating on Rite-Aid, Morningstar checks in with a “C” … and the effective interest rate is still steep at 6.8% but it is better than it was!