Self-Directed Excellence

This Week at MANIFEST (1/24/2020)

“Life is like a snowball, all you need is wet snow and a really long hill.” — Warren Buffett

This past week, we lost a very special charter subscriber to Manifest Investing. My Father. I think his ID number was single digits. He was also a charter member of our Chicago-based investment club, evolved into an investing warrior … and was quite simply, my favorite EAGLE.

A couple of weeks ago I huddled with my father over his monthly ritual of opening his E*Trade envelope. A careful slice of the envelope (he saved every single one of them, every one) and I heard him say some of my favorite words, “My Colgate-Palmolive stock is worth how much? That can’t be right.” A $2000 investment in CL was now worth $28,000. This was typical of many holdings. In fact, the gains in Gentex, Pepsi, and Vanguard Technology (VGT) were actually much bigger.

His experience with General Electric was “different.” He shared his disappointment with GE often.

But he fixated on the steady delivery of Colgate. As the accompanying image shows, the company occupied Mom and Dad’s Christmas tree. We first talked about this long ago, see: When Monsters Are Created. It’s a story about consumer and stakeholder loyalty. This past weekend, I noticed that all of the squeezed toothpaste tubes on the bathroom sinks (including those toted by his grandchildren) were Colgate. He left a mark.

The image of Mom and Dad was captured at an Investor Fair in Springfield, Illinois. Long story short, the Biomet investor relations representative had told Mom and Dad over breakfast that $2000 invested in Biomet circa 1980 was worth $1,000,000 in the late 1990s. It’s a fact. (For more, see Raise A Cup: Million Dollar Moment — April 2012) It’s also potential freedom. Magic and miracles happen when given a chance.

Dad was a magnificently complicated man. He often chided me for complaining about bears and investing. “Not all bears are bad. I give one to your mother every Valentine’s Day. Besides, we loaded up on some pretty good stocks in March 2009 thanks to one of your bears.” Much wisdom.

And, in closing, one of the simplest and 100% effective lessons ever: Lessons From Fathers & Simple Things, Solid Results (Some might note that this may have been the earliest reference to Five Below)

Bottom Line: Dad took his investment club experience back in the 1990s and deployed it with an IRA that was invested in a CD that also happened to be charging $75/year for “custodial service.” We recently calculated that it would have worth approximately $20,000 if left in that paltry “risk free” situation. We moved it to E*Trade and he carefully selected companies like Gentex, Johnson & Johnson, AFLAC, Walgreen/CVS and leaned heavily on Vanguard Technology (VGT) despite his age. His balance grew to be a lot more than $20,000. When we talked about “risk”, I observed that “Dad, you’ve NEVER, EVER, acted your age.” He didn’t think long term investing included the risk they talk about on television and teach in colleges and business schools. He was right.

For so many of the deepest lessons and love imaginable, THANK YOU, DAD.

MANIFEST 40 Updates

  • 23. Pepsi (PEP)
  • 32. Tapestry (TPR)
  • 39. Ulta Beauty (ULTA)
  • 40. Costco Wholesale (COST)

Round Table Stocks

  • Costco Wholesale (COST)
  • Dollar General (DG)
  • Five Below (FIVE)
  • Schwab, Charles (SCHW)
  • Skechers (SKX)
  • TJX Companies (TJX)
  • Tyson Foods (TSN)
  • Ulta Beauty (ULTA)

Best Small Companies (2020 Dashboard)

The status of the 2020 Best Small Companies can be tracked at: https://www.manifestinvesting.com/dashboards/public/best-small-companies-2020

Investing Round Table Sessions (Video Archives)

Investing Topics (Video Archives)

Results, Remarks & References

Companies of Interest: Value Line (1/24/2020)

The median Value Line low total return forecast for the companies in this week’s update batch is 5.5% vs. 4.6% for the Value Line 1700 ($VLE).

Materially Stronger: Wal-Mart (WMT), Aaron’s (AAN), Costco Wholesale (COST), AutoZone (AZO)

Materially Weaker: Conn’s (CONN), Designer Brands (DBI), Children’s Place (PLCE), Fossil (FOSL), Kohl’s (KSS), Ollie’s Bargain (OLLI), Molson Coors (TAP)

Discontinued: Avon Products (AVP), Medicines Co. (MDCO)

Note:

Market Barometers

The thing very few people tell you about “overvalued” markets is that, occasionally, the fundamentals arrive to justify them. — Joshua Brown

Value Line Median Appreciation Projection (VLMAP) Forecast. The long-term median appreciation projection for the 1700 companies featured in the Value Line Investment Survey is 8.8%, a DECREASE from 9.7% last week. For context, this indicator has ranged from low single digits (when stocks are generally overvalued) to approximately 25% when stocks are in the teeth of bear markets like 2008-2009.

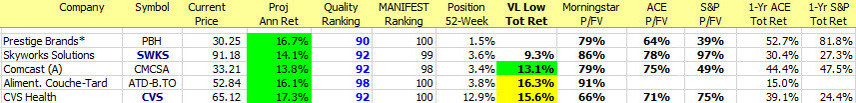
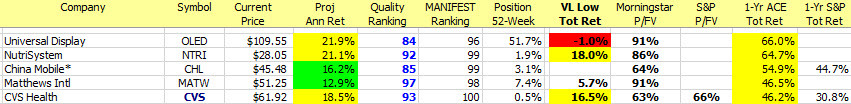
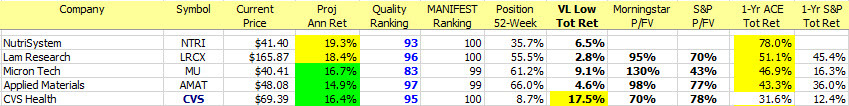
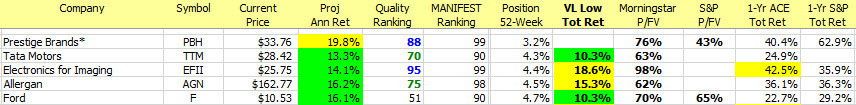
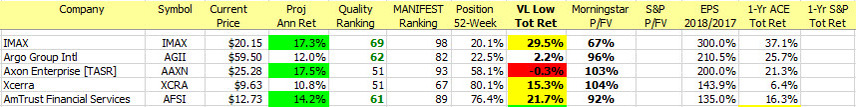
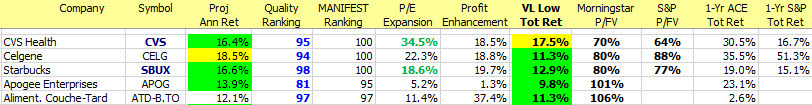
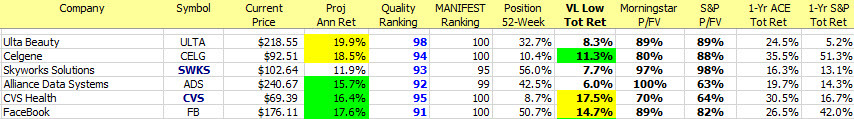
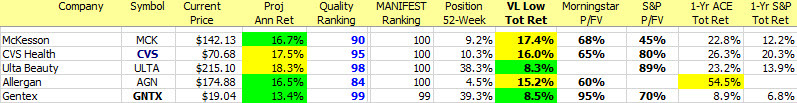
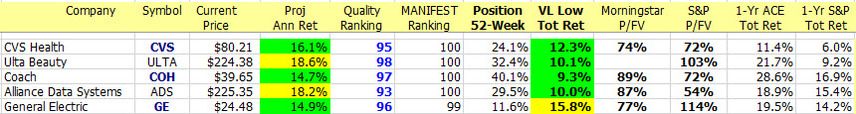
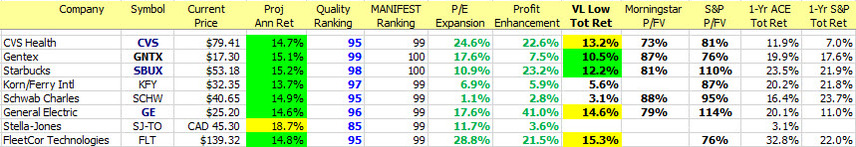
Update Batch: Stocks to Study (1/24/2020)

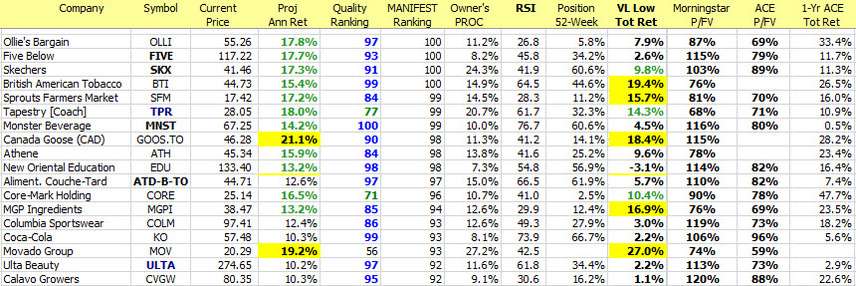
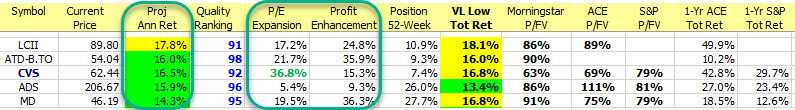
Long & Short Term Perspectives. (January 24, 2020) Proj Ann Return (PAR): Long term return forecast based on fundamental analysis and five year time horizon. Quality: Percentile ranking of composite that includes financial strength, earnings stability and relative growth & profitability. MANIFEST Ranking: Combination ranking that equally weights PAR and Quality. VL Low Tot Ret: Value Line forecast, expressed as low total return forecast. Owner’s PROC: Projected Return on Capital via 5-year EPS forecast versus current capital — equity and debt. Morningstar and ACE and P/FV: Price-to-Fair Value estimates from the (2) sources. 1-Yr ACE Tot Return: One year total return estimates via ACE.

The NEW CVS Health (CVS)

This article is a current example of the type of company analysis Manifest Investing (and our friends) performs on stocks following the time-honored (since 1941) methods of the modern investment club movement.  CVS is the 10th most widely-followed stock by our community of investors and is the 2nd most frequently-selected stock during our monthly FREE webcasts known as our Investing Round Table.  Note: The 9-year annualized rate of return for the stocks featured is 15.5%.  Start a test drive (trial subscription) at http://www.manifestinvesting.com ($79/year, group discounts for club partners and educators) and see the answers to some natural “next” questions including: (1) What about store growth? and (2) How much did Warren Buffett overpay for Heinz and did CVS pay too much for Aetna?

At CVS Health, we share a clear purpose: helping people on their path to better health. Through our health services, plans and community pharmacists, we’re pioneering a bold new approach to total health. Making quality care more affordable, accessible, simple and seamless, to not only help people get well, but help them stay well in body, mind and spirit.

Cy Lynch warned all of us as he selected CVS Health (CVS) again for the February Round Table. CVS now ranks as the 2nd most frequently selected company for the tracking portfolio. Cy’s warnings? (1) You can’t lean on the rear view mirror for this one. The historical data doesn’t include Aetna. (2) The fear and herd-following among the Rhinos has delivered some painful price action. [Note: The Rhinos just could be right.] (3) CVS is undergoing a high risk (general perception) transformation from the current business model to one that seeks to optimize wellness, decrease dependency on pharmaceutical band-aids (!!!) and fight to establish an effective go-to solution that serves customers with a cost effective path to health.

The Wind Is Blowing

Reference: Looking Ahead: 2019 Health Care Trends

Business Model Analysis (Sales)

CVS Health. Pro Forma Sales Projections. As Cy suggested, the company has shifted. The step change in sales due to the addition of Aetna can be seen in 2018. The growth rate (slope of the trend line) from 2010-2017 is visually different from the slope seen for 2018-2023. The former trend (10-12%) no longer applies to a stock study of the new CVS. It’s supporting information for what may be possible — but the growth rate suggested in the SEC filings is 6-7%. (Value Line has a much more pessimistic outlook for the 3-5 year forecast — resulting in a growth forecast of 4.5%)

The profitability forecast (according to CVS and the legions of Rhinos who chimed and rhymed with opinions about the Aetna deal) is available here also. Dividing the net income in 2022 into the the sales forecast, we see (11.6/333.4) = 0.035 = 3.5%

… And Now, The Rest Of The Story

My personal opinion is that it boils down to remembering and realizing that CVS is the company that discontinued the sale of cigarettes a few years ago to a chorus of whining and Armageddon commentary from the Rhinos.

This is massively challenging but a mission with merit. This core holding — at least temporarily — has shifted from blue chip stalwart to execution-based speculation. But it’s a good speculation based on the promises delivered by excellent management over the past several years. The investing jungle is full of doubting Rhinos and the stock price has been mightily challenged, accordingly. That said, the expectations (4% growth, 3.5% profitability, 11.5x average P/E) are the types of low bars that investors like Graham and Buffett have vision cast as stepping over them while others assail the assortment of 7-foot high jump bars with other opportunities.

Imagine them ripping out the chips and candy and recapturing the space with cost-effective access to doctors, physician’s assistants, nurse practitioners and various flavors of therapists and nutritional campaigns. Imagine America taking a few less pills and feeling comprehensively better. CVS ripped out the smoking products. How challenging is it to believe that they just might be serious about the rest of this?

References

Questions?

Contact Mark Robertson via markr@manifestinvesting.com or via Twitter by reaching out to @manifestinvest.  Manifest Investing also maintains a “slipstream blog” at Facebook: https://www.facebook.com/manifestinvesting/  Comments and inquiries welcome.

Fave Five (5/11/2018): Triple Play

Fave Five (5/11/2018)

Our Fave Five essentially represents a listing of stocks with favorable short term total return forecasts (1 year, according to Analyst Consensus Estimates, or ACE) combined with strong long-term return forecasts and good/excellent quality rankings. The median 1-year ACE total return forecast is 14.8%.

This week we return to the triple play screening method for our five favorites. The triple play possibility occurs when you find a stock that is very depressed in price and also appears to be on the verge of substantially boosting its profit margins. The triple play effect is possible in that:

(1) The depressed price of the stock can return to normal levels;

(2) increased profit margins can produce increased EPS and a higher price;

(3) may also cause higher P/E ratios, or P/E expansion.

The Long and Short of This Week’s Fave Five

Long & Short Term Perspectives. (May 11, 2018) Projected Annual Return (PAR): Long term return forecast based on fundamental analysis and five year time horizon. Quality Ranking: Percentile ranking of composite that includes financial strength, earnings stability and relative growth & profitability. 52-Week Position: Position on scale between 52-week low price and 52-week target price. VL Low Total Return (VLLTR): Low total return forecast based on 3-5 year price targets via Value Line Investment Survey. Morningstar P/FV: Ratio of current price to fundamentally-based fair value via www.morningstar.com S&P P/FV: Current price-to-fair value ratio via Standard & Poor’s. 1-Year ACE Outlook: Total return forecast based on analyst consensus estimates for 1-year target price combined with current yield. The data is ranked (descending order) based on this criterion. 1-Year S&P Outlook: 1-year total return forecast based on S&P 1-year price target.

Fave Five Legacy (Tracking Portfolio)

The relative/excess return for the Fave Five tracking portfolio is +2.3% since inception.

The absolute annualized rate of return is 16.7%.

Tracking Dashboard: https://www.manifestinvesting.com/dashboards/public/fave-five

Fave Five: Irish Spring (4/20/2018)

Irish Spring. We could use a bit of that in the upper Midwest. Wisconsin is in triage from all that snow last week. So we’ll turn to a variant of Hugh’s Irish Stew of excellent companies with attractive return forecasts that are trading near their 52-week lows.

Fave Five (4/20/2018)

Our Fave Five essentially represents a listing of stocks with favorable short term total return forecasts (1 year, according to Analyst Consensus Estimates, or ACE) combined with strong long-term return forecasts and good/excellent quality rankings. The average 1-year ACE total return forecast is 13.4%.

Homing In On The Range

One of our Round Table knights, Hugh McManus has a particularly strong track record over the last 7-8 years for our monthly webcast … so we’re obviously interested in better understanding his methods. Hugh McManus likes to shop for opportunities among stocks that are trading near their 52-week lows and for non-core case studies, he’ll sometimes demand that the stock prices be near multi-year lows. Part of the driver behind this is the recognition that there’s often a large difference between 52-week highs and 52-week lows, even for some of the bluer chip established stocks. Isolating opportunities to invest when stocks are in the lower part of those annual ranges would seem to provide a margin of safety and reduce some of the downside … and “all things created equal” why should we shop anywhere else. (Read that in an Irish brogue for full effect.)

Hugh has reminded us in the past that it’s not as simple as a percentage difference between the current price and the 52-week low. As shown here, it’s more of a range. The lower limit is indeed the 52-week low. But the higher limit of the range is a 1-year price target based on projected earnings and P/E ratio — using our assumptions for growth, profitability and long term valuation.

A stock trading near its 52-week low would have a “position-in-range” of 0%.

The Long and Short of This Week’s Fave Five

Long & Short Term Perspectives. (April 20, 2018) Projected Annual Return (PAR): Long term return forecast based on fundamental analysis and five year time horizon. Quality Ranking: Percentile ranking of composite that includes financial strength, earnings stability and relative growth & profitability. 52-Week Position: Position on scale between 52-week low price and 52-week target price. The data is ranked (ascending order) based on this criterion. VL Low Total Return (VLLTR): Low total return forecast based on 3-5 year price targets via Value Line Investment Survey. Morningstar P/FV: Ratio of current price to fundamentally-based fair value via www.morningstar.com S&P P/FV: Current price-to-fair value ratio via Standard & Poor’s. 1-Year ACE Outlook: Total return forecast based on analyst consensus estimates for 1-year target price combined with current yield. 1-Year S&P Outlook: 1-year total return forecast based on S&P 1-year price target.

Fave Five Legacy (Tracking Portfolio)

The relative/excess return for the Fave Five tracking portfolio is +5.1% since inception.

The absolute annualized rate of return is 18.5%.

Tracking Dashboard: https://www.manifestinvesting.com/dashboards/public/fave-five

Fave Five (3/23/2018)

Fave Five (3/23/2018)

Our Fave Five essentially represents a listing of stocks with favorable short term total return forecasts (1 year, according to Analyst Consensus Estimates, or ACE) combined with strong long-term return forecasts and good/excellent quality rankings. The median 1-year ACE total return forecast is 16.2%.

Our five stocks this week hail from the top quintile (top 20%) of all stocks ranked by quality. We then sought the five highest 52-week total return forecasts according to analyst consensus.

NutriSystem (NTRI) rejoins the Fave Five tracking portfolio after a brief hiatus. NTRI was selected back on 11/9/2017 and proceeded to recede more than 20% versus the general stock market, so it was jettisoned about a month ago. With the stock price dropping from $51 to $28, we’ll give it another go — but with a careful watch on the quality rating. Slowing of sales growth with 2017 year-end resembling 2016 is causing some consternation and we’ll keep the company under the microscope with the 4/19/2018 update.

CVS Health (CVS) has appeared frequently in Fave Five results and is featured in a number of portfolios, including its #12 ranking in the MANIFEST 40 most widely-followed companies. CVS was first added to the Fave Five tracking portfolio back in December 2015 … and has been fairly disappointing with a return of (-10.1% annualized) since selection. We also note that CVS Health has been showing up on a number of Triple Play screening results, so we’ll continue to hope that earnings will advance … and that stock price will follow EPS.

The Long and Short of This Week’s Fave Five

Long & Short Term Perspectives. (March 23, 2018) Projected Annual Return (PAR): Long term return forecast based on fundamental analysis and five year time horizon. Quality Ranking: Percentile ranking of composite that includes financial strength, earnings stability and relative growth & profitability. 52-Week Position: Position on scale between 52-week low price and 52-week target price. VL Low Total Return (VLLTR): Low total return forecast based on 3-5 year price targets via Value Line Investment Survey. Morningstar P/FV: Ratio of current price to fundamentally-based fair value via www.morningstar.com S&P P/FV: Current price-to-fair value ratio via Standard & Poor’s. 1-Year ACE Outlook: Total return forecast based on analyst consensus estimates for 1-year target price combined with current yield. The data is ranked (descending order) based on this criterion. 1-Year S&P Outlook: 1-year total return forecast based on S&P 1-year price target.

Fave Five Legacy (Tracking Portfolio)

The relative/excess return for the Fave Five tracking portfolio is +4.7% since inception.

The absolute annualized rate of return is 17.8%.

Tracking Dashboard: https://www.manifestinvesting.com/dashboards/public/fave-five

Fave Five: 2018 GH Edition

Fave Five (2/9/2018)

Our Fave Five essentially represents a listing of stocks with favorable short term total return forecasts (1 year, according to Analyst Consensus Estimates, or ACE) combined with strong long-term return forecasts and good/excellent quality rankings. The median 1-year ACE total return forecast is 14.7%.

By the way, the ferocity of the correction is on full display here, the median 1-year ACE total return was 1.7% just a couple of weeks ago. That reality, the bolstering fundamentals and a relative strength index that is creeping into “oversold territory” are among the reasons that diligent shopping can be pursued.

This week’s Fave Five will be a parade of several of our favorite screens, including the traditional long/short outlook, best in zone, launchpad ready, Triple Play qualified, etc.

Traditional Fave Five: NutriSystems (NTRI)
Best In Zone “Irish Spring”: Prestige Brands (PBH)
Launchpad Worthy?: IMAX (IMAX)
Triple Play Qualifiers: CVS Health (CVS)
Heavy Hogs (2018): ULTA Beauty (ULTA)

The Long and Short of This Week’s Fave Five

Long & Short Term Perspectives. (February 9, 2018) Projected Annual Return (PAR): Long term return forecast based on fundamental analysis and five year time horizon. Quality Ranking: Percentile ranking of composite that includes financial strength, earnings stability and relative growth & profitability. 52-Week Position: Position on scale between 52-week low price and 52-week target price. VL Low Total Return (VLLTR): Low total return forecast based on 3-5 year price targets via Value Line Investment Survey. Morningstar P/FV: Ratio of current price to fundamentally-based fair value via www.morningstar.com S&P P/FV: Current price-to-fair value ratio via Standard & Poor’s. 1-Year ACE Outlook: Total return forecast based on analyst consensus estimates for 1-year target price combined with current yield. The data is ranked (descending order) based on this criterion. 1-Year S&P Outlook: 1-year total return forecast based on S&P 1-year price target.

Best in Zone — “Irish Spring”

Long & Short Term Perspectives. (February 9, 2018) Projected Annual Return (PAR): Long term return forecast based on fundamental analysis and five year time horizon. Quality Ranking: Percentile ranking of composite that includes financial strength, earnings stability and relative growth & profitability. 52-Week Position: Position on scale between 52-week low price and 52-week target price. VL Low Total Return (VLLTR): Low total return forecast based on 3-5 year price targets via Value Line Investment Survey. Morningstar P/FV: Ratio of current price to fundamentally-based fair value via www.morningstar.com S&P P/FV: Current price-to-fair value ratio via Standard & Poor’s. 1-Year ACE Outlook: Total return forecast based on analyst consensus estimates for 1-year target price combined with current yield. The data is ranked (descending order) based on this criterion. 1-Year S&P Outlook: 1-year total return forecast based on S&P 1-year price target.

Launchpad Candidates

Reminder: These are companies exhibiting HUGE 2018 EPS forecasts versus 2017 projected/actual results. This is just a one year condition for this screen. Ideally, a stock with multi-year breakthrough and breakout potential could be discovered. Stocks exhibiting these characteristics have delivering participating clubs and individuals to the Groundhog Winner’s Circle in the past.

Triple Play Qualifiers

This group has decent (out-sized) long term return expectations in combination with the potential for P/E expansion and profitability/margin enhancement.

Heavy Hogs (2018)

These are the consensus selections — the most commonly selected stocks — among the Groundhog Challenge entries for 2018.

Fave Five Legacy (Tracking Portfolio)

The relative/excess return for the Fave Five tracking portfolio is +4.8% since inception.

The absolute annualized rate of return is 18.1%.

Tracking Dashboard: https://www.manifestinvesting.com/dashboards/public/fave-five

Fave Five: Triple Play (11/17/2017)

Fave Five (11/17/2017)

Our Fave Five essentially represents a listing of stocks with favorable short term total return forecasts (1 year, according to Analyst Consensus Estimates, or ACE) combined with strong long-term return forecasts and good/excellent quality rankings. The median 1-year ACE total return forecast is 7.2%.

This week we return to the triple play screening method for our five favorites. The triple play possibility occurs when you find a stock that is very depressed in price and also appears to be on the verge of substantially boosting its profit margins. The triple play effect is possible in that:

(1) The depressed price of the stock can return to normal levels;

(2) increased profit margins can produce increased EPS and a higher price;

(3) may also cause higher P/E ratios, or P/E expansion.

Schlossing About

We continue to leave the 52-week “position”, a factor that combines with 1-year total return for the short term outlook. Walter Schloss loved to find vetted high-quality companies with solid expectations that were trading near the low end of a 52-week range.

This week’s short list has all the usual attributes over the long term, the next year (or short term) and also is expected to grow at double-digit rates, precisely the type of treat that we seek to discover going into the holiday season this year.

The Long and Short of This Week’s Fave Five

Long & Short Term Perspectives. (November 17, 2017) Projected Annual Return (PAR): Long term return forecast based on fundamental analysis and five year time horizon. Quality Ranking: Percentile ranking of composite that includes financial strength, earnings stability and relative growth & profitability. 52-Week Position: Position on scale between 52-week low price and 52-week target price. VL Low Total Return (VLLTR): Low total return forecast based on 3-5 year price targets via Value Line Investment Survey. Morningstar P/FV: Ratio of current price to fundamentally-based fair value via www.morningstar.com S&P P/FV: Current price-to-fair value ratio via Standard & Poor’s. 1-Year ACE Outlook: Total return forecast based on analyst consensus estimates for 1-year target price combined with current yield. The data is ranked (descending order) based on this criterion. 1-Year S&P Outlook: 1-year total return forecast based on S&P 1-year price target.

Fave Five Legacy (Tracking Portfolio)

The relative/excess return for the Fave Five tracking portfolio is +5.3% since inception.

The absolute annualized rate of return is 20.6%.

Tracking Dashboard: https://www.manifestinvesting.com/dashboards/public/fave-five

Fave Five (9/29/2017)

Fave Five (9/29/2017)

Our Fave Five essentially represents a listing of stocks with favorable short term total return forecasts (1 year, according to Analyst Consensus Estimates, or ACE) combined with strong long-term return forecasts and good/excellent quality rankings. The median 1-year ACE total return forecast is 11.1%.

This week we return to the triple play screening method for our five favorites. The triple play possibility occurs when you find a stock that is very depressed in price and also appears to be on the verge of substantially boosting its profit margins. The triple play effect is possible in that:

(1) The depressed price of the stock can return to normal levels;

(2) increased profit margins can produce increased EPS and a higher price;

(3) may also cause higher P/E ratios, or P/E expansion.

The Fave Five This Week

  • Alliance Data Systems (ADS)
  • Coach (COH)
  • CVS Health (CVS)
  • General Electric (GE)
  • Ulta Beauty (ULTA)

The Long and Short of This Week’s Fave Five

The Long & Short. (September 29, 2017) Projected Annual Return (PAR): Long term return forecast based on fundamental analysis and five year time horizon. Quality Ranking: Percentile ranking of composite that includes financial strength, earnings stability and relative growth & profitability. VL Low Total Return (VLLTR): Low total return forecast based on 3-5 year price targets via Value Line Investment Survey. Morningstar P/FV: Ratio of current price to fundamentally-based fair value via www.morningstar.com S&P P/FV: Current price-to-fair value ratio via Standard & Poor’s. 1-Year ACE Outlook: Total return forecast based on analyst consensus estimates for 1-year target price combined with current yield. The data is ranked (descending order) based on this criterion. 1-Year S&P Outlook: 1-year total return forecast based on S&P 1-year price target.

Fave Five Legacy (Tracking Portfolio)

The rate of return for the tracking portfolio is 21.6% since inception.

The relative/excess return for the Fave Five tracking portfolio is +6.1% since inception.

Tracking Dashboard: https://www.manifestinvesting.com/dashboards/public/fave-five

Be Careful Out There

This Week at MANIFEST (9/15/2017)

Tell me and I forget. Teach me and I remember. Involve me and I learn. — Ben Franklin

Be careful out there. — Phil Esterhaus, Hill Street Blues

“Historically, September is the worst month for U.S. stock market performance,” wrote Minerd. “Since 1929, the S&P Composite Index has averaged -1.1 percent for September, making it one of only three months with negative average returns over that time. The worst performing single month over this time period was September 1931, when the S&P composite fell 30 percent.” — Scott Minerd, Guggenheim Partners

Call it the Pre-January Effect if you’d like. It’s particularly relevant and pertinent for the smaller, faster-growing companies this time of year. With the January Effect, we benefit from reallocation and tax-related selling by investing in smaller companies that have been unduly punished during the fourth quarter with the hopes that repurchase and first quarter purchasing will restore many of the damaged prices.

The key word is “unduly.” And in the words of George Nicholson (via the 1984 NAIC Investors Manual) and Hill Street Blues Sergeant of the morning watch, Phil Esterhaus, “Be careful out there.”

Nicholson’s stark warning appears on page 98 of the 1984 Manual.

The guidance is offered in the context of his “Challenge”, a switching consideration that is intended to improve the overall portfolio by selling a holding and replacing it with a suitable, bolstering, substitute.

“When you begin this Challenge, the most important rule is requiring that the challenger (or replacement stock) is of equal or higher quality.” [His emphasis added, NOT mine.]

The accompany chart of screening results is from the Value Line Investment Analyzer. As shown, the listing is sorted by Projected 3-5 Year Total Return (Descending.) Needless to say, these return forecasts are red hot.

We draw your attention to the Financial Strength column where many of the companies are C, C+, etc. Remember, a “C” rating from Value Line is equivalent to an “F” from your school days. The ratings don’t get any lower than “C”. You have to reach for at least a “B++” to get above average.

We also note that many of these companies have stock prices less than $10. It’s one piece of the puzzle, but worthy of a yellow flag and caution.

And finally, check out the growth column. There’s not a whole lot of growth here. In the words of David L. Babson, growth conveys “grace” to long-term investors often healing wounds and compensating for buying a good stock at a price where you should have waited. So there’s not a lot of grace in this group … either.

Turnout Terraforming

As a reminder, the monthly Round Table webcasts will continue and not be disrupted by these new Tuesday sessions.

That said, we’ve heard from a number of you that you’d be interested in seeing us tackle some subjects, topics and methods independent of the Round Table sessions. So we will.

Tuesday seems to be a fairly optimum time to schedule additional sessions although we’ll likely have a few “Turnouts” on other days of the week.

We’d like to hear from you. (markr@manifestinvesting.com) What’s on your mind? What topics would you like to see covered? Here are some that have been suggested or considered so far:

  • Getting Risk Right (Cy Lynch)
  • Lessons From The Legends (Hugh McManus)
  • How Can We Calculate Relative Return?
  • Are Quality and Moats Related?
  • What Should Our Investment Club Meetings Look Like?

MANIFEST 40 Updates

  • 9. Cisco Systems (CSCO)
  • 11. Walgreen (WBA)
  • 12. Qualcomm (QCOM)
  • 26. CVS Health (CVS)
  • 28. LKQ (LKQ)

Round Table Stocks

  • Cisco Systems (CSCO)
  • CVS Health (CVS)
  • Gentex (GNTX)
  • LCI Industries (LCII)
  • LKQ (LKQ)
  • Qualcomm (QCOM)

Round Table Sessions (Video Archives)

Best Small Companies

  • 14. Gentherm (THRM)

Results, Remarks & References

Companies of Interest: Value Line (9/15/2017)

The average Value Line low total return forecast for the companies in this week’s update batch is 5.6% vs. 3.7% for the Value Line 1700 ($VLE).

Materially Stronger: Estee Lauder (EL), Modine Manufacturing (MOD)

Materially Weaker: Acacia Communications (ACIA), Synaptics (SYNA), Qualcomm (QCOM), Rite Aid (RAD), Harmonic (HLIT), BT Group (BT), Genuine Parts (GPC), Walgreen (WBA), CenturyLink (CTL), Commscope (COMM), Avon Products (AVP), Pharmerica (PMC), Infinera (INFN), ATN International (ATNI), Dish Network (DISH)

Discontinued: NeuStar (NSR), Reynolds American (RAI)

Market Barometers

Value Line Low Total Return (VLLTR) Forecast. The long-term low total return forecast for the 1700 companies featured in the Value Line Investment Survey is 3.7%, an increase from 3.5% last week. For context, this indicator has ranged from low single digits (when stocks are generally overvalued) to approximately 20% when stocks are in the teeth of bear markets like 2008-2009.

Update Batch: Stocks to Study (9/15/2017)

The average return forecast (PAR) for this week’s update batch is 9.0%.

The Long & Short. (September 15, 2017) Projected Annual Return (PAR): Long term return forecast based on fundamental analysis and five year time horizon. Quality Ranking: Percentile ranking of composite that includes financial strength, earnings stability and relative growth & profitability. VL Low Total Return (VLLTR): Low total return forecast based on 3-5 year price targets via Value Line Investment Survey. Morningstar P/FV: Ratio of current price to fundamentally-based fair value via www.morningstar.com S&P P/FV: Current price-to-fair value ratio via Standard & Poor’s. 1-Year ACE Outlook: Total return forecast based on analyst consensus estimates for 1-year target price combined with current yield. 1-Year S&P Outlook: 1-year total return forecast based on S&P 1-year price target.

Fave Five: Triple Play (8/11/2017)

Fave Five (8/11/2017)

Our Fave Five essentially represents a listing of stocks with favorable short term total return forecasts (1 year, according to Analyst Consensus Estimates, or ACE) combined with strong long-term return forecasts and good/excellent quality rankings. The average 1-year ACE total return forecast is 8.7%.

This week we return to the triple play screening method for our five favorites. The triple play possibility occurs when you find a stock that is very depressed in price and also appears to be on the verge of substantially boosting its profit margins. The triple play effect is possible in that:

(1) The depressed price of the stock can return to normal levels;

(2) increased profit margins can produce increased EPS and a higher price;

(3) may also cause higher P/E ratios, or P/E expansion.

The Fave Five This Week

  • CVS Health (CVS)
  • Gentex (GNTX)
  • Korn Ferry (KFY)
  • Schwab (SCHW)
  • Starbucks (SBUX)

The Long and Short of This Week’s Fave Five

The Long & Short. (August 11, 2017) Projected Annual Return (PAR): Long term return forecast based on fundamental analysis and five year time horizon. Quality Ranking: Percentile ranking of composite that includes financial strength, earnings stability and relative growth & profitability. VL Low Total Return (VLLTR): Low total return forecast based on 3-5 year price targets via Value Line Investment Survey. Morningstar P/FV: Ratio of current price to fundamentally-based fair value via www.morningstar.com S&P P/FV: Current price-to-fair value ratio via Standard & Poor’s. 1-Year ACE Outlook: Total return forecast based on analyst consensus estimates for 1-year target price combined with current yield. The data is ranked (descending order) based on this criterion. 1-Year S&P Outlook: 1-year total return forecast based on S&P 1-year price target.

Fave Five Legacy (Tracking Portfolio)

The rate of return for the tracking portfolio is 14.5% since inception.

The relative/excess return for the Fave Five tracking portfolio is +1.7% since inception.

Tracking Dashboard: https://www.manifestinvesting.com/dashboards/public/fave-five