Fave Five (2/24/2017)

Fave Five (2/24/2017)

Our Fave Five essentially represents a listing of stocks with favorable short term total return forecasts (1 year, according to Analyst Consensus Estimates, or ACE) combined with strong long-term return forecasts and good/excellent quality rankings. The average 1-year ACE total return forecast is 6.9%.

We usually limit the search results to good or excellent quality stocks, but we occasionally remove the shackles. We do it less often when return forecasts are near historical lows … but nonetheless, this “bottom fishing” gives us some positions to monitor that we’d not normally explore. And we get to see how they do in the tracking portfolio. With the overall weighted-average quality high enough, we can tolerate some “adventure” in the overall jigsaw puzzle.

And lest you think we’ve lost our bearings, we still insist on a quality ranking in at least the 50th percentile. (We would probably go lower if return forecasts were higher.)

The Fave Five This Week

  • Cherokee (CHKE)
  • Medallion Financial (MFIN)
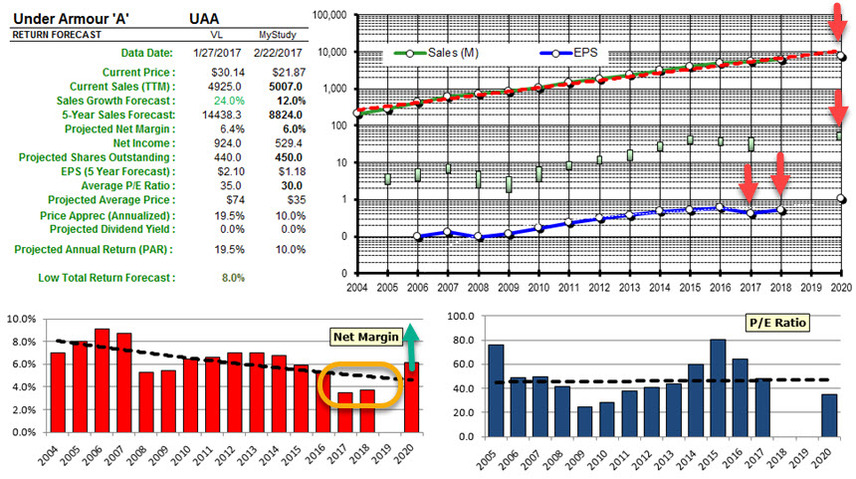
  • Opko Health (OPK)
  • SouFun (SFUN)
  • Synchronoss Technology (SNCR)

The Long and Short of This Week’s Fave Five

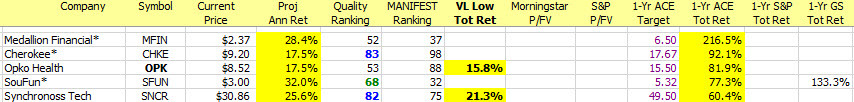
The Long & Short. (February 24, 2017) Projected Annual Return (PAR): Long term return forecast based on fundamental analysis and five year time horizon. Quality Ranking: Percentile ranking of composite that includes financial strength, earnings stability and relative growth & profitability. VL Low Total Return (VLLTR): Low total return forecast based on 3-5 year price targets via Value Line Investment Survey. Morningstar P/FV: Ratio of current price to fundamentally-based fair value via www.morningstar.com S&P P/FV: Current price-to-fair value ratio via Standard & Poor’s. 1-Year ACE Outlook: Total return forecast based on analyst consensus estimates for 1-year target price combined with current yield. The data is ranked (descending order) based on this criterion. 1-Year S&P Outlook: 1-year total return forecast based on S&P 1-year price target. 1-Yr GS: 1-year total return forecast based on most recent price target issued by Goldman Sachs.

Fave Five Legacy (Tracking Portfolio)

The relative/excess return for the Fave Five tracking portfolio is +0.3% since inception. 53.1% of selections have outperformed the Wilshire 5000 since original selection.

Tracking Dashboard: https://www.manifestinvesting.com/dashboards/public/fave-five

Wicking, Tennis Shoes & Speed Bumps

This is a sample stock analysis, the type of feature that we regularly share with subscribers at http://www.manifestinvesting.com  Stocks selected during our FREE/public monthly webcasts known as our Round Table have outperformed the market (Wilshire 5000) for over 5 years.  FREE test drives and trial subscriptions available.

For more information: markr@manifestinvesting.com

Under Armour (UAA)

Subscribers may remember our explorations and discussions inspired by Charles Carlson about the avoidance of being “stubborn” in investing. (See Rules of Engagement , December 2008) His Rule #8 was “Have the Courage to Act on Your Conviction, BUT, Do Not Confuse Conviction with Stubbornness.” We might also remind ourselves about the conviction displayed by David Gardner and his exemplary performance for the Motley Fool Stock Advisor newsletter. (First Break The Rules , April 2016) His mettle was definitely tested with Amazon, Netflix and others while remaining steadfast on the path to exceptional returns. Which brings us to one of the Motley Fool Faves … and our May 2016 selection of Under Armour.

Under Armour was selected for this feature nearly a year ago. The stock price has dropped approximately 42% since then — while the general market has been “en fuego.”

Apparel retail is never easy. Entering the competitive fray with the likes of Nike and Adidas to deliver shoes could definitely be characterized as kicking sand on an 800-lb gorilla or two.

On top of that, a confusing whirlwind of ticker changes and voting rights “innovation” lead to a confusing and uncertain impression that scatters the institutional investors like screaming “Fire!” in a movie theater.

The ultimate result is the price swoon shown in the accompanying figure.

Growth, Profitability, Valuation

The Manifest Investing sales growth forecast for UAA is 11.2%. Value Line has a 3-5 year sales growth forecast of 24%. Morningstar sees growth in the 11-12% for 2017, a “sharp deceleration” from 22% in 2016. S&P still sees 18% earnings growth going forward.

We’re using 6.7% for the projected net margin. The average net margin has been 6.3% for the period 2009-2016. Value Line has a 3-5 year projected net margin of 12.7%. Under Armour is clearly in the throes of a life cycle profitability speed bump.

The median P/E for the period 2009-2017 is 43.2×. Value Line has a projected average P/E of 35.0×. We’re using approximately 30x for the projected average P/E.

At the time of selection (2/7/2017), the stock price is $20.47, the projected annual return is 11-12%. The quality RANKING is 95 (Excellent) and the financial strength rating is 91 (A+).

Points of View

On 1/31/2017, Value Line reduced expectations for revenue growth and EPS for 2017. The company also announced the departure of the CFO — another log on the uncertainty fire when it comes to the institutions. Value Line continues to advise “all but the most aggressive investors to look elsewhere … for a company already facing multiple headwinds.”

We mentioned David Gardner and his loyalty to some of his more turbulent selections over the years. As we noted in the article, many of his best performers encountered extreme speed bumps. And it was his brother, Tom Gardner, who selected Under Armour on 9/20/2013 at $19.47.

Our experience has been that speed bumps are inevitable during the life of all companies, even the bluest chips. One often occurs after the expiration of the IPO restricted period. A second often occurs after emerging into consistent positive profitability and I think we’re seeing this here. We’ll take a look at a 45-year analysis of Nike to illustrate and make mettle testing manifest.

A Few Moments With Life Cycles, Courtesy of Nike (NKE)

I’m not sure why I hadn’t done this yet. We did take a 20-year look at CSX (CSX) a while ago to examine long cycles. But this is for a different reason. I remember a 30-year Stock Selection Guide article that was contributed to the Better Investing BITS newsletter by Diane Graese many years ago. In the article, Diane shared a very long term perspective on Dana Corporation, complete with all of its cyclical warts and wrinkles. It’s time to go back.

You can’t do this (meaningfully and with as much relevance) for companies that have a lot of M&A activity in their history.

But in this case, Nike is relatively clean in this regard. Although it has evolved, Nike has been basically the same company with a fairly steady capital structure and product portfolio for many years.

Nike (NKE): Business Model Analysis (1984-2020). Sales growth has been fairly steady for an apparel retailer over the years, checking in at low double digits since inception. The sales growth trend and forecast for 2004-2018 is closer to 8%. The emergent EPS point is clearly shown for the company in the mid-1980s. Stock price? Stock price follows earnings. Rinse. Repeat. Nike shareholders are smiling and wouldn’t be surprised to be owned by Berkshire Hathaway some time soon with a chart like this.

Nike (NKE): Profitability as measured by Net Margin (1984-2020). This is a powerful long term trend. The moment that we notice — that I believe has context with respect to Under Armour — is the 1998 downdraft in profitability. Global recessionary pressures at the time, in combination with diminishing returns from Peak Air Jordan, came together in a perfect storm that resulted in some optimization, investment in infrastructure and product portfolio shuffling. The result was a “speed bump” in earnings that impacted stock price and generated something of a stock price plateau for a few years. But persistent year-after-year gains in profitability and earnings wears down the most steadfast rhino over time. This chart, as part of our Management Report Card for any company, is exemplary when it comes to Nike.

Nike (NKE): Valuation (1984-2020). The P/E ratio languished during the early years (1984-1988) until the EPS stabilized “north” of 0%. Nike never saw the types of P/E ratios that a company like Under Armour has exhibited — but a P/E ratio in the high teens is fairly easily defended. The P/E ratio trend will often track on a trajectory similar to the profitability and that seems to be the case with Nike.

Update on Under Armour

Under Armour (UAA): Update. Growth expectations have been slashed for 2017 and perhaps, 2018. The impact on 2017, 2018 and the 3-5 year forecast has been reflected here.

Bottom line? I really do believe that Under Armour is going through the same type of speed bump experienced by Nike at the 10-15 year mark. Kevin Plank has aggressively grown the company, the products are outstanding and the customers are loyal.

Under the reduced expectations discussed by Value Line (1/31/2017) the return forecast is now low double digits. But with the average stock at 5-6% and the prospect (long term) of beating the sales and profitability expectations — even while the average P/E ratio moderates — this could be rewarding for the most adventuresome out there with appropriate time horizons.

Fave Five (2/17/2017)

Fave Five (2/17/2017)

Our Fave Five essentially represents a listing of stocks with favorable short term total return forecasts (1 year, according to Analyst Consensus Estimates, or ACE) combined with strong long-term return forecasts and good/excellent quality rankings. The average 1-year ACE total return forecast is 6.8%.

It’s interesting that these five are essentially uncovered by S&P with respect to price targets (long and short). All five stocks are already in the tracking portfolio.

The Fave Five This Week

  • BT Group (BT)
  • Gildan Activewear (GIL)
  • Jazz Pharma (JAZZ)
  • Silicon Motion Technology (SIMO)
  • STERIS (STE)

The Long and Short of This Week’s Fave Five

The Long & Short. (February 17, 2017) Projected Annual Return (PAR): Long term return forecast based on fundamental analysis and five year time horizon. Quality Ranking: Percentile ranking of composite that includes financial strength, earnings stability and relative growth & profitability. VL Low Total Return (VLLTR): Low total return forecast based on 3-5 year price targets via Value Line Investment Survey. Morningstar P/FV: Ratio of current price to fundamentally-based fair value via www.morningstar.com S&P P/FV: Current price-to-fair value ratio via Standard & Poor’s. 1-Year ACE Outlook: Total return forecast based on analyst consensus estimates for 1-year target price combined with current yield. The data is ranked (descending order) based on this criterion. 1-Year S&P Outlook: 1-year total return forecast based on S&P 1-year price target. 1-Yr GS: 1-year total return forecast based on most recent price target issued by Goldman Sachs.

Fave Five Legacy (Tracking Portfolio)

The relative/excess return for the Fave Five tracking portfolio is +1.8% since inception. 48.4% of selections have outperformed the Wilshire 5000 since original selection.

Tracking Dashboard: https://www.manifestinvesting.com/dashboards/public/fave-five

Fave Five (2/10/2017)

Fave Five (2/10/2017)

Our Fave Five essentially represents a listing of stocks with favorable short term total return forecasts (1 year, according to Analyst Consensus Estimates, or ACE) combined with strong long-term return forecasts and good/excellent quality rankings. The average 1-year ACE total return forecast is 6.8%.

The Fave Five This Week

  • BT Group (BT)
  • Gildan Activewear (GIL)
  • Jazz Pharma (JAZZ)
  • QUALCOMM (QCOM)
  • Silicon Motion Technology (SIMO)

The Long and Short of This Week’s Fave Five

The Long & Short. (February 10, 2017) Projected Annual Return (PAR): Long term return forecast based on fundamental analysis and five year time horizon. Quality Ranking: Percentile ranking of composite that includes financial strength, earnings stability and relative growth & profitability. VL Low Total Return (VLLTR): Low total return forecast based on 3-5 year price targets via Value Line Investment Survey. Morningstar P/FV: Ratio of current price to fundamentally-based fair value via www.morningstar.com S&P P/FV: Current price-to-fair value ratio via Standard & Poor’s. 1-Year ACE Outlook: Total return forecast based on analyst consensus estimates for 1-year target price combined with current yield. The data is ranked (descending order) based on this criterion. 1-Year S&P Outlook: 1-year total return forecast based on S&P 1-year price target. 1-Yr GS: 1-year total return forecast based on most recent price target issued by Goldman Sachs.

Fave Five Legacy (Tracking Portfolio)

The relative/excess return for the Fave Five tracking portfolio is +1.9% since inception. 50.2% of selections have outperformed the Wilshire 5000 since original selection.

Tracking Dashboard: https://www.manifestinvesting.com/dashboards/public/fave-five

Fave Five (2/3/2017)

Fave Five (2/3/2017)

Our Fave Five essentially represents a listing of stocks with favorable short term total return forecasts (1 year, according to Analyst Consensus Estimates, or ACE) combined with strong long-term return forecasts and good/excellent quality rankings. The average 1-year ACE total return forecast is 8.0%.

For more information on joining our 11th annual Groundhog Challenge, launching 2/2/2017, as either a group or an individual investor, drop a note to markr@manifestinvesting.com.

The Fave Five This Week

  • Gildan Activewear (GIL)
  • Jazz Pharma (JAZZ)
  • QUALCOMM (QCOM)
  • Silicon Motion Technology (SIMO)
  • Transdigm Group (TDG)

The Long and Short of This Week’s Fave Five

The Long & Short. (February 3, 2017) Projected Annual Return (PAR): Long term return forecast based on fundamental analysis and five year time horizon. Quality Ranking: Percentile ranking of composite that includes financial strength, earnings stability and relative growth & profitability. VL Low Total Return (VLLTR): Low total return forecast based on 3-5 year price targets via Value Line Investment Survey. Morningstar P/FV: Ratio of current price to fundamentally-based fair value via www.morningstar.com S&P P/FV: Current price-to-fair value ratio via Standard & Poor’s. 1-Year ACE Outlook: Total return forecast based on analyst consensus estimates for 1-year target price combined with current yield. The data is ranked (descending order) based on this criterion. 1-Year S&P Outlook: 1-year total return forecast based on S&P 1-year price target. 1-Yr GS: 1-year total return forecast based on most recent price target issued by Goldman Sachs.

Fave Five Legacy (Tracking Portfolio)

The relative/excess return for the Fave Five tracking portfolio is +3.0% since inception. 46.4% of selections have outperformed the Wilshire 5000 since original selection.

Tracking Dashboard: https://www.manifestinvesting.com/dashboards/public/fave-five

Groundhog Challenge XI (2017)

At Manifest Investing, we’ve held a stock selection challenge for the last ten years. Participants are encouraged to choose 5-20 stocks for a static portfolio, much in the spirit of Crossing Wall Street’s Eddy Elfenbein.  Where you might expect some “gun slinging” and swinging for the fences, the combatants are actually well-behaved and carefully deploy a long term perspective with a dash of speculation and adventure.  The overall performance has often topped market averages and lessons have been extracted.  If you would like to participate with this year’s field, send stock picks to markr@manifestinvesting.com or join the league at http://wallstreetsurvivor.com/league/GroundhogChallenge2017

Groundhog Challenge XI (2017)

We hold certain truths to be self-evident.

That most of us like to sleep at night.

That most of us believe in Occam’s Razor.

That “patience is genius in disguise.” — Hugh McManus

Most of us marvel at the performance of a relatively-passive model portfolio like our Bare Naked Million

We also pay homage to a few selected Rhinos. (Past winners have included Eddy Elfenbein, Abby Jo Cohen (Goldman Sachs), David Einhorn and Warren Buffett.) Some are included just for fun … it’s like playing against the “house.” #BeatJimCramer

Therefore, we’ll keep it simple (again) for Groundhog XI (2017) but with a slight experimental twist and invitation.

1. Enter by selecting a minimum of five (5) investments and a maximum of twenty (20) positions.

2. Participants will receive $1,000,000 in Groundhog dollars. The cool million will be divided evenly across the number of positions you decide to use. In other words, if you pick (5) stocks … we’ll divide the $1,000,000 evenly, creating a public dashboard with $200,000 each. If you submit (8) stocks, it’s $125,000 each.

3. Participants may submit entries as individuals and/or group (clubs).

4. No transactions will be permitted between February 2, 2017 and February 2, 2018 — for the MI/Forum-based version of the Groundhog Challenge. (See actively managed virtual portfolio alternative below.)

5. Entries can be made all weekend and will be accepted until the market opens on Tuesday, February 7 at 9:30 AM ET.

Entries can be submitted by emailing markr@manifestinvesting.com or by posting here in the Groundhog Challenge forum folder.

6. Stocks under $1 not permitted.

This is a total return contest — the influence of dividends is accounted for.

New For 2017

We have been invited by www.wallstreetsurvivor.com to host a stock contest using their virtual portfolio. Groundhoggers may make their “static” entry in the traditional field kept by Manifest Investing and also enter and maintain a challenger at Wall Street Survivor. I plan to have an entry on both platforms,

Where: www.wallstreetsurvivor.com/league/GroundhogChallenge2017

What: Create an account. Locate the Groundhog Challenge “league”. You will receive $1,000,000 on Groundhog Day (Thursday, Feb 2) and can make your own transactions all year long.

Why: It’s an opportunity to test “passive” vs. “active” for some. For others, experiment with options, short selling and other “non-core” tactics.

Who: The few. The proud. The brave. Bring your best ideas — club and individuals.

There will be transaction costs for the Survivor league. More activity would be more expensive.

A Better Conspiracy

This Week at MANIFEST (1/27/2017)

A financial advisor I know describes the reality of investing money by saying, “Hope for the best and be prepared for the worst.” With almost every decision we make in life there is uncertainty about the outcome. Close. But my preference would be for “[Prepare With] the BEST to be prepared for the worst.” That’s a pretty good nutshell for quality-driven growth investing — WITH YOUR FRIENDS.

Better Conspiracy

One of the more powerful — and enabling — things that we do as a community is DISCOVER and share ideas that have the potential for better returns. Better returns enable better futures. These futures are often very altruistic and philanthropic and I love the generosity I’ve witnessed over the last few decades working with so many of you.

A new acquaintance recently asked me what I do. I thought for a moment and responded, “I conspire.” His eyebrows lifted and I continued, “I conspire with a community of successful long-term investors to experience (and share) the rewards of long-term investing with those who seek it.” “I conspire to reinforce patience and discipline where necessary because this journey is often challenging.” “Our cornerstone is over seven decades of doing this, learning from and leaning on each other, to pursue the methods and deploy them among friends and family.” “I conspire.” “Because there are legions of doubters who would tell us that this is not possible, too risky … and not worth the effort.” “I conspire.” “Because I know this is often false (or ignorant) and yes, I understand uncertainty and the reality that there are no guarantees” “But I’ve seen the contrary results from ordinary people displaying patience and deploying extraordinary discipline.”

“I conspire.” “Because WE CAN BEAT THE MARKET and experience successful investing.”

We’ll show you how to soar with turtles.

MANIFEST 40 Updates

  • 20. Coach (COH))
  • 38. Wal-Mart (WMT)
  • 40. Costco Wholesale (COST)

Round Table Stocks

  • Coach (COH)
  • Costco Wholesale (COST)
  • Dollar Tree Stores (DLTR)
  • Fossil (FOSL)
  • Hibbett Sporting Goods (HIBB)
  • Michael Kors (KORS)
  • Pricesmart (PSMT)
  • Ulta Salons (ULTA)
  • Vera Bradley (VRA)

Best Small Companies

  • 9. Five Below (FIVE)
  • 20. Francesca’s (FRAN)
  • 24. IMAX (IMAX)
  • 25. Nautilus (NLS)

Results, Remarks & References

Companies of Interest: Value Line (1/27/2017)

The average Value Line low total return forecast for the companies in this week’s update batch is 7.7% vs. 3.3% for the Value Line 1700 ($VLE).

Materially Stronger: J.C. Penney (JCP), Insight Enterprises (NSIT)
,
Materially Weaker: Abercrombie (ANF), Fossil (FOSL), Vera Bradley (VRA), G-III Apparel Group (GIII), Hertz Global (HTZ), Michael Kors (KORS), DSW (DSW), Finish Line (FINL), Sempra Energy (SRE)

Discontinued: Netsuite (N)

Market Barometers

Value Line Low Total Return (VLLTR) Forecast. The long-term low total return forecast for the 1700 companies featured in the Value Line Investment Survey is 3.3%, unchanged from 3.3% last week. For context, this indicator has ranged from low single digits (when stocks are generally overvalued) to approximately 20% when stocks are in the teeth of bear markets like 2008-2009.

Stocks to Study (1/27/2017)

Gone shopping. A few favorites bubbling near the top of the study list …

The Long & Short. (January 27, 2017) Projected Annual Return (PAR): Long term return forecast based on fundamental analysis and five year time horizon. Quality Ranking: Percentile ranking of composite that includes financial strength, earnings stability and relative growth & profitability. VL Low Total Return (VLLTR): Low total return forecast based on 3-5 year price targets via Value Line Investment Survey. Morningstar P/FV: Ratio of current price to fundamentally-based fair value via www.morningstar.com S&P P/FV: Current price-to-fair value ratio via Standard & Poor’s. 1-Year ACE Outlook: Total return forecast based on analyst consensus estimates for 1-year target price combined with current yield. The data is ranked (descending order) based on this criterion. 1-Year S&P Outlook: 1-year total return forecast based on S&P 1-year price target. 1-Yr “GS” Outlook: 1-year total return forecast based on most recent price target issued by Goldman Sachs.