Fave Five (1/27/2017)

Fave Five (1/27/2017)

Our Fave Five generally represents a listing of stocks with favorable short term total return forecasts (1 year, according to Analyst Consensus Estimates, or ACE) combined with strong long-term return forecasts and good/excellent quality rankings. The median 1-year ACE total return forecast is 7.9%.

This week we spend a few moments with John Kimmel of Wichita, Kansas. John is currently the front runner in the individual category with a +67% return — as a co-conspirator with his Long-Term Investment Club colleagues — and in the institutional category for his Brookfield Digest newsletter.

This domination of the Groundhog field is unprecedented.

In his words: I think biotech should recover further into the year if President Trump and Congress are not too unfavorable. Maybe the worst is priced in. Haven’t bought Jazz Pharma (JAZZ) or Under Armour (UAA) but the numbers look good enough I want to get my clubs to study for possible purchase. My “bench” which I own are Air Lease (AL), Cognizant Technology (CTSH), FaceBook (FB), LKQ Corp. (LKQ), & Opko Health (OPK). [John’s club was one of the clubs that shared the “light” when it came to Bio-Reference Labs and decided to hold OPK after the transaction.] Another six are speculative, some of which have the possibility of maybe pulling off an FCX. One can hope.

As a reminder of what FCX has done over the last year:

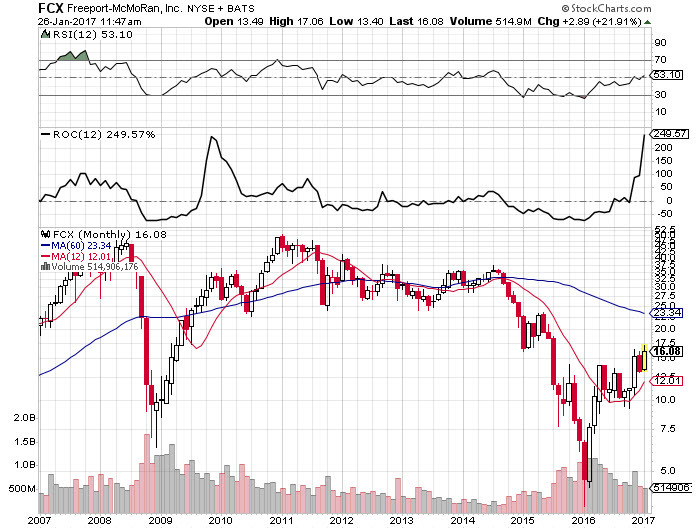
Yes, Virginia, that’s a 250% gain. John and his colleagues selected different portfolios for all three categories in this year’s contest and every single selection has positive gains with the vast majority beating the market.

For more information on joining our 11th annual Groundhog Challenge, launching 2/2/2017, as either a group or an individual investor, drop a note to markr@manifestinvesting.com.

The Fave Five This Week

  • Biogen (BIIB)
  • Celgene (CELG)
  • Five Below (FIVE)
  • Jazz Pharma (JAZZ)
  • Under Armour (UAA)

The Long and Short of This Week’s Fave Five

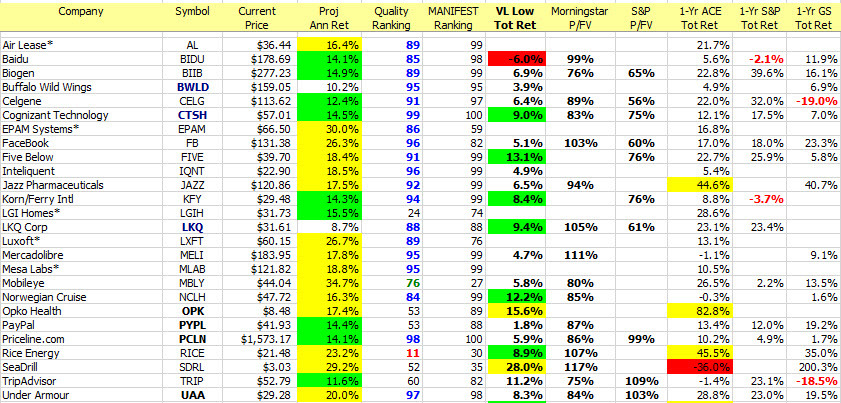
The Long & Short. (January 27, 2017) Projected Annual Return (PAR): Long term return forecast based on fundamental analysis and five year time horizon. Quality Ranking: Percentile ranking of composite that includes financial strength, earnings stability and relative growth & profitability. VL Low Total Return (VLLTR): Low total return forecast based on 3-5 year price targets via Value Line Investment Survey. Morningstar P/FV: Ratio of current price to fundamentally-based fair value via www.morningstar.com S&P P/FV: Current price-to-fair value ratio via Standard & Poor’s. 1-Year ACE Outlook: Total return forecast based on analyst consensus estimates for 1-year target price combined with current yield. The data is ranked (descending order) based on this criterion. 1-Year S&P Outlook: 1-year total return forecast based on S&P 1-year price target. 1-Yr GS: 1-year total return forecast based on most recent price target issued by Goldman Sachs.

Fave Five Legacy (Tracking Portfolio)

The relative/excess return for the Fave Five tracking portfolio is +4.4% since inception. 48.9% of selections have outperformed the Wilshire 5000 since original selection.

Tracking Dashboard: https://www.manifestinvesting.com/dashboards/public/fave-five

Fave Five: Escape Velocity

Fave Five (12/9/2016)

Our Fave Five essentially represents a listing of stocks with favorable short term total return forecasts (1 year, according to Analyst Consensus Estimates, or ACE) combined with strong long-term return forecasts and good/excellent quality rankings. The average 1-year ACE total return forecast is 8.1%.

Every year we run a stock selection challenge starting on Groundhog Day (February 2) and running for the next twelve months. Individual investors and groups like investment clubs are welcome to participate by choosing 5-20 stocks.

We’ve now got nine annual contests under our belt. We crown an individual and group champion every year.

Escape Velocity

In three of the last four years, the Broad Assets Investment Club of St. Louis has toppled dozens of competing groups — taking home multiple Groundhog stock selection championships.

I’ll let that sink in.

Three of the past four years. Their excess/relative return (annualized) since inception is +28.7%.

Let that sink in, too.

We want some of whatever they’re having. Seriously, we checked the water … asked what they had for breakfast, etc. in an effort to come to grips with the primary driver behind their stunning success and track record. We discovered one potential influence. It seems like Broad Assets latches on to companies that have huge incremental improvements in earnings forecasts for next year versus this year. We detailed our findings in our cover story, Victory By Escape Velocity?

This week’s Fave Five is based on companies with solid long-term outlooks that also have superior earnings forecasts for 2017 versus estimates for 2016. The bracketed column displays the top five year-over-year forecasts, according to analyst consensus estimates. [Source: ACE and finance.yahoo.com]

The median year-over-year (2017/2016) differential for the ~2400 companies we cover is currently 11.8%.

For more information on joining our 11th annual Groundhog Challenge, launching 2/2/2017, as either a group or an individual investor, drop a note to markr@manifestinvesting.com.

The Fave Five This Week

  • Allergan (AGN)
  • Baidu (BIDU)
  • Celgene (CELG)
  • Five Below (FIVE)
  • Universal Display (OLED)

The Long and Short of This Week’s Fave Five

The Long & Short. (December 9, 2016) Projected Annual Return (PAR): Long term return forecast based on fundamental analysis and five year time horizon. Quality Ranking: Percentile ranking of composite that includes financial strength, earnings stability and relative growth & profitability. VL Low Total Return (VLLTR): Low total return forecast based on 3-5 year price targets via Value Line Investment Survey. Morningstar P/FV: Ratio of current price to fundamentally-based fair value via www.morningstar.com S&P P/FV: Current price-to-fair value ratio via Standard & Poor’s. 1-Year ACE Outlook: Total return forecast based on analyst consensus estimates for 1-year target price combined with current yield. The data is ranked (descending order) based on this criterion. 1-Year S&P Outlook: 1-year total return forecast based on S&P 1-year price target. 1-Yr GS: 1-year total return forecast based on most recent price target issued by Goldman Sachs.

Weekend Warriors

The relative/excess return for the Weekend Warrior tracking portfolio is +5.8% since inception. 51.9% of selections have outperformed the Wilshire 5000 since original selection.

Tracking Dashboard: https://www.manifestinvesting.com/dashboards/public/weekend-warriors

Weekend Warrior Tracking Portfolio: Selling Discipline

There are two primary selling conditions for the Weekend Warrior tracking portfolio.

  • For the first year after selection, if the excess/relative return (vs. the Wilshire 5000) becomes less than -20%, the position is closed.
  • A position is also closed (usually with a victory lap) when the return forecast (PAR) is less than the median return forecast (MIPAR).

This week, Stifel Financial (SF) and Raymond James (RJF) have both been on a surge, gaining 65% since selection. With return forecasts of 2-4% when the median return forecast is now 5% — both positions were closed. [High Five]

Fave Five (10/28/2016)

Fave Five (10/28/2016)

Our Fave Five essentially represents a listing of stocks with favorable short term total return forecasts (1 year, according to Analyst Consensus Estimates, or ACE) combined with strong long-term return forecasts and good/excellent quality rankings.

So you’re looking at the stocks in the top 1% of all companies according to MANIFEST Rank (Return Forecast and Quality combination) that have the lowest price-to-fair value ratios (P/FV) according to S&P. The P/FV profile for the S&P Platinum Portfolio is shown here:

The Fave Five This Week

  • Abbvie (ABBV)
  • Celgene (CELG)
  • Deckers (DECK)
  • LKQ Corp (LKQ)
  • Stericycle (SRCL)

Context: The median S&P price to fair value ratio is 102%.

The Long and Short of This Week’s Fave Five

The Long & Short. (October 28, 2016) Projected Annual Return (PAR): Long term return forecast based on fundamental analysis and five year time horizon. Quality Ranking: Percentile ranking of composite that includes financial strength, earnings stability and relative growth & profitability. VL Low Total Return (VLLTR): Low total return forecast based on 3-5 year price targets via Value Line Investment Survey. Morningstar P/FV: Ratio of current price to fundamentally-based fair value via www.morningstar.com S&P P/FV: Current price-to-fair value ratio via Standard & Poor’s. 1-Year ACE Outlook: Total return forecast based on analyst consensus estimates for 1-year target price combined with current yield. The data is ranked (descending order) based on this criterion. 1-Year S&P Outlook: 1-year total return forecast based on S&P 1-year price target. 1-Yr GS: 1-year total return forecast based on most recent price target issued by Goldman Sachs.

Weekend Warriors

The relative/excess return for the Weekend Warrior tracking portfolio is +8.7% since inception. 42.6% of selections have outperformed the Wilshire 5000 since original selection.

Tracking Dashboard: https://www.manifestinvesting.com/dashboards/public/weekend-warriors

Fave Five (10/21/2016)

Fave Five (10/21/2016)

Our Fave Five essentially represents a listing of stocks with favorable short term total return forecasts (1 year, according to Analyst Consensus Estimates, or ACE) combined with strong long-term return forecasts and good/excellent quality rankings.

So you’re looking at the stocks in the top 1% of all companies according to MANIFEST Rank (Return Forecast and Quality combination) that have the highest 1-year total return forecasts according to the analyst consensus estimates. (ACE)

The Fave Five This Week

  • Air Lease (AL)
  • Celgene (CELG)
  • Cognizant Technology (CTSH)
  • Novo Nordisk (NVO)
  • Universal Display (OLED)

Context: The median 1-year return forecast (ACE) is 10.6%.

The Long and Short of This Week’s Fave Five

The Long & Short. (October 21, 2016) Projected Annual Return (PAR): Long term return forecast based on fundamental analysis and five year time horizon. Quality Ranking: Percentile ranking of composite that includes financial strength, earnings stability and relative growth & profitability. VL Low Total Return (VLLTR): Low total return forecast based on 3-5 year price targets via Value Line Investment Survey. Morningstar P/FV: Ratio of current price to fundamentally-based fair value via www.morningstar.com S&P P/FV: Current price-to-fair value ratio via Standard & Poor’s. 1-Year ACE Outlook: Total return forecast based on analyst consensus estimates for 1-year target price combined with current yield. The data is ranked (descending order) based on this criterion. 1-Year S&P Outlook: 1-year total return forecast based on S&P 1-year price target. 1-Yr GS: 1-year total return forecast based on most recent price target issued by Goldman Sachs.

Weekend Warriors

The relative/excess return for the Weekend Warrior tracking portfolio is +12.9% since inception. 42.6% of selections have outperformed the Wilshire 5000 since original selection.

Tracking Dashboard: https://www.manifestinvesting.com/dashboards/public/weekend-warriors

Fave Five (10/14/2016)

Fave Five (10/14/2016)

Our Fave Five essentially represents a listing of stocks with favorable short term total return forecasts (1 year, according to Analyst Consensus Estimates, or ACE) combined with strong long-term return forecasts and good/excellent quality rankings.

So you’re looking at the stocks in the top 1% of all companies according to MANIFEST Rank (Return Forecast and Quality combination) that have the highest 1-year total return forecasts according to the analyst consensus estimates. (ACE)

The Fave Five This Week

  • Aaron’s Rents (AAN)
  • Celgene (CELG)
  • Cognizant Technology (CTSH)
  • Novo Nordisk (NVO)
  • Universal Display (OLED)

Context: The median 1-year return forecast (ACE) is 9.9%.

The Long and Short of This Week’s Fave Five

The Long & Short. (October 14, 2016) Projected Annual Return (PAR): Long term return forecast based on fundamental analysis and five year time horizon. Quality Ranking: Percentile ranking of composite that includes financial strength, earnings stability and relative growth & profitability. VL Low Total Return (VLLTR): Low total return forecast based on 3-5 year price targets via Value Line Investment Survey. Morningstar P/FV: Ratio of current price to fundamentally-based fair value via www.morningstar.com S&P P/FV: Current price-to-fair value ratio via Standard & Poor’s. 1-Year ACE Outlook: Total return forecast based on analyst consensus estimates for 1-year target price combined with current yield. The data is ranked (descending order) based on this criterion. 1-Year S&P Outlook: 1-year total return forecast based on S&P 1-year price target. 1-Yr GS: 1-year total return forecast based on most recent price target issued by Goldman Sachs.

Weekend Warriors

The relative/excess return for the Weekend Warrior tracking portfolio is +9.8% since inception. 44.3% of selections have outperformed the Wilshire 5000 since original selection.

Tracking Dashboard: https://www.manifestinvesting.com/dashboards/public/weekend-warriors

Fave Five (9/23/2016)

Fave Five (9/23/2016)

Our Fave Five essentially represents a listing of stocks with favorable short term total return forecasts (1 year, according to Analyst Consensus Estimates, or ACE) combined with strong long-term return forecasts and good/excellent quality rankings.

So you’re looking at the stocks in the top 1% of all companies according to MANIFEST Rank (Return Forecast and Quality combination) that have the highest 1-year total return forecasts according to the analyst consensus estimates. (ACE)

The Fave Five This Week

  • Celgene (CELG)
  • Extra Space Storage (EXR)
  • Honda (HMC)
  • Stericycle (SRCL)
  • Ulta Salons (ULTA)

Context: The average 1-year total return forecast for the Value Line 1700 is 14.7%. The average 5-year return forecast for $VLE is 5.0% (annualized).

This Week’s Fave Five In The Sweet Spot

Sweet Spot Five. (September 23, 2016) Projected Annual Return (PAR): Long term return forecast based on fundamental analysis and five year time horizon. Quality Ranking: Percentile ranking of composite that includes financial strength, earnings stability and relative growth & profitability.

Weekend Warriors

The relative/excess return for the Weekend Warrior tracking portfolio is +6.3% since inception. 54.1% of selections have outperformed the Wilshire 5000 since original selection.

Tracking Dashboard: https://www.manifestinvesting.com/dashboards/public/weekend-warriors

Fave Five (9/16/2016)

Fave Five (9/16/2016)

Our Fave Five essentially represents a listing of stocks with favorable short term total return forecasts (1 year, according to Analyst Consensus Estimates, or ACE) combined with strong long-term return forecasts and good/excellent quality rankings.

So you’re looking at the stocks in the top 1% of all companies according to MANIFEST Rank (Return Forecast and Quality combination) that have the highest 1-year total return forecasts according to the analyst consensus estimates. (ACE)

The Fave Five This Week

  • Aaron’s (AAN)
  • Celgene (CELG)
  • Cognizant Tech (CTSH)
  • CVS Health (CVS)
  • Jazz Pharma (JAZZ)
  • Spirit Airlines (SAVE)

Context: The average 1-year total return forecast for the Value Line 1700 is 14.7%. The average 5-year return forecast for $VLE is 5.0% (annualized).

The Long and Short of This Week’s Fave Five

The Long & Short. (September 16, 2016) Projected Annual Return (PAR): Long term return forecast based on fundamental analysis and five year time horizon. Quality Ranking: Percentile ranking of composite that includes financial strength, earnings stability and relative growth & profitability. VL Low Total Return (VLLTR): Low total return forecast based on 3-5 year price targets via Value Line Investment Survey. Morningstar P/FV: Ratio of current price to fundamentally-based fair value viawww.morningstar.com S&P P/FV: Current price-to-fair value ratio via Standard & Poor’s. 1-Year ACE Outlook: Total return forecast based on analyst consensus estimates for 1-year target price combined with current yield. The data is ranked (descending order) based on this criterion. 1-Year S&P Outlook: 1-year total return forecast based on S&P 1-year price target. 1-Yr GS: 1-year total return forecast based on most recent price target issued by Goldman Sachs.

Weekend Warriors

The relative/excess return for the Weekend Warrior tracking portfolio is +5.8% since inception. 53.4% of selections have outperformed the Wilshire 5000 since original selection.

Tracking Dashboard: https://www.manifestinvesting.com/dashboards/public/weekend-warriors

Fave Five (9/2/2016)

Fave Five (9/2/2016)

Our Fave Five essentially represents a listing of stocks with favorable short term total return forecasts (1 year, according to Analyst Consensus Estimates, or ACE) combined with strong long-term return forecasts and good/excellent quality rankings.

These are all repeat selections this week. Under Armour (UA) has gained 10.4% since selection on 1/14/2016.

The Fave Five This Week

  • Air Lease (AL)
  • Celgene (CELG)
  • Jazz Pharma (JAZZ)
  • Spirit Airlines (SAVE)
  • Under Armour (UA)

Context: The average 1-year total return forecast for the Value Line 1700 is 14.7%. The average 5-year return forecast for $VLE is 5.5% (annualized).

The Long and Short of This Week’s Fave Five

The Long & Short. (September 2, 2016) Projected Annual Return (PAR): Long term return forecast based on fundamental analysis and five year time horizon. Quality Ranking: Percentile ranking of composite that includes financial strength, earnings stability and relative growth & profitability. VL Low Total Return (VLLTR): Low total return forecast based on 3-5 year price targets via Value Line Investment Survey. Morningstar P/FV: Ratio of current price to fundamentally-based fair value viawww.morningstar.com S&P P/FV: Current price-to-fair value ratio via Standard & Poor’s. 1-Year ACE Outlook: Total return forecast based on analyst consensus estimates for 1-year target price combined with current yield. The data is ranked (descending order) based on this criterion. 1-Year S&P Outlook: 1-year total return forecast based on S&P 1-year price target. 1-Yr GS: 1-year total return forecast based on most recent price target issued by Goldman Sachs.

Weekend Warriors

The return for the Weekend Warrior tracking portfolio is 15.9% since inception. 43.6% of selections have outperformed the Wilshire 5000 since original selection.

Tracking Dashboard: https://www.manifestinvesting.com/dashboards/public/weekend-warriors

Fave Five (8/12/2016)

Fave Five (8/12/2016)

Our Fave Five essentially represents a listing of stocks with favorable short term total return forecasts (1 year, according to Analyst Consensus Estimates, or ACE) combined with strong long-term return forecasts and good/excellent quality rankings.

The Fave Five This Week

  • Aaron’s (AAN)
  • Celgene (CELG)
  • CVS Health (CVS)
  • Simulations Plus (SLP)
  • Under Armour (UA)

Context: The average 1-year total return forecast (via ACE) for the Value Line 1700 is 18.3%. The average 5-year return forecast for $VLE is 5.6% (annualized).

The Long and Short of This Week’s Fave Five

The Long & Short. (August 12, 2016) Projected Annual Return (PAR): Long term return forecast based on fundamental analysis and five year time horizon. Quality Ranking: Percentile ranking of composite that includes financial strength, earnings stability and relative growth & profitability. VL Low Total Return (VLLTR): Low total return forecast based on 3-5 year price targets via Value Line Investment Survey. Morningstar P/FV: Ratio of current price to fundamentally-based fair value via www.morningstar.com S&P P/FV: Current price-to-fair value ratio via Standard & Poor’s. 1-Year ACE Outlook: Total return forecast based on analyst consensus estimates for 1-year target price combined with current yield. The data is ranked (descending order) based on this criterion. 1-Year S&P Outlook: 1-year total return forecast based on S&P 1-year price target. 1-Yr GS: 1-year total return forecast based on most recent price target issued by Goldman Sachs.

Weekend Warriors

The relative return for the Weekend Warrior tracking portfolio is +4.3% since inception. 47.2% of selections have outperformed the Wilshire 5000 since original selection.

Tracking Dashboard: https://www.manifestinvesting.com/dashboards/public/weekend-warriors

Fave Five (7/15/2016)

Fave Five (7/15/2016)

Our Fave Five essentially represents a listing of stocks with favorable short term total return forecasts (1 year, according to Analyst Consensus Estimates, or ACE) combined with strong long-term return forecasts and good/excellent quality rankings.

The Fave Five This Week

  • Celgene (CELG)
  • Cognizant Technology (CTSH)
  • Maximus (MMS)
  • Polaris (PII)
  • Synaptics (SYNA)

Context: The average 1-year total return forecast (via ACE) for the Value Line 1700 is 18.2%. The median 5-year return forecast for $VLE is 6.9% (annualized).

The Long and Short of This Week’s Fave Five

The Long & Short. (July 15, 2016) Projected Annual Return (PAR): Long term return forecast based on fundamental analysis and five year time horizon. Quality Ranking: Percentile ranking of composite that includes financial strength, earnings stability and relative growth & profitability. VL Low Total Return (VLLTR): Low total return forecast based on 3-5 year price targets via Value Line Investment Survey. Morningstar P/FV: Ratio of current price to fundamentally-based fair value via www.morningstar.com S&P P/FV: Current price-to-fair value ratio via Standard & Poor’s. 1-Year ACE Outlook: Total return forecast based on analyst consensus estimates for 1-year target price combined with current yield. The data is ranked (descending order) based on this criterion. 1-Year S&P Outlook: 1-year total return forecast based on S&P 1-year price target. 1-Yr GS: 1-year total return forecast based on most recent price target issued by Goldman Sachs.

Weekend Warriors

The relative return for the Weekend Warrior tracking portfolio is +3.0% since inception. 46.9% of selections have outperformed the Wilshire 5000 since original selection.

Tracking Dashboard: https://www.manifestinvesting.com/dashboards/public/weekend-warriors