Fave Five (5/17/2019)
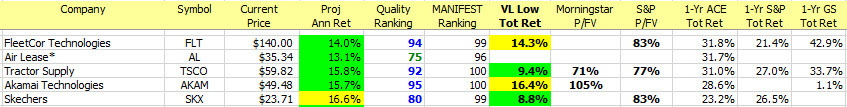
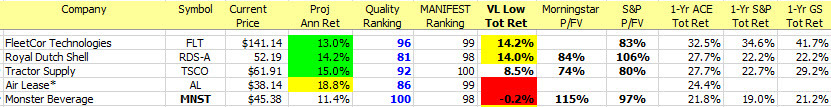
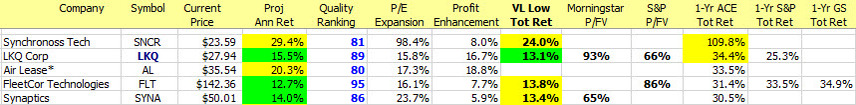
Our Fave Five essentially represents a listing of stocks with favorable short term total return forecasts (1 year, according to Analyst Consensus Estimates, or ACE) combined with strong long-term return forecasts and good/excellent quality rankings. The median 1-year ACE total return forecast is 14.1%.
The City of Big Shoulders … and a Speak Easy, Or Two …
The National Association of Investors held their annual conference in Chicago this past weekend and I was honored/privileged/grateful to attend and to support the efforts of a gifted gypsy band of awesome volunteers. You know who you are. Thank you. Even better, the educational slate included our dear knights (and a damsel) as Kim Butcher, Ken Kavula and Cy Lynch provided several sessions and discussions. Hugh McManus would have joined us if his company hadn’t jobnapped him somewhere between Singapore and San Francisco and diverted him to Barcelona for the weekend.
- You know you might be in Chicago when the banquet menu includes hot dogs smothered in onions, mustard, pickle spears with a side of deep dish pizza.
- You know you might be in Chicago when the LIVE Round Table audience in true crowd rebellion decides that they can vote more than once for stock nominations. (And they’re right)
- You know you might be in Chicago when all of the wait-until-next-year attire has morphed into World Series Champion paraphernalia.
- You know you might be in Chicago when people are imitating the voices of Sean Connery and Kevin Costner in the hallways lined with pictures of beer being “distributed” from barrels on to the streets. (This sort of behavior is likely frowned upon by our resident Irishman Hugh AND his partner in crime, Pat Donnelly.)
- You know you might be in Chicago when an audience of investors wants to talk about cannabis, prohibition and the companies that prospered when Elliott Ness stopped foaming up State Street back in the 1930s. When the audience assumes control of the discussion (which we encourage) and starts talking about specific investment characteristics of Anheuser-Busch, fields of opportunity, distribution infrastructure and doing stock studies on companies from 1933 … I’m pretty sure that, yes, you’re in Chicago.
Yes, you’re among friends who like to share ideas, devastate the mysteries of investing … and they’re BETTER when they do it together.
Three of this week’s Fave Five figured prominently in panel discussions and sessions. Cantel Medical (CMD) was selected by Ken Kavula during the opening session stock panel and Cy Lynch selected II-VI (IIVI) for the Round Table. Kim Butcher selected Air Lease (AL) for the Round Table and the audience seconded her motion while pondering just how many hands and appendages they could vote with for the various nominations. (Except for my pick, REGN, which received an insignificant number of appendages and at least one guffaw. I’m hurt but unswayed.)
Spirit Air Lines (SAVE) did not come up but probably should have. It was on my short list. (But it’s moot. You probably wouldn’t have voted for it anyway.)
The Long and Short of This Week’s Fave Five
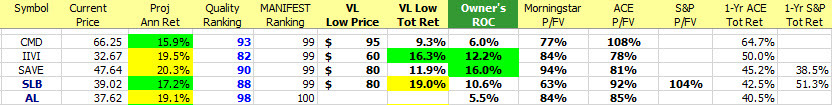
Long & Short Term Perspectives. (May 17, 2019) Projected Annual Return (PAR): Long term return forecast based on fundamental analysis and five year time horizon. Quality Ranking: Percentile ranking of composite that includes financial strength, earnings stability and relative growth & profitability. MANIFEST Ranking: Equally weighted ranking of Return Forecast (PAR) and Quality. 52-Week Position: Position on scale between 52-week low price and 52-week target price. VL Low Total Return (VLLTR): Low total return forecast based on 3-5 year price targets via Value Line Investment Survey. Morningstar P/FV: Ratio of current price to fundamentally-based fair value via www.morningstar.com ACE P/FV: based on analyst consensus for fair value. Owner’s Return On Capital: Return (Profitability, long term estimate) vs. Total Capital (equity + debt). S&P P/FV: Current price-to-fair value ratio via Standard & Poor’s. 1-Year ACE Outlook: Total return forecast based on analyst consensus estimates for 1-year target price combined with current yield. The data is ranked (descending order) based on this criterion. 1-Year S&P Outlook: 1-year total return forecast based on S&P 1-year price target.
Fave Five Legacy (Tracking Portfolio)
The relative/excess return for the Fave Five tracking portfolio is +2.4% since inception.
The absolute annualized rate of return is 11.8%.
Tracking Dashboard: https://www.manifestinvesting.com/dashboards/public/fave-five