This Week at MANIFEST (2/22/2019)
“Investment in knowledge pays the best interest.” — Abraham Lincoln
“I am a firm believer in the people. If given the truth, they can be depended on to meet any national crisis. The great point is to bring them the real facts — and some beer.” — Abraham Lincoln
Raise A Glass
Lincoln was a voracious reader. And legend has it — a pretty good listener, too. Reading the Lincoln-Douglas debate transcripts, he was self-effacing, quick on his feet and the exchanges were actually pretty enjoyable (most of the time.)
Holders of the nation’s highest office have often had a close relationship with booze, as George Washington established the nation’s largest whiskey distillery in 1797 and Thomas Jefferson brewed his own beer. Andrew Jackson’s inaugural party in 1829 was so legendary that we still drink the orange punch party goers consumed. But Lincoln was the only president who was also a licensed bartender.
While they sold booze, it was far from a watering hole. The Chicagoist states that “Stores could sell alcohol in quantities greater than a pint for off-premises consumption, but it was illegal to sell single drinks to consume at the store without a license.
In March 1833, Berry and Lincoln were issued a tavern, or liquor, license, which cost them $7 and was taken out in Berry’s name. Stores that sold liquor to consume on the premises were called groceries.
So … it’s more appropriate to think of Lincoln as a grocer than a bartender.
I still think the Spielberg movie, Lincoln is a must see in these interesting times in which we live.
Why In The World Would A Long Term Investor Live In Fear Of Recessions?

- Alliance Data Systems (ADS)
- CBRE Group (CBRE)
- C.H. Robinson (CHRW)
- Forward Air (FWRD)
- Health Care Services (HCSG)
- Illumina (ILMN)
- Maximus (MMS)
- S&P Global (SPGI)
- Starbucks (SBUX)
Best Small Companies (2019 Dashboard)
The status of the 2019 Best Small Companies can be tracked at: https://www.manifestinvesting.com/dashboards/public/best-small-2019
Investing Round Table Sessions (Video Archives)
- November 2018 (FB, FLT, IIVI)
- December 2018 (AL, IIVI, IPGP, NVDA)
- January 2019 (ARDX, EPAM, HIIQ, TJX)
Investing Topics with Ken, Mark & Friends
- Turnout Tuesday: What’s It All About, Alpha? (August 2018)
- Turnout Tuesday: Of Tortoises & Rabbits (October 2018)
- Turnout Tuesday: Contesting Complacency (December 2018)
- Turnout Tuesday: Difference Years Make, R-E-S-P-E-C-T, Groundhogs (February 2019)
Results, Remarks & References
- Companies That Do Capital Allocation Right (Phil Ordway, Anabatic Fund)
- If This Isn’t Stock Manipulation, Then I Don’t Know What Is (Jesse Felder)
- Why Stock Buybacks Do So Little For Americans (Barry Ritholtz)
- The Dreaded Earnings Recession (Ben Carlson)
- An Open Letter To The President (A Classic — based on your responses — Expected Returns, November 2008)
- O Captain, My Captain! (ER, April 2008)
- Alpha In Your Eyes and Your Feet (Howard Lindzon)
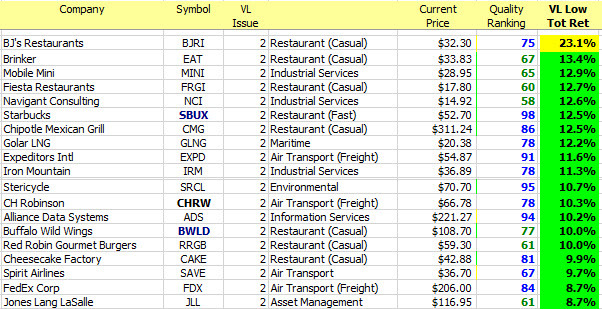
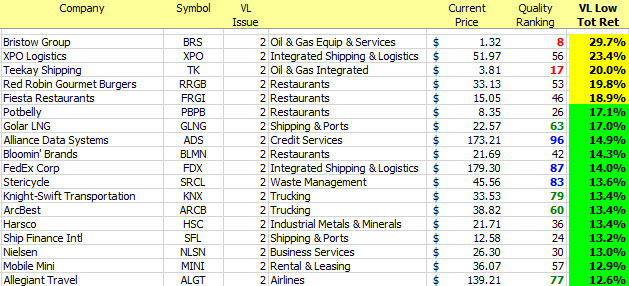
The median Value Line low total return forecast for the companies in this week’s update batch is 7.3% vs. 6.5% for the Value Line 1700 ($VLE).
Materially Stronger: Golar LNG (GLNG), Allegiant Travel (ALGT), United Continental (UAL), Spirit Airlines (SAVE)
Materially Weaker: Bristow Group (BRS), Papa John’s Pizza (PZZA)
Discontinued: Dun & Bradstreet (DNB), American Railcar (ARII)
Market Barometers
The thing very few people tell you about “overvalued” markets is that, occasionally, the fundamentals arrive to justify them. — Joshua Brown

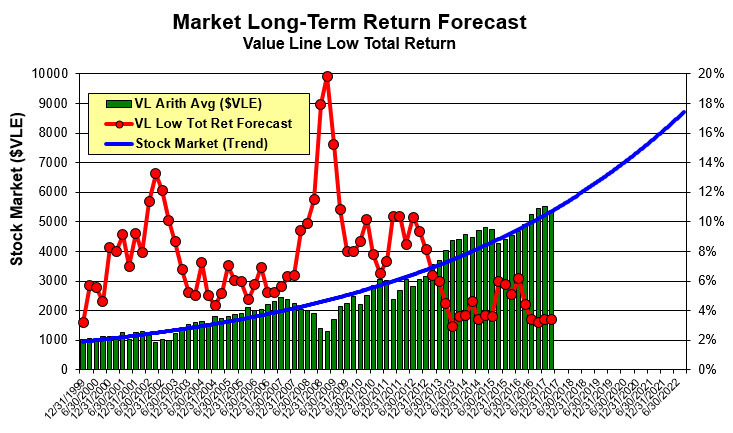
Value Line Low Total Return (VLLTR) Forecast. The long-term low total return forecast for the 1700 companies featured in the Value Line Investment Survey is 6.5%, decreasing from 7.7% last week. For context, this indicator has ranged from low single digits (when stocks are generally overvalued) to approximately 20% when stocks are in the teeth of bear markets like 2008-2009.
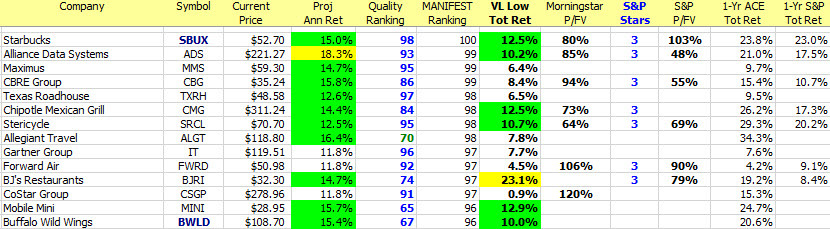
Update Batch: Stocks to Study (2/22/2019)
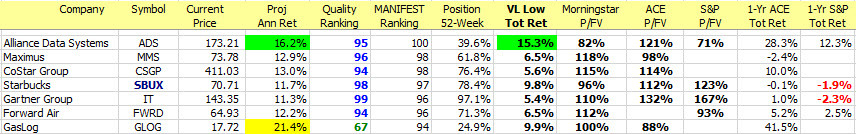
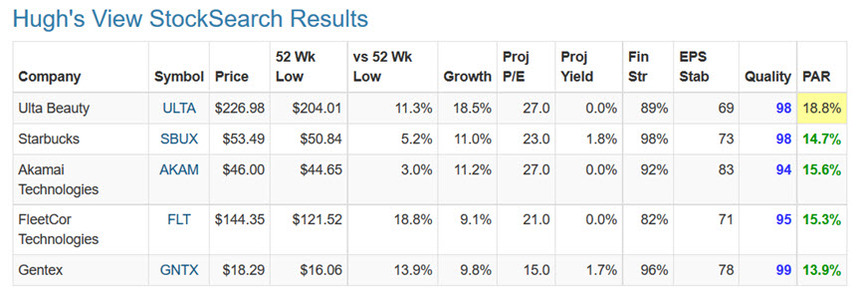
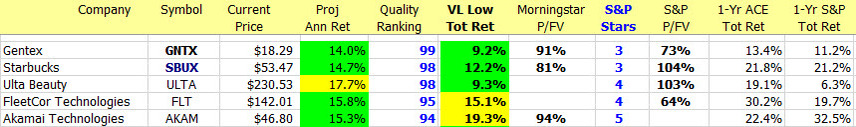
Long & Short Term Perspectives. (February 22, 2019) Projected Annual Return (PAR): Long term return forecast based on fundamental analysis and five year time horizon. Quality Ranking: Percentile ranking of composite that includes financial strength, earnings stability and relative growth & profitability. VL Low Total Return (VLLTR): Low total return forecast based on 3-5 year price targets via Value Line Investment Survey. Morningstar P/FV: Ratio of current price to fundamentally-based fair value via www.morningstar.com S&P P/FV: Current price-to-fair value ratio via Standard & Poor’s. 1-Year ACE Outlook: Total return forecast based on analyst consensus estimates for 1-year target price combined with current yield. 1-Year S&P Outlook: 1-year total return forecast based on S&P 1-year price target.
The average return forecast (PAR) for this week’s update batch is 8.7%. (MIPAR = 8.2%)
The 52-week total return forecast for the group is 18.7% versus 14.9% for stocks overall. S&P has a 1-year outlook for this week’s batch at 10.4%.
Morningstar sees them as fairly valued (P/FV = 101%) and S&P “dissents” at a P/FV of 107%.

Discovery Club
““I think I could make you 50% a year on $1 million. No, I know I could. I guarantee that.” — Warren Buffett, 1999 BusinessWeek Interview
This is a reference to portfolio design and balance — specifically achieving a blend of blue chip stalwarts combined with a suitable mix of faster growing promising smaller companies. We generally aim for an overall sales growth forecast of 10-12% with suitable adjustments for time horizon and/or risk tolerance. Based on some recent soul searching, we’re now pondering how much “relatively undiscovered company content” is enough. Or too much? In any event, we’ll be dedicating a larger slice of our weekly updates to DISCOVERY.
This Week’s Sources and Suggestions
- Value Line Investment Survey Updates
- Groundhog Challenge XIII (2019) Entries
- Barron’s 100 Sustainable Companies
- Kim Butcher’s S&P 600 Initiations
Coverage Initiated/Restored: Northstar Realty Europe (NRE), RingCentral (RNG), Roku (ROKU), Invitae (NVTA), Baozun ADR (BZUN), DXC Technology (DXC)