Goldman Sachs upgrades Microsoft (MSFT) from Neutral to Buy and raises the price target from $60.00 to $68.00.
Goldman Sachs upgrades Microsoft (MSFT) from Neutral to Buy and raises the price target from $60.00 to $68.00.
![]()
Our Fave Five essentially represents a listing of stocks with favorable short term total return forecasts (1 year, according to Analyst Consensus Estimates, or ACE) combined with strong long-term return forecasts and good/excellent quality rankings. This week’s batch is a nod to Cy Lynch and Anne Manning who prefer considerable financial strength when return forecasts ebb lower. We also required top quintile EPS Stability — for dividend lovers, a bedrock of EPS is the source of dividends (along with the company check book.) Some of these are flying at lower altitudes — an acceptable condition for core positions but Morningstar believes all five have the potential to outperform the market over the long term.
The Fave Five This Week
Context: The average 1-year total return forecast (via ACE) for the Value Line 1700 is 14.2%. The average 5-year return forecast for $VLE is 6.6% (annualized).
The Long & Short. (August 19, 2016) Projected Annual Return (PAR): Long term return forecast based on fundamental analysis and five year time horizon. Quality Ranking: Percentile ranking of composite that includes financial strength, earnings stability and relative growth & profitability. VL Low Total Return (VLLTR): Low total return forecast based on 3-5 year price targets via Value Line Investment Survey. Morningstar P/FV: Ratio of current price to fundamentally-based fair value via www.morningstar.com S&P P/FV: Current price-to-fair value ratio via Standard & Poor’s. 1-Year ACE Outlook: Total return forecast based on analyst consensus estimates for 1-year target price combined with current yield. The data is ranked (descending order) based on this criterion. 1-Year S&P Outlook: 1-year total return forecast based on S&P 1-year price target. 1-Yr GS: 1-year total return forecast based on most recent price target issued by Goldman Sachs.
The return for the Weekend Warrior tracking portfolio is 11.6% since inception. 43.2% of selections have outperformed the Wilshire 5000 since original selection.
Tracking Dashboard: https://www.manifestinvesting.com/dashboards/public/weekend-warriors
Your Most Widely-Followed Stocks: An Update
Our MANIFEST 40 is a celebration of collective excellence in stock selection, strategy and disciplined patience.
The 40 stocks are something of a barometer because we know that these community favorites are not simply followed … most of them are also widely owned, with considerable diligence and vigilance.
 MANIFEST 40 (March 2016). Performance Results. These are the most widely followed stocks by Manifest Investing subscribers. Current leader Apple (AAPL) was added on 9/24/2009 and steadily climbed the ranks while generating a relative return of +20.3% (annualized) since then. Figures in parentheses are the ranking back in December 2015.
The rate of return is 9.0% since inception (9/30/2005). Bottom line? On an annualized basis, your community favorites have beaten the Wilshire 5000 by +3.6 percentage points — a relative, or excess, return that probably portends outsized success with our actual portfolios.
Quality (90) is solid and the overall return forecast (8.9%) is positioned to outperform the Wilshire 5000. At an average sales growth forecast of 6.8%, we’d to see some faster-growing companies adopted by our community.
Gilead Sciences (GILD) moved from #25 to #22 as most of the list remained rather steady. Visa (V) is a new addition at #40. The results of $100 positions investing in any of the Top 40 companies can be viewed at any time via the public dashboard on the home page.
“We have always believed that the collective decisions made by our community of long-term investors are worth huddling over … a place where ideas are born.”
We launched the MANIFEST 40 in October 2005, built from the stocks that most frequently appear on subscriber dashboards, and this active and continuously maintained tracking dashboard has delivered a rate of return of 9.2% since inception.
The 40 stocks are something of a barometer because we know that these community favorites are not simply followed … most of them are also widely owned, with considerable diligence and vigilance. Bottom line? On an annualized basis, your community favorites have beaten the Wilshire 5000 by +3.4 percentage points — a relative return that nurtures smiles and bolsters the returns of our actual portfolios.
The average sales growth forecast of the portfolio (6.7%) suggests that it is dominated by the “Up, Straight and Parallel” core contributors. Quality (90) is solid and the overall return forecast (9.7%) is positioned to outperform the Wilshire 5000. We’d like to see the community discover and follow some smaller, faster-growing companies.
The absolute rate of return for the trailing 10 years is 9.2%.
Gilead Sciences (GILD) moved from #29 to #25 as most of the list remained rather steady. Fastenal (FAST) shuffled up to #4 and Johnson & Johnson (JNJ) dropped a couple of positions. The results of $100 positions investing in any of the Top 40 companies can be viewed at any time at:
http://www.manifestinvesting.com/dashboards/public/manifest-40
Our MANIFEST 40 is a celebration of collective excellence in stock selection, strategy and disciplined patience.
“We have always believed that the collective decisions made by our community of long-term investors are worth huddling over … a place where ideas are born.”
Perspectives
Our MANIFEST 40 is a celebration of collective excellence in stock selection, strategy and disciplined patience. We continuously monitor the 40 most-widely followed stocks by our community of subscribers at Manifest Investing.
“We have always believed that the collective decisions made by our community of like-minded, long-term investors are worth huddling over … a place where ideas are born.”
This managed “tracking portfolio” of your collective favorites has outperformed the Wilshire 5000 by +3.3%. The absolute rate of return for the trailing 9.5 years is 9.6%.
QUALCOMM (QCOM) continues to ascend, moving from #12 to #11. CVS Health (CVS) has been bolstered of late and moves from #38 to #37.
The results of $100 positions investing in any of the Top 40 companies can be viewed at any time at: http://www.manifestinvesting.com/dashboards/public/manifest-40
T. Rowe Price (TROW) is a newcomer to the MANIFEST 40. The company was featured in Solomon Select in the July 2014 issue and has been discussed during a number of Round Tables and during other events. The asset manager is highly regarded in this long-term investing community and has been a favorite for decades.
The three top performers in the MANIFEST 40 since inception, based on annualized relative rate of return, are Cognizant Technology (+30.7%!), Apple (27.5%), PRA Group (20.2%).
The charter members of the MANIFEST 40: Microsoft (3), Stryker (4), AFLAC (5), Johnson & Johnson (6), General Electric (7), Cisco Systems (10), Walgreen (12), FactSet Research (13), Oracle Corp (17), PepsiCo (18), Teva Pharmaceutical (20), Intel Corp (22), Medtronic (23), Danaher (27) and Wal-Mart (33).
We’ll continue to pay the most attention to these community favorites. Keep up the good hunting!
“I would be a bum on the street corner with a tin cup if markets were efficient.” — Warren Buffett
This demonstration portfolio invests the maximum allowable 401(k) in stocks. Total assets reached $1,000,000 in 17 years. Tin Cup has outperformed the S&P 500 since inception (1995) and the annualized total return is now 18.6% vs. 9.9% for the S&P 500.
The total return for the trailing year for Tin Cup is 20.1% versus 13.9% for the Wilshire 5000 (VTSMX).

And not to “jinx” the free throw shooter during March Madness … but we can probably start thinking $2,000,000 count down fairly soon. The second million won’t take nearly as long as the first.
Tracking portfolio for Tin Cup: https://www.manifestinvesting.com/dashboards/public/tin-cup
The last few years have been pretty good to the Dow 30 stocks — after spending the first ten years of this century in the dog house. The trailing 5-year annualized return is 15.0% versus the Wilshire 5000 at 16.8%. So the other 4970 stocks have actually continued to outshine the Dow 30.
One of the things we’ve noticed is that the renaissance of many of these stocks has persisted — with continuing improvement in profitability, etc. — while many companies are under more margin pressure and “deceleration.”
Here’s a quick look at our 5-year forecasts for the Dow 30 as well as the Value Line low total return 3-5 year forecast. We’ve also included a quick look at Morningstar and S&P price-to-fair value (P/FV) metrics. (100% = fairly valued … <100% is potentially attractive)
In keeping with some of the Groundhog shopping, we also display the 1-year outlooks based on analyst consensus and S&P target prices.
Nutshell: Microsoft (MSFT) and General Electric (GE) are consensus favorites. S&P thinks JP Morgan (JPM) is a steal. There’s an IBM (IBM) bandwagon at Morningstar. Value Line is skeptical about the long-term forecast for Disney (DIS), Cisco Systems (CSCO) and Home Depot (HD). S&P doesn’t want Coca-Cola (KO) … not even with a 10-foot pole. Morningstar thinks United Health (UNH) is overvalued, too. S&P is scratching their heads over Exxon Mobil (XOM) and Chevron (CVX) … and we’ll stay tuned to see what conclusions are reached by Team Stovall.

Movember? Going Grubby?
I’m not sure whether it’s a hunting season thing … or merely an excuse that many men use to take a break from shaving, but Movember is in full swing in many places. Beard Mania was celebrated BIG in Boston during their recent World Series conquest with many of the Red Sox players sporting facial hair that would have made bearded Civil War combatants proud. The appearance, including some modest twerking with Carrie Underwood, by Duck Dynasty with Willie Robertson and his fam on the Country Music Awards further popularized canning the razor blades and donning the bandana …
But the shaving continues when it comes to the fundamental analysis of our update batch. We continue (with a few notable exceptions cited below) to see that stealthy reduction of long-term forecasts combining with erosion of 2013 and 2014 consensus estimates on both the top and bottom lines.
And to the U.S. veterans who have served, and their incredible contributions to freedom, whether you decide to sport a moustache, beard or both — we say a simple THANK YOU! from the bottom of our hearts. Simply put, YOU ROCK.
Companies of Interest
There’s a smidge more companies on the “Stronger” line this week, but still nothing to write home about. Microsoft (MSFT) finally received a fundamental upgrade and Priceline’s price surge over the last several months (+61.8% over the trailing 12 months) also merited a closer look and a modest boost. But the trimming continues to far outweigh any boosting as the rhinos seem to refuse to Movember with the rest of a stubbly and grubby nation.

Materially Stronger: Microsoft (MSFT) 2, Priceline (PCLN) 3, Zions Bancorp (ZION)
Materially Weaker: Fusion-IO (FIO), Teradata (TDC) 1, Nuance Communications (NUAN), LinkedIn (LNKD)
1 Teradata (TDC) reduced to $65, from $75, on long-term low price forecast. Annualized return drops from 14% to 10.2%.
2 Microsoft (MSFT) raised from $40 to $45 for long-term low price forecast.
3 Priceline (PCLN) raised from $1265 to $1380 for long-term low price forecast.
Market Barometers
The median Value Line low total return forecast (VLLTR) remains unchanged at 3.9% during this week’s update.

Watching last night’s Grammy Awards, I was once again reminded of many things. From Faith Hill’s “Don’t Hurry … But Don’t Wait” to the magic of Michael Jackson and his pile of awards. But for some reason, I was reminded distinctly of Mother Theresa. Did you know that Mother Theresa won the inaugural Templeton Award? In this feature from August 2008, we honored the legacy of lifetime achievement in investing by one Sir John Templeton.
 Sir John Templeton (1912-2008) started his Wall Street career in 1937 and went on to create some of the world’s largest and most successful international investment funds. He was called by Money magazine “arguably the greatest global stock picker of the century.”
Sir John Templeton gave us a legacy of long-term investing wisdom. Sadly, he passed away during July (2008) at the age of 95. A Rhodes Scholar, his adventures spanned the globe — seeking opportunity independent of domicile. His religion and philanthropy were very important to him. Did you know that Mother Theresa received the inaugural Templeton award, valued at $2 million? The monetary award is what it is because Sir John always wanted his faith-based awards to be worth more than the Nobel Prize. Inspired by MANIFEST subscriber Frank Bower, let’s take a look at some of Templeton’s guiding principles.
Over the years, Sir John Templeton published a number of articles and made speeches about his investing principles. This list was culled by John Christy from memories of working with Templeton for Forbes. Let’s visit these themes in our own words and methods.
For more: One World. One Dream.
“I’m the stock watcher for Microsoft (MSFT) and would like to e-mail a copy of my EAGLE to other members before our meeting, but haven’t been able to copy and paste it. Is it possible? Keep in mind I’m quite technology challenged.” 🙂
Let’s take this opportunity to walk through a few things … and along the way, hopefully you’ll get some materials that you can use with your fellow investment club partners.
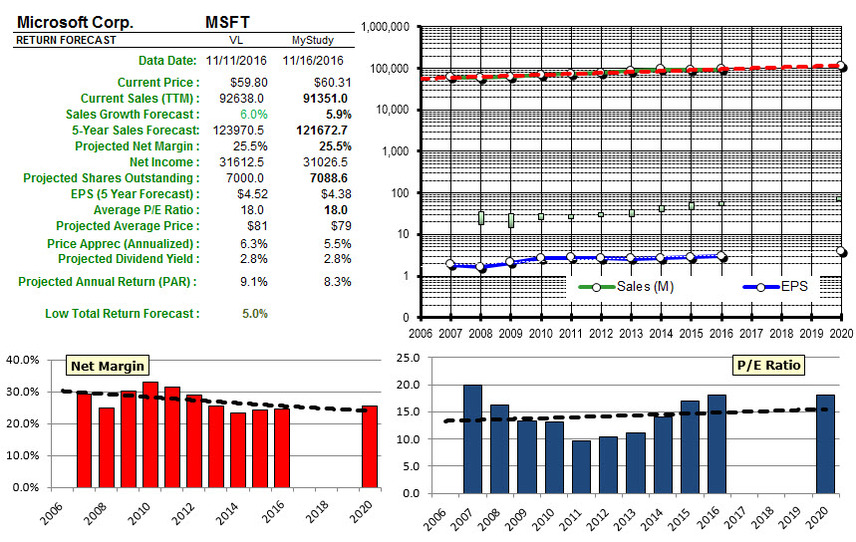
EAGLE stands for Equity Analysis Guide to Long-Term Expectations. Or Equity Analysis Guide, in short — reflecting a summary of the most important influences, drivers and factors when studying a company in the effort to build a considered forecast. Taken collectively, it’s all about our approach to stock analysis — using a 5-year continuously scrolling time horizon. And it manifests itself in a variety of different places and applications scattered throughout the site.
We’ll cover the first here, the Company Report — this is the analysis results based on a consensus forecast of the rhino herd. We monitor analyst consensus estimates for sales, profitability and P/E ratios (in the framework of a five year time horizon) and derive a return forecast based on that consensus.
In the case of MSFT, here’s a snapshot of the Company Report right now:

If you’re relatively new to this, we like Value Line (www.valueline.com) a lot — and we think it’s a worthy part of any investor’s arsenal.
In this case, you can become more familiar with Value Line as a trusted resource by taking a look at the company report for Microsoft (MSFT) — because it’s available for FREE as part of the Dow 30 here: http://www.valueline.com/Dow30/index.aspx
Scroll down and pull up the report on MSFT. We think that a vast majority of the time, the Value Line low total return forecast (VLLTR, shown here) should RESEMBLE the results of your study. Keep in mind that this is the Value Line analyst’s 3-5 year return forecast (based on the price forecast range … and leaning towards the low end of the forecast range.) Trust us on this one. Actual returns 3-5 years from now are more likely to resemble the low total return forecast than the average or the high. (We can prove it.)

As shown here, the 3-5 year low total return forecast is 16%. Your study results should RESEMBLE (not necessarily match) this.
And for what it’s worth, correcting for the change in stock price since this report was issued (AND the change in forecast range) … the current VLLTR for MSFT is 21.7%.
Both of these forecasts will likely be updated with tomorrow’s release of Issue 13 … Value Line updates every company every thirteen weeks or quarterly. So do we for all companies with more frequent updates for the most widely-followed companies by our subscribers and/or any material news or forecast modifications between quarterly updates.
Business Model Analysis: Sales Growth Forecast
Based on this quick analysis of top-line conditions, and barring any major shifts in the 3-5 year forecast for MSFT tomorrow morning from Value Line, we’d expect the long-term sales growth forecast to moderate, albeit slightly, to 8% … as shown here.

Welcome To The Sandbox
That’s right. We provide you with a playground where you can conduct sensitivity analyses of the milestone assumptions and judgments during your stock study.
Sensitivity analysis? Relax. That’s just some jargon you can throw around at the next neighborhood party or the next time you slump into the chair at the hair salon. It’s just a fancy way of saying “what if?” At Manifest Investing, you can go to MyStudies and perform your own tinkering with the major parameters. We pull in the major numbers and any box with a green icon in the corner can be modified.

For example, pulling current EPS probably results in a pull of operating earnings that are not conditioned to correct for one-time events, etc. like they do for us at Value Line. In this case, when we launched the sand box, the current EPS was $1.82. A more representative current EPS can be delved from the attached Value Line quarterly data. (We switched it to $2.80 based on EPS thru 3/31/2013)
Keen-eyed observers will also pick up on a “weird” trailing 12-month sales figure for some companies. The reason for this is we’re continuously INTERPOLATING based on the analyst consensus estimates — basically constantly trying to think of revenues based on the trend line in the business model analysis. It’s one of our methods of CONTINUOUSLY updating the stocks we follow … adjusting as the days roll by AND/OR correcting for adjustments to the analyst consensus forecasts.

Modifications:
(1) EPS to $2.80
(2) Sales to $77 billion — merely rounding off.
(3) Sale growth forecast to 8% based on the previous business model trend.
(4) Payout ratio to 35% — pulling current published payout ratios are often “erratic” — and 45% was probably a little high for MSFT.
The result is an annualized return forecast closer to 20% or the high teens.
It’s been a while since we did one of these, but there’s an Excel version of the Equity Analysis Guide for those who want to dabble with other stocks, etc. or simply prefer this to the MyStudies module.
Here’s what it looks like for Microsoft (MSFT):


