Fave Five: Escape Velocity

Fave Five (12/9/2016)

Our Fave Five essentially represents a listing of stocks with favorable short term total return forecasts (1 year, according to Analyst Consensus Estimates, or ACE) combined with strong long-term return forecasts and good/excellent quality rankings. The average 1-year ACE total return forecast is 8.1%.

Every year we run a stock selection challenge starting on Groundhog Day (February 2) and running for the next twelve months. Individual investors and groups like investment clubs are welcome to participate by choosing 5-20 stocks.

We’ve now got nine annual contests under our belt. We crown an individual and group champion every year.

Escape Velocity

In three of the last four years, the Broad Assets Investment Club of St. Louis has toppled dozens of competing groups — taking home multiple Groundhog stock selection championships.

I’ll let that sink in.

Three of the past four years. Their excess/relative return (annualized) since inception is +28.7%.

Let that sink in, too.

We want some of whatever they’re having. Seriously, we checked the water … asked what they had for breakfast, etc. in an effort to come to grips with the primary driver behind their stunning success and track record. We discovered one potential influence. It seems like Broad Assets latches on to companies that have huge incremental improvements in earnings forecasts for next year versus this year. We detailed our findings in our cover story, Victory By Escape Velocity?

This week’s Fave Five is based on companies with solid long-term outlooks that also have superior earnings forecasts for 2017 versus estimates for 2016. The bracketed column displays the top five year-over-year forecasts, according to analyst consensus estimates. [Source: ACE and finance.yahoo.com]

The median year-over-year (2017/2016) differential for the ~2400 companies we cover is currently 11.8%.

For more information on joining our 11th annual Groundhog Challenge, launching 2/2/2017, as either a group or an individual investor, drop a note to markr@manifestinvesting.com.

The Fave Five This Week

  • Allergan (AGN)
  • Baidu (BIDU)
  • Celgene (CELG)
  • Five Below (FIVE)
  • Universal Display (OLED)

The Long and Short of This Week’s Fave Five

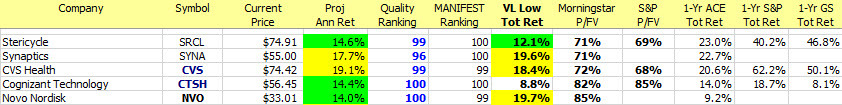
The Long & Short. (December 9, 2016) Projected Annual Return (PAR): Long term return forecast based on fundamental analysis and five year time horizon. Quality Ranking: Percentile ranking of composite that includes financial strength, earnings stability and relative growth & profitability. VL Low Total Return (VLLTR): Low total return forecast based on 3-5 year price targets via Value Line Investment Survey. Morningstar P/FV: Ratio of current price to fundamentally-based fair value via www.morningstar.com S&P P/FV: Current price-to-fair value ratio via Standard & Poor’s. 1-Year ACE Outlook: Total return forecast based on analyst consensus estimates for 1-year target price combined with current yield. The data is ranked (descending order) based on this criterion. 1-Year S&P Outlook: 1-year total return forecast based on S&P 1-year price target. 1-Yr GS: 1-year total return forecast based on most recent price target issued by Goldman Sachs.

Weekend Warriors

The relative/excess return for the Weekend Warrior tracking portfolio is +5.8% since inception. 51.9% of selections have outperformed the Wilshire 5000 since original selection.

Tracking Dashboard: https://www.manifestinvesting.com/dashboards/public/weekend-warriors

Weekend Warrior Tracking Portfolio: Selling Discipline

There are two primary selling conditions for the Weekend Warrior tracking portfolio.

  • For the first year after selection, if the excess/relative return (vs. the Wilshire 5000) becomes less than -20%, the position is closed.
  • A position is also closed (usually with a victory lap) when the return forecast (PAR) is less than the median return forecast (MIPAR).

This week, Stifel Financial (SF) and Raymond James (RJF) have both been on a surge, gaining 65% since selection. With return forecasts of 2-4% when the median return forecast is now 5% — both positions were closed. [High Five]

Fave Five (12/2/2016)

Fave Five (12/2/2016)

Our Fave Five essentially represents a listing of stocks with favorable short term total return forecasts (1 year, according to Analyst Consensus Estimates, or ACE) combined with strong long-term return forecasts and good/excellent quality rankings. The average 1-year ACE total return forecast is 8.1%.

We’re back after a Turkey hiatus and proceeding with the second year of this weekly feature and resultant tracking portfolio. This week’s stocks represent some leaders with a solid long term outlook, a couple that have clearly found a speed bump … but all of them are generally regarded as “over sold” and many of them have been appearing on screening results.

The Fave Five This Week

  • Allergan (AGN)
  • Cerner (CERN)
  • Steris (STE)
  • Synaptics (SYNA)
  • Teva Pharma (TEVA)

The Long and Short of This Week’s Fave Five

The Long & Short. (December 2, 2016) Projected Annual Return (PAR): Long term return forecast based on fundamental analysis and five year time horizon. Quality Ranking: Percentile ranking of composite that includes financial strength, earnings stability and relative growth & profitability. VL Low Total Return (VLLTR): Low total return forecast based on 3-5 year price targets via Value Line Investment Survey. Morningstar P/FV: Ratio of current price to fundamentally-based fair value via www.morningstar.com S&P P/FV: Current price-to-fair value ratio via Standard & Poor’s. 1-Year ACE Outlook: Total return forecast based on analyst consensus estimates for 1-year target price combined with current yield. The data is ranked (descending order) based on this criterion. 1-Year S&P Outlook: 1-year total return forecast based on S&P 1-year price target. 1-Yr GS: 1-year total return forecast based on most recent price target issued by Goldman Sachs.

Weekend Warriors

The relative/excess return for the Weekend Warrior tracking portfolio is +4.5% since inception. 51.3% of selections have outperformed the Wilshire 5000 since original selection.

Tracking Dashboard: https://www.manifestinvesting.com/dashboards/public/weekend-warriors

Fave Five (11/18/2016)

Fave Five (11/18/2016)

Our Fave Five essentially represents a listing of stocks with favorable short term total return forecasts (1 year, according to Analyst Consensus Estimates, or ACE) combined with strong long-term return forecasts and good/excellent quality rankings.

This week, we seek the companies with the best return forecasts, highest quality and in a tribute to www.morningstar.com — the companies with the lowest price-to-fair value ratios as being potentially “on sale.” Context: A P/FV = 100% would indicate that a stock is priced at its fair value according to Morningstar.

The Fave Five This Week

  • Cognizant Technology (CTSH)
  • CVS Health (CVS)
  • Novo Nordisk (NVO)
  • Stericycle (SRCL)
  • Synaptics (SYNA)

The Long and Short of This Week’s Fave Five

The Long & Short. (November 18, 2016) Projected Annual Return (PAR): Long term return forecast based on fundamental analysis and five year time horizon. Quality Ranking: Percentile ranking of composite that includes financial strength, earnings stability and relative growth & profitability. VL Low Total Return (VLLTR): Low total return forecast based on 3-5 year price targets via Value Line Investment Survey. Morningstar P/FV: Ratio of current price to fundamentally-based fair value via www.morningstar.com S&P P/FV: Current price-to-fair value ratio via Standard & Poor’s. 1-Year ACE Outlook: Total return forecast based on analyst consensus estimates for 1-year target price combined with current yield. The data is ranked (descending order) based on this criterion. 1-Year S&P Outlook: 1-year total return forecast based on S&P 1-year price target. 1-Yr GS: 1-year total return forecast based on most recent price target issued by Goldman Sachs.

Weekend Warriors

The relative/excess return for the Weekend Warrior tracking portfolio is +5.0% since inception. 50.7% of selections have outperformed the Wilshire 5000 since original selection.

Tracking Dashboard: https://www.manifestinvesting.com/dashboards/public/weekend-warriors

Fave Five (11/11/2016)

Fave Five (11/11/2016)

Our Fave Five essentially represents a listing of stocks with favorable short term total return forecasts (1 year, according to Analyst Consensus Estimates, or ACE) combined with strong long-term return forecasts and good/excellent quality rankings.

The Fave Five This Week

  • FleetCor (FLT)
  • Gildan Activewear (GIL)
  • Rocky Mountain Chocolate Factory (RMCF)
  • Silicon Motion (SIMO)
  • STERIS (STE)

The Long and Short of This Week’s Fave Five

The Long & Short. (November 11, 2016) Projected Annual Return (PAR): Long term return forecast based on fundamental analysis and five year time horizon. Quality Ranking: Percentile ranking of composite that includes financial strength, earnings stability and relative growth & profitability. VL Low Total Return (VLLTR): Low total return forecast based on 3-5 year price targets via Value Line Investment Survey. Morningstar P/FV: Ratio of current price to fundamentally-based fair value via www.morningstar.com S&P P/FV: Current price-to-fair value ratio via Standard & Poor’s. 1-Year ACE Outlook: Total return forecast based on analyst consensus estimates for 1-year target price combined with current yield. The data is ranked (descending order) based on this criterion. 1-Year S&P Outlook: 1-year total return forecast based on S&P 1-year price target. 1-Yr GS: 1-year total return forecast based on most recent price target issued by Goldman Sachs.

Weekend Warriors

The relative/excess return for the Weekend Warrior tracking portfolio is +4.5% since inception. 50.7% of selections have outperformed the Wilshire 5000 since original selection.

Tracking Dashboard: https://www.manifestinvesting.com/dashboards/public/weekend-warriors

Fave Five (11/4/2016)

Fave Five (11/4/2016)

Our Fave Five essentially represents a listing of stocks with favorable short term total return forecasts (1 year, according to Analyst Consensus Estimates, or ACE) combined with strong long-term return forecasts and good/excellent quality rankings.

Every year, we remind investors to focus on small company opportunities in the final quarter of the year. Tax-related selling can often provide outsized opportunities — a condition that is amplified among the faster-growing and promising smaller companies. We used to urge investors to carefully mine the Forbes List of Best Small Companies that was published in late October for 36 years. Unfortunately, Forbes discontinued the feature last year. Fret not. We’ll be out with our own list of 40 Best Small Companies soon (final edits in progress.) The 2016 collection performed very well for the second straight year.

The Fave Five This Week

This week we’re taking a detour to feature the five companies at the top of our 40 Best Small Companies for 2017. As shown here, the 2016 collection outdistanced the Wilshire 5000 by a considerable margin — beating the total stock market for the 8th time in 11 years with an excess/relative return since inception of +4.6%.

  • Forward Air (FWRD)
  • Mercadolibre (MELI)
  • Meridian Bioscience (VIVO)
  • Mesa Labs (MLAB)
  • Neogen (NEOG)

Context: The median S&P price to fair value ratio is 102%.

The Long and Short of This Week’s Fave Five

The Long & Short. (November 4, 2016) Projected Annual Return (PAR): Long term return forecast based on fundamental analysis and five year time horizon. Quality Ranking: Percentile ranking of composite that includes financial strength, earnings stability and relative growth & profitability. VL Low Total Return (VLLTR): Low total return forecast based on 3-5 year price targets via Value Line Investment Survey. Morningstar P/FV: Ratio of current price to fundamentally-based fair value via www.morningstar.com S&P P/FV: Current price-to-fair value ratio via Standard & Poor’s. 1-Year ACE Outlook: Total return forecast based on analyst consensus estimates for 1-year target price combined with current yield. The data is ranked (descending order) based on this criterion. 1-Year S&P Outlook: 1-year total return forecast based on S&P 1-year price target. 1-Yr GS: 1-year total return forecast based on most recent price target issued by Goldman Sachs.

Weekend Warriors

The relative/excess return for the Weekend Warrior tracking portfolio is +4.0% since inception. 52.5% of selections have outperformed the Wilshire 5000 since original selection.

Tracking Dashboard: https://www.manifestinvesting.com/dashboards/public/weekend-warriors

Fave Five (10/28/2016)

Fave Five (10/28/2016)

Our Fave Five essentially represents a listing of stocks with favorable short term total return forecasts (1 year, according to Analyst Consensus Estimates, or ACE) combined with strong long-term return forecasts and good/excellent quality rankings.

So you’re looking at the stocks in the top 1% of all companies according to MANIFEST Rank (Return Forecast and Quality combination) that have the lowest price-to-fair value ratios (P/FV) according to S&P. The P/FV profile for the S&P Platinum Portfolio is shown here:

The Fave Five This Week

  • Abbvie (ABBV)
  • Celgene (CELG)
  • Deckers (DECK)
  • LKQ Corp (LKQ)
  • Stericycle (SRCL)

Context: The median S&P price to fair value ratio is 102%.

The Long and Short of This Week’s Fave Five

The Long & Short. (October 28, 2016) Projected Annual Return (PAR): Long term return forecast based on fundamental analysis and five year time horizon. Quality Ranking: Percentile ranking of composite that includes financial strength, earnings stability and relative growth & profitability. VL Low Total Return (VLLTR): Low total return forecast based on 3-5 year price targets via Value Line Investment Survey. Morningstar P/FV: Ratio of current price to fundamentally-based fair value via www.morningstar.com S&P P/FV: Current price-to-fair value ratio via Standard & Poor’s. 1-Year ACE Outlook: Total return forecast based on analyst consensus estimates for 1-year target price combined with current yield. The data is ranked (descending order) based on this criterion. 1-Year S&P Outlook: 1-year total return forecast based on S&P 1-year price target. 1-Yr GS: 1-year total return forecast based on most recent price target issued by Goldman Sachs.

Weekend Warriors

The relative/excess return for the Weekend Warrior tracking portfolio is +8.7% since inception. 42.6% of selections have outperformed the Wilshire 5000 since original selection.

Tracking Dashboard: https://www.manifestinvesting.com/dashboards/public/weekend-warriors

Fave Five (10/21/2016)

Fave Five (10/21/2016)

Our Fave Five essentially represents a listing of stocks with favorable short term total return forecasts (1 year, according to Analyst Consensus Estimates, or ACE) combined with strong long-term return forecasts and good/excellent quality rankings.

So you’re looking at the stocks in the top 1% of all companies according to MANIFEST Rank (Return Forecast and Quality combination) that have the highest 1-year total return forecasts according to the analyst consensus estimates. (ACE)

The Fave Five This Week

  • Air Lease (AL)
  • Celgene (CELG)
  • Cognizant Technology (CTSH)
  • Novo Nordisk (NVO)
  • Universal Display (OLED)

Context: The median 1-year return forecast (ACE) is 10.6%.

The Long and Short of This Week’s Fave Five

The Long & Short. (October 21, 2016) Projected Annual Return (PAR): Long term return forecast based on fundamental analysis and five year time horizon. Quality Ranking: Percentile ranking of composite that includes financial strength, earnings stability and relative growth & profitability. VL Low Total Return (VLLTR): Low total return forecast based on 3-5 year price targets via Value Line Investment Survey. Morningstar P/FV: Ratio of current price to fundamentally-based fair value via www.morningstar.com S&P P/FV: Current price-to-fair value ratio via Standard & Poor’s. 1-Year ACE Outlook: Total return forecast based on analyst consensus estimates for 1-year target price combined with current yield. The data is ranked (descending order) based on this criterion. 1-Year S&P Outlook: 1-year total return forecast based on S&P 1-year price target. 1-Yr GS: 1-year total return forecast based on most recent price target issued by Goldman Sachs.

Weekend Warriors

The relative/excess return for the Weekend Warrior tracking portfolio is +12.9% since inception. 42.6% of selections have outperformed the Wilshire 5000 since original selection.

Tracking Dashboard: https://www.manifestinvesting.com/dashboards/public/weekend-warriors

Fave Five (10/14/2016)

Fave Five (10/14/2016)

Our Fave Five essentially represents a listing of stocks with favorable short term total return forecasts (1 year, according to Analyst Consensus Estimates, or ACE) combined with strong long-term return forecasts and good/excellent quality rankings.

So you’re looking at the stocks in the top 1% of all companies according to MANIFEST Rank (Return Forecast and Quality combination) that have the highest 1-year total return forecasts according to the analyst consensus estimates. (ACE)

The Fave Five This Week

  • Aaron’s Rents (AAN)
  • Celgene (CELG)
  • Cognizant Technology (CTSH)
  • Novo Nordisk (NVO)
  • Universal Display (OLED)

Context: The median 1-year return forecast (ACE) is 9.9%.

The Long and Short of This Week’s Fave Five

The Long & Short. (October 14, 2016) Projected Annual Return (PAR): Long term return forecast based on fundamental analysis and five year time horizon. Quality Ranking: Percentile ranking of composite that includes financial strength, earnings stability and relative growth & profitability. VL Low Total Return (VLLTR): Low total return forecast based on 3-5 year price targets via Value Line Investment Survey. Morningstar P/FV: Ratio of current price to fundamentally-based fair value via www.morningstar.com S&P P/FV: Current price-to-fair value ratio via Standard & Poor’s. 1-Year ACE Outlook: Total return forecast based on analyst consensus estimates for 1-year target price combined with current yield. The data is ranked (descending order) based on this criterion. 1-Year S&P Outlook: 1-year total return forecast based on S&P 1-year price target. 1-Yr GS: 1-year total return forecast based on most recent price target issued by Goldman Sachs.

Weekend Warriors

The relative/excess return for the Weekend Warrior tracking portfolio is +9.8% since inception. 44.3% of selections have outperformed the Wilshire 5000 since original selection.

Tracking Dashboard: https://www.manifestinvesting.com/dashboards/public/weekend-warriors

Fave Five (10/7/2016)

Fave Five (10/7/2016)

Our Fave Five essentially represents a listing of stocks with favorable short term total return forecasts (1 year, according to Analyst Consensus Estimates, or ACE) combined with strong long-term return forecasts and good/excellent quality rankings.

So you’re looking at the stocks in the top 1% of all companies according to MANIFEST Rank (Return Forecast and Quality combination) that have the highest 1-year total return forecasts according to the analyst consensus estimates. (ACE)

The Fave Five This Week

  • Cognizant Technology (CTSH)
  • CVS Health (CVS)
  • Hain Celestial (HAIN)
  • Novo Nordisk (NVO)
  • Simulations Plus (SLP)

Context: The median 1-year return forecast (ACE) is 9.6%.

The Long and Short of This Week’s Fave Five

The Long & Short. (October 7, 2016) Projected Annual Return (PAR): Long term return forecast based on fundamental analysis and five year time horizon. Quality Ranking: Percentile ranking of composite that includes financial strength, earnings stability and relative growth & profitability. VL Low Total Return (VLLTR): Low total return forecast based on 3-5 year price targets via Value Line Investment Survey. Morningstar P/FV: Ratio of current price to fundamentally-based fair value via www.morningstar.com S&P P/FV: Current price-to-fair value ratio via Standard & Poor’s. 1-Year ACE Outlook: Total return forecast based on analyst consensus estimates for 1-year target price combined with current yield. The data is ranked (descending order) based on this criterion. 1-Year S&P Outlook: 1-year total return forecast based on S&P 1-year price target. 1-Yr GS: 1-year total return forecast based on most recent price target issued by Goldman Sachs.

Weekend Warriors

The relative/excess return for the Weekend Warrior tracking portfolio is +7.3% since inception. 44.1% of selections have outperformed the Wilshire 5000 since original selection.

Tracking Dashboard: https://www.manifestinvesting.com/dashboards/public/weekend-warriors

Fave Five (9/23/2016)

Fave Five (9/23/2016)

Our Fave Five essentially represents a listing of stocks with favorable short term total return forecasts (1 year, according to Analyst Consensus Estimates, or ACE) combined with strong long-term return forecasts and good/excellent quality rankings.

So you’re looking at the stocks in the top 1% of all companies according to MANIFEST Rank (Return Forecast and Quality combination) that have the highest 1-year total return forecasts according to the analyst consensus estimates. (ACE)

The Fave Five This Week

  • Celgene (CELG)
  • Extra Space Storage (EXR)
  • Honda (HMC)
  • Stericycle (SRCL)
  • Ulta Salons (ULTA)

Context: The average 1-year total return forecast for the Value Line 1700 is 14.7%. The average 5-year return forecast for $VLE is 5.0% (annualized).

This Week’s Fave Five In The Sweet Spot

Sweet Spot Five. (September 23, 2016) Projected Annual Return (PAR): Long term return forecast based on fundamental analysis and five year time horizon. Quality Ranking: Percentile ranking of composite that includes financial strength, earnings stability and relative growth & profitability.

Weekend Warriors

The relative/excess return for the Weekend Warrior tracking portfolio is +6.3% since inception. 54.1% of selections have outperformed the Wilshire 5000 since original selection.

Tracking Dashboard: https://www.manifestinvesting.com/dashboards/public/weekend-warriors