
Fave Five (9/8/2017)
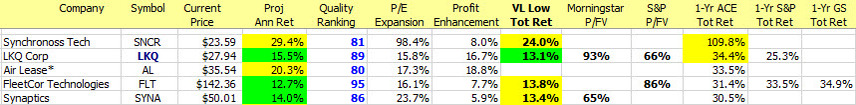
Our Fave Five essentially represents a listing of stocks with favorable short term total return forecasts (1 year, according to Analyst Consensus Estimates, or ACE) combined with strong long-term return forecasts and good/excellent quality rankings. The average 1-year ACE total return forecast is 10.6%.
Our Favorite Bubbles …
… just might be the kind of bubbles that evolve when we blend Ivory Soap with Irish Spring. Hugh McManus likes to shop for opportunities among stocks that are trading near their 52-week lows and for non-core case studies, he’ll sometimes demand that the stock prices be near multi-year lows. Part of the driver behind this is the recognition that there’s often a large difference between 52-week highs and 52-week lows, even for some of the bluer chip established stocks. Isolating opportunities to invest when stocks are in the lower part of those annual ranges would seem to provide a margin of safety and reduce some of the downside … and “all things created equal” why should we shop anywhere else. (Read that in an Irish brogue for full effect.)
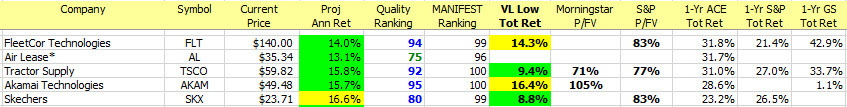
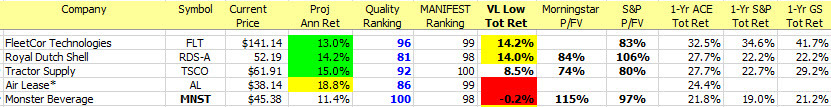
The five stocks flagged this week are repeat selections for the Fave Five tracking portfolio and as the parade of second opinions shows — there’s largely some consensus about expectations. FleetCor (FLT), Starbucks (SBUX) and Ulta Beauty (ULTA) also popped up as high-quality stocks with relatively outsized return potential in Ken Kavula’s review of the Forbes Most Innovative Companies. Gentex (GNTX) has also been a Round Table favorite with stellar performance over the years and Akamai Technologies (AKAM) has been featured as a worthy exploration consistent with the growing need for cyber security.
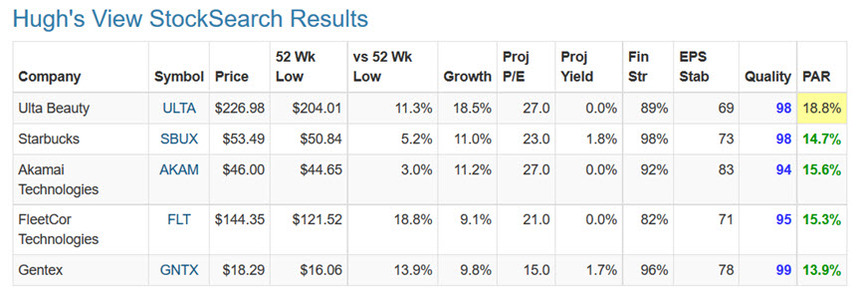
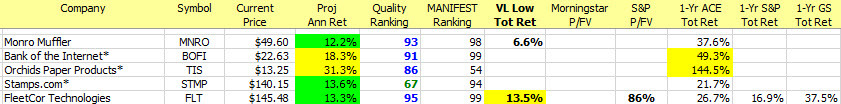
StockSearch Results using the stock screener at www.manifestinvesting.com with the following criteria: Manifest Rank (percentile ranking based on combination of quality and long term return forecast) greater than 99.44% — or top 1/2 of top percentile of all stocks covered, Financial Strength > B++ (70%) and stocks within 20% of their 52-week low.
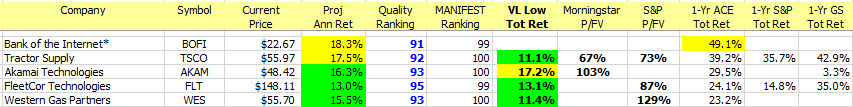
The Long and Short of This Week’s Fave Five
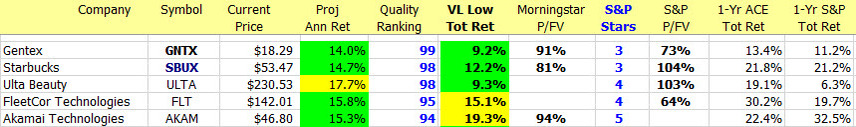
The Long & Short. (September 8, 2017) Projected Annual Return (PAR): Long term return forecast based on fundamental analysis and five year time horizon. Quality Ranking: Percentile ranking of composite that includes financial strength, earnings stability and relative growth & profitability. VL Low Total Return (VLLTR): Low total return forecast based on 3-5 year price targets via Value Line Investment Survey. Morningstar P/FV: Ratio of current price to fundamentally-based fair value via www.morningstar.com S&P P/FV: Current price-to-fair value ratio via Standard & Poor’s. 1-Year ACE Outlook: Total return forecast based on analyst consensus estimates for 1-year target price combined with current yield. The data is ranked (descending order) based on this criterion. 1-Year S&P Outlook: 1-year total return forecast based on S&P 1-year price target. 1-Yr GS: 1-year total return forecast based on most recent price target issued by Goldman Sachs.
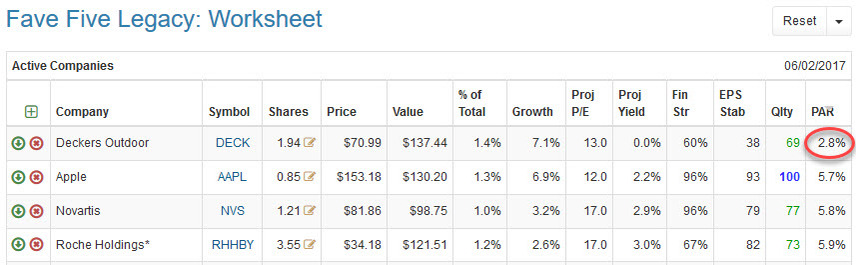
Fave Five Legacy (Tracking Portfolio)
The relative/excess return for the Fave Five tracking portfolio is +2.3% since inception.
The absolute annualized rate of return is 15.3%.
Tracking Dashboard: https://www.manifestinvesting.com/dashboards/public/fave-five


