Our Fave Five essentially represents a listing of stocks with favorable short term total return forecasts (1 year, according to Analyst Consensus Estimates, or ACE) combined with strong long-term return forecasts and good/excellent quality rankings. The average 1-year ACE total return forecast is 8.8%.
This week we return to the triple play screening method for our five favorites. The triple play possibility occurs when you find a stock that is very depressed in price and also appears to be on the verge of substantially boosting its profit margins. The triple play effect is possible in that:
(1) The depressed price of the stock can return to normal levels;
(2) increased profit margins can produce increased EPS and a higher price;
(3) may also cause higher P/E ratios, or P/E expansion.
The Fave Five This Week
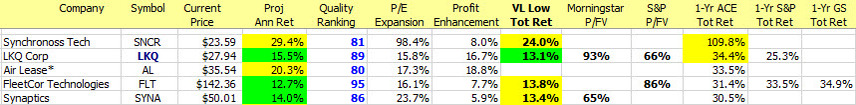
Air Lease (AL)
FleetCor (FLT)
LKQ (LKQ)
Synaptics (SYNA)
Synchronoss Tech (SNCR)
The Long and Short of This Week’s Fave Five
The Long & Short.(April 14, 2017)Projected Annual Return (PAR): Long term return forecast based on fundamental analysis and five year time horizon. Quality Ranking: Percentile ranking of composite that includes financial strength, earnings stability and relative growth & profitability. VL Low Total Return (VLLTR): Low total return forecast based on 3-5 year price targets via Value Line Investment Survey.Morningstar P/FV: Ratio of current price to fundamentally-based fair value via www.morningstar.comS&P P/FV: Current price-to-fair value ratio via Standard & Poor’s. 1-Year ACE Outlook: Total return forecast based on analyst consensus estimates for 1-year target price combined with current yield. The data is ranked (descending order) based on this criterion. 1-Year S&P Outlook: 1-year total return forecast based on S&P 1-year price target. 1-Yr GS: 1-year total return forecast based on most recent price target issued by Goldman Sachs.
Fave Five Legacy (Tracking Portfolio)
The relative/excess return for the Fave Five tracking portfolio is +1.0% since inception. 49.5% of selections have outperformed the Wilshire 5000 since original selection.
Attics, Launch Pads & Minefields? It’s Finviz time as we use the free online resource to discover some companies with elevated 1-year total return forecasts and end up with a bolstering update on AmTrust Financial (AFSI) and newcomers ConnectOne (CNOB) and Horizon Pharma (HZNP). Synchronoss Tech (SNCR) is a repeat selection.
Fave Five (3/24/2017)
Our Fave Five essentially represents a listing of stocks with favorable short term total return forecasts (1 year, according to Analyst Consensus Estimates, or ACE) combined with strong long-term return forecasts and good/excellent quality rankings. The average 1-year ACE total return forecast is 7.8%.
This week we went shopping for study opportunities using Finviz.com. Using the target price function, the hunt was on for companies with huge 52-week total return expectations. It’s part Matt Spielman rummaging in the speculative attic, part Broad Assets investment club scouring the launch pad and part minefield.
The Fave Five This Week
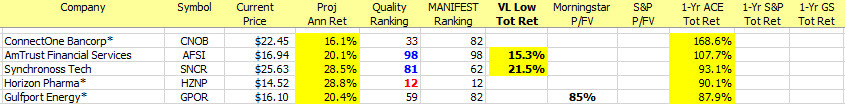
AmTrust Financial (AFSI)
ConnectOne Bancorp (CNOB)
Gulfport Energy (GPOR)
Horizon Pharma (HZNP)
Synchronoss Technology (SNCR)
The Long and Short of This Week’s Fave Five
The Long & Short.(March 24, 2017)Projected Annual Return (PAR): Long term return forecast based on fundamental analysis and five year time horizon. Quality Ranking: Percentile ranking of composite that includes financial strength, earnings stability and relative growth & profitability. VL Low Total Return (VLLTR): Low total return forecast based on 3-5 year price targets via Value Line Investment Survey.Morningstar P/FV: Ratio of current price to fundamentally-based fair value via www.morningstar.comS&P P/FV: Current price-to-fair value ratio via Standard & Poor’s. 1-Year ACE Outlook: Total return forecast based on analyst consensus estimates for 1-year target price combined with current yield. The data is ranked (descending order) based on this criterion. 1-Year S&P Outlook: 1-year total return forecast based on S&P 1-year price target. 1-Yr GS: 1-year total return forecast based on most recent price target issued by Goldman Sachs.
Fave Five Legacy (Tracking Portfolio)
The relative/excess return for the Fave Five tracking portfolio is +0.6% since inception. (The absolute rate of return is 15.9%.) 47.5% of selections have outperformed the Wilshire 5000 since original selection.
Our Fave Five essentially represents a listing of stocks with favorable short term total return forecasts (1 year, according to Analyst Consensus Estimates, or ACE) combined with strong long-term return forecasts and good/excellent quality rankings. The average 1-year ACE total return forecast is 6.9%.
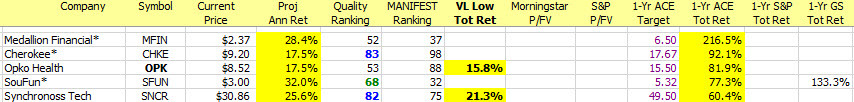
We usually limit the search results to good or excellent quality stocks, but we occasionally remove the shackles. We do it less often when return forecasts are near historical lows … but nonetheless, this “bottom fishing” gives us some positions to monitor that we’d not normally explore. And we get to see how they do in the tracking portfolio. With the overall weighted-average quality high enough, we can tolerate some “adventure” in the overall jigsaw puzzle.
And lest you think we’ve lost our bearings, we still insist on a quality ranking in at least the 50th percentile. (We would probably go lower if return forecasts were higher.)
The Fave Five This Week
Cherokee (CHKE)
Medallion Financial (MFIN)
Opko Health (OPK)
SouFun (SFUN)
Synchronoss Technology (SNCR)
The Long and Short of This Week’s Fave Five
The Long & Short.(February 24, 2017)Projected Annual Return (PAR): Long term return forecast based on fundamental analysis and five year time horizon. Quality Ranking: Percentile ranking of composite that includes financial strength, earnings stability and relative growth & profitability. VL Low Total Return (VLLTR): Low total return forecast based on 3-5 year price targets via Value Line Investment Survey.Morningstar P/FV: Ratio of current price to fundamentally-based fair value via www.morningstar.comS&P P/FV: Current price-to-fair value ratio via Standard & Poor’s. 1-Year ACE Outlook: Total return forecast based on analyst consensus estimates for 1-year target price combined with current yield. The data is ranked (descending order) based on this criterion. 1-Year S&P Outlook: 1-year total return forecast based on S&P 1-year price target. 1-Yr GS: 1-year total return forecast based on most recent price target issued by Goldman Sachs.
Fave Five Legacy (Tracking Portfolio)
The relative/excess return for the Fave Five tracking portfolio is +0.3% since inception. 53.1% of selections have outperformed the Wilshire 5000 since original selection.
The subtle, even stealthy, deterioration of fundamentals continues. There’s a fair amount of slippage in the long-term forecasts. As we’ve been saying, it will be interesting when the 2015 estimates begin rolling and Value Line ratchets their 3-5 year forecasts to the next year. Top 40 regulars Pepsi (PEP) and Coca-Cola (KO) continue to be compelling studies during these times of reduced long-term forecasts.
Materially Stronger: Apollo Group (APOL), Spartan Stores (SPTN)
One of the reasons that we do this is that sometimes we discover a really great pumpkin.
There are no guarantees … and the Great Pumpkin doesn’t seem to come every year. But our relentless emphasis on the quest for high-quality companies with promise that seem to offering superior long-term returns is never dull. And it can be rewarding. As a case in point, we’ve featured United Electronics (UEIC) a couple of times over the few years of quarterly updates. It’s a stock that Ken Kavula frequently mentioned with respect to his investment club, his Groundhog (stock picking contest portfolio), educational sessions … and he mentioned it often during 2008 and early 2009 at price levels of $12-15.
Earlier this year, with UEIC at $18.82 … we suggested that while locating the remote for the Super Bowl that we also study and consider the company. See: Seen The Remote?. UEIC is up 104.6% since January. We mentioned it again at $16.85 during the 4/23/2012 weekly update batch.
They don’t always work out that way. And we’re interested in the pumpkin patch versus isolated incidents, successful and not-so-successful. What does it all add up to? In future updates, we’ll start tracking some of the long-term results achieved by the companies in this weekly presentation of quarterly updates. Leaning on the positive relative returns of your most widely-followed MANIFEST 40, Solomon Select, Tin Cup and other demonstrations like the BareNaked Million, we think we’re going to like this pie.
(By the way, the BareNaked Million — $1,000,000 invested in a relatively passive portfolio back in December 2006 — topped $2,000,000 last week.) Huzzah!
Companies of Interest
The pumpkin pickins are actually a little slim. The average Value Line low total return forecast for the Issue 10 group is 3.9% — matching the Value Line universe of approximately 1700 stocks. But there are some worthy growth and return studies in the patch.
Calavo Growers (CVGW) was among the Forbes Best Small Companies for 2013. The quality ranking and return forecast merit a closer look. Synchronoss Technology is back (again) and we’ll take a closer look at this company this week. Strayer Education (STRA) just might be an opportunity to explore painful lessons learned by long-term investors (specifically, me) if I can muster the courage to talk about it.
Materially Weaker: RealD (RLD), Corinthian Colleges (COCO), The Pantry (PTRY)
Market Barometers
The median Value Line low total return forecast (VLLTR) is 3.9%, down from 4.0% last week.
This is a multi-year low for this indicator … at least the lowest level on the accompanying chart, so we’ll take a look at a more extensive parade of market barometers this week.
We start Market Barometer roll call with our median return projection (MIPAR). This parameter is a “first cousin” of VLLTR, but includes a wider berth of stocks — some 2400 in total and will generally include a few more smaller companies. The long-term return forecast is now 5.6%, still slightly above the historical lows reached back around Halloween 2007.
Checking in on the overall trends of the Wilshire 5000 (VTSMX), we find it relatively overbought (RSI = 77.9) with the caveat that markets (and individual stocks) can remain relatively overbought for a long, long time. We also note that the 12-month change for VTSMX is now 28.2%! The pins-and-needles are a whole lot easier to take when momentum is solid. Again we suggest that the momentum indicator (ROC) back in the 2004-2007 time frame provided “cover” during a period when the market was frothy for an extended period. There’s a substantial dose of “covering momentum” under current conditions. If that breeches 0% — as it did circa Halloween 2007, we’ll sound the alarm for DefCon 2 (at least.)
We use the overall New Highs vs. New Lows ($USHL) long-term trend as another confirming indicator. Again, check out the sub-zero trend back at Halloween 2007 and compare versus current healthy levels.
Morningstar provides a price-to-fair value (P/FV) ratio on their universe of covered stocks. For more, see: http://www.morningstar.com/market-valuation/market-fair-value-graph.aspx This is even more reinforcement. Note the 114% P/FV ratio back in the middle of that long period of overbought stocks. Stocks (and markets) can get significantly overbought during periods when they’re generally overbought for extended periods.
Sam Stovall of Standard & Poors recently suggested that a case could be made for an overall market price-to-fair value of 1742.92/1820 or 96%.
Investors in capital preservation mode should take note that the Value Line recommended asset allocation to cash/cash equivalents is relatively high at 40% — holding at levels suggested since July 2013, a sign that Value Line analysts believe the market is vulnerable to a significant correction.
If there’s a chance that the Transports (yes, channeling some Dow Theory) could be an early warning system … there’s no sign of a current alarm:
Taking a look at some specific Transports, the overall average is still pretty close to the median market return with relatively few signs of weakness. The return forecast on FedEx (FDX) is a little weak (PAR = 1.7%, RSI = 75.7% and 12-month ROC = 39%) consistent with an overheated trailing 12-months. We’ll be watching for incremental strengthening in fundamentals for FDX with the next update.
There’s been no shortage of articles shoveling dirt on the consumer in recent days and weeks. With an RSI of 84 (overbought) it’s easy to see why. Many of these stocks are probably vulnerable (temporarily overbought) and it’s a self-esteem opportunity for some pundit, talking head or financial journalist when one of them — or a couple of them — take a 20% smackdown. But it’s the long-term that matters, and there’s considerable momentum here in the face of some widespread de-leveraging by American consumers.
Bottom Line
The market and many individual stocks are overbought, in some cases temporarily overbought … and the fundamentals continue to weaken slightly while stock prices trudge ahead. Based on the momentum trends shown in some of our favorite indicators, we’ll be unsurprised by corrections. The stocks and market are vulnerable to some speed bumps. And we’ll be watching for any breakdown in the $USHL indicator. For now, seek the highest-quality stocks in the pumpkin patch and avoid settling for lackluster return forecasts. Those in capital preservation mode might consider selling lower-quality stocks with return forecasts less than MIPAR for sources of funds and elevate your cash equivalent component. For the young and adventuresome, or those well beyond “critical mass”, shop in earnest and let us know if you discover any Great Pumpkin opportunities!
Again we see what a difference a week makes … some of the food-related companies hold down the Materially Stronger fort — but keep in mind that Zhongpin (HOGS) is likely on its way to going private at $13.50.
Educational Services once again provides us with the usual list of suspects as the industry continues to get shellacked. Notable by their absence from the Materially Weaker list are DeVry (DV) and Strayer Education (STRA). Perhaps the triage is starting to take hold?
Materially Weaker: Career Education (CECO), ITT Educational Services (ESI), Apollo Group (APOL), Corinthian Colleges (COCO), Hitachi (HTHIY), Dole Foods (DOLE)
Market Barometers
The Value Line low total return forecast is 6.8%, compared to 6.8% last week.