Fave Five: Gone Irish (3/17/2017)

Fave Five (3/14/2017)

Our Fave Five essentially represents a listing of stocks with favorable short term total return forecasts (1 year, according to Analyst Consensus Estimates, or ACE) combined with strong long-term return forecasts and good/excellent quality rankings. The average 1-year ACE total return forecast is 7.1%.

The Fave Five This Week

  • Boston Beer (SAM)
  • Exxon Mobil (XOM)
  • LKQ Corp (LKQ)
  • Perrigo (PRGO)
  • Target (TGT)

Gone Shopping With Walter (Schloss) and Hugh

“When buying a stock, I find it helpful to buy near the low of the past few years. A stock may go as high as 125 and then decline to 60 and you think it attractive. 3 years before the stock sold at 20 which shows that there is some vulnerability in it.” — Walter Schloss

“…the analyst interested in value is likely to place only minor emphasis upon the short term earnings outlook; whereas the analyst who endeavors to anticipate the price movements of the near future will make such outlook his major concern.” —
Ben Graham, Security Analysis

Hugh McManus has been a regular — and very successful stock selector — as a participant in our monthly Round Table series over the last eight years or so. Even in the months when he’s globe trotting and unable to join us, we’ll generally take a quick look for opportunities with a quick stock screen for high quality companies priced near their 52-week (or multi-year) lows. For more on this subject, see: Gone Fishing — Patiently and Disciplined Fishing

If a company is primed for long-term growth, buying it when the price is depressed is better than buying it when it’s at a 52-week high. If the stock price drops to a new low, there’s always bad news to explain the fall, which is one of those obvious truths. I had to learn whether I wanted to fixate on the bad news or focus on the low price of a good company. Most people seem to be transfixed by the news. I take it one step further and hope the bad news persists for a while — it’s where the psychiatrist would step in — as it allows me to buy more.

In 1997, or thereabouts, Ken “Mr. NAIC” Janke, commented that members of the organization were masterful at identifying quality companies, but not nearly as good at picking a low price. I had already adopted the practice of buying companies when they reached or were close to a 52-week low. It’s a rule not a law: for an idealized growth company, today’s close is the new 52-week low.

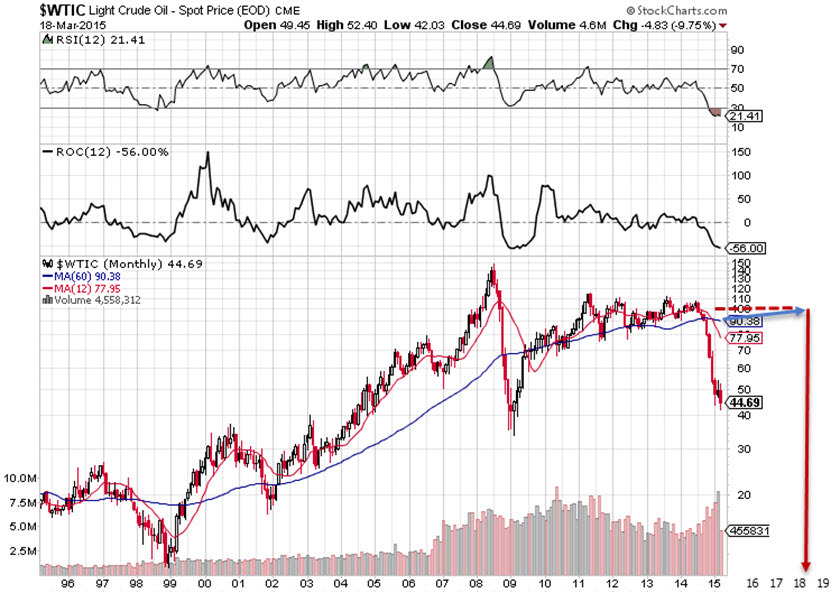
Ken Janke often spoke of the reality between the high and low prices during a given year for virtually all companies. The range is bigger than most people realize, as underscored by the accompanying chart via Saber Capital Management and John Huber.

Patience is genius in disguise.

The Discipline of Time Arbitrage. Time arbitrage is being willing to maintain a 3-5 year time horizon when most investors
and analysts are thinking about the next quarter. [This represents] a willingness to buy stocks that others are selling for short-term reasons. Many market participants want/need short-term results and so focus is on things like: Catalysts, short-term expectations, quarterly results …

Why Does This Work? Focusing on the long-term is difficult because:

  • Takes patience — There can be periods of under performance.
  • Most investors (clients) want results quarterly, or at least yearly, and so most money managers try to accommodate these short-term demands. (i.e. who cares what Apple looks like in 3 years, how many iphones are they going to sell this quarter??)
  • Short-term thinking (among investors, fund managers, and corporate management teams) is pervasive now, and the speed of technology and information probably intensifies this view.

All of these decisions being made for short-term reasons creates opportunity (and the biggest market inefficiency in my opinion) for those who can look out 2-3 years. Source: Saber Capital Management

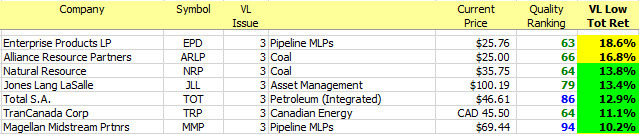
StockSearch Results: Hugh’s Hunt For 52 Week Lows. Hugh maintains a short list of vetted stocks, most of which he has been a long term shareholder. He monitors for accumulation opportunities when one of his favorites approaches a 52-week low. For the screening results shown, we’ve limited the field to high-quality (excellent) stocks that are within 5% of their 52-week low, while demanding above average financial strength. [Source: www.manifestinvesting.com StockSearch, 3/17/2017.]

The Long and Short of This Week’s Fave Five

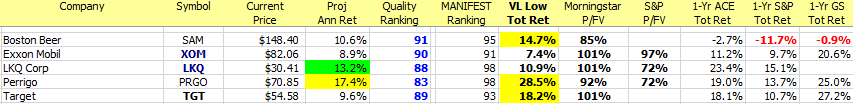
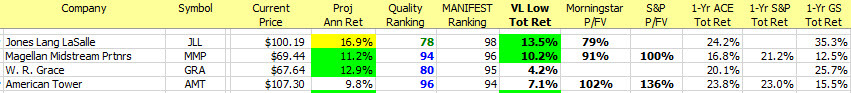
The Long & Short. (March 17, 2017) Projected Annual Return (PAR): Long term return forecast based on fundamental analysis and five year time horizon. Quality Ranking: Percentile ranking of composite that includes financial strength, earnings stability and relative growth & profitability. VL Low Total Return (VLLTR): Low total return forecast based on 3-5 year price targets via Value Line Investment Survey. Morningstar P/FV: Ratio of current price to fundamentally-based fair value via www.morningstar.com S&P P/FV: Current price-to-fair value ratio via Standard & Poor’s. 1-Year ACE Outlook: Total return forecast based on analyst consensus estimates for 1-year target price combined with current yield. The data is ranked (descending order) based on this criterion. 1-Year S&P Outlook: 1-year total return forecast based on S&P 1-year price target. 1-Yr GS: 1-year total return forecast based on most recent price target issued by Goldman Sachs.

Fave Five Legacy (Tracking Portfolio)

The relative/excess return for the Fave Five tracking portfolio is +0.8% since inception. (The absolute rate of return is 19.0%.) 48.5% of selections have outperformed the Wilshire 5000 since original selection.

Tracking Dashboard: https://www.manifestinvesting.com/dashboards/public/fave-five

Analysis Across The Chasm

This excerpt is an example of our weekly update for subscribers where we share observations on the analysis update batch for the week and tackle issues of relevance for long term investors.  Subscribe or launch a test drive.  For more info:  https://expectingalpha.com/about/

This Week at MANIFEST (12/2/2016)

“An hour with a book would have brought to your mind,
The secret that took the whole year to find;
The facts that you learned at enormous expense,
Were all on a library shelf to commence.” — via Ted Brooks and Audels Handbook for Mechanics

“My advice is read everything you can.” — Warren Buffett

This week’s update batch includes a number of cyclicals including some of the leaders from the oil patch. Subscribers and Round Table participants have sometimes wondered about the selection of companies like BP (BP) by Hugh McManus. Like a good book, sometimes a modified or evolving perspective is required to put less traditional selections in context. So far as books go, for this topic we’d urge some consideration of Peter Lynch and the Magellan track record investing in cyclical companies. Hugh has the highest relative/excess return, since inception, for all Round Table participants. As always, it’s not for beginners but the rewards can be outsized…

Analysis Across The Chasm

During our stock studies, we are sometimes confronted with a Kobayashi Maru, a test that seems to defy a solution. The last time we remember seeing this on a fairly widely spread basis was while attempting to do stock studies during the Great Recession of 2008-2009.

The Kobayashi Maru is a training exercise in the Star Trek universe designed to test the character of Starfleet Academy cadets in a no-win scenario. The Kobayashi Maru test was first depicted in the opening scene of the film Star Trek II: The Wrath of Khan and also appears in the 2009 film Star Trek. The test’s name is occasionally used among Star Trek fans or those familiar with the series to describe a no-win scenario, a test of one’s character or a solution that involves redefining the problem.

Recessions and large speed bumps wreck SSG-based trend analysis. Ken Kavula and I were faced with challenging studies much more frequently during the Great Recession.

Cyclicals are challenging. Sometimes a 10-year visual analysis isn’t enough to build an image and understanding of long-term growth. We advise beginning investors to avoid companies like this. The price collapses can be catastrophic as economic cycles unfold. But Peter Lynch suggested that significant rewards await experienced investors who can pass the seemingly no-win scenario test. It is in this context that Hugh McManus chooses companies like Bank of America (BAC) … [Yes, Virginia, financial sector stocks are often quite cyclical] … BP (BP) and Conoco Phillips (COP).

Hugh has chosen a number of these companies for the Round Table tracking portfolio. It is worth noting that Hugh has the highest relative return among all participants and contributors. His time horizon is truly massive and he seeks opportunities that are, in Cy’s words, “more temporary than terminal.” He invested in BP (BP) as the leak in the Gulf was dominating the news cycle.

The rhinos (Wall Street analysts and institutions) overreact. Period. In the case of Petroleum (Integrated) companies, I wouldn’t be surprised to see that 2020 actual result more closely match the trend line shown in the accompanying figure. Sometimes, experienced investors simply have to look across the chasm — imagine what it may be like on “on the other side.”

Captain James T. Kirk, as a cadet, was victorious in a No-Win scenario by changing the rules. He reprogrammed the simulation. When faced with a chasm, sometimes you just gotta invest like Captain Kirk.
.

MANIFEST 40 Updates

  • 14. Exxon Mobil (XOM)

Round Table Stocks

  • BP plc (BP)
  • Conoco-Philips (COP)

Best Small Companies

(None)

Results, Remarks & References

Companies of Interest: Value Line (12/2/2016)

The average Value Line low total return forecast for the companies in this week’s update batch is 4.5% vs. 3.5% for the Value Line 1700 ($VLE).

Attrition (reduction in long term forecasts) seems to have abated a bit for this batch of Value Line updates but remember this is a challenging and cyclical minefield of companies (in general) … shop carefully. There are very few widely-followed or Round Table companies on this week’s menu.

Materially Stronger: Joy Global (JOY) 1, Chemours (CC)

Materially Weaker: Southwestern Energy (SWN), Energy Trans Partners (ETP)

Discontinued: Questar (STR), Infoblox (BLOX), AMN Healthcare (AHS), Rackspace (RAX), Monster Worldwide (MWW)

1 Joy Global (JOY) to be acquired by Komatsu in mid-2017.

Market Barometers

Value Line Low Total Return (VLLTR) Forecast. The long-term low total return forecast for the 1700 companies featured in the Value Line Investment Survey is 3.5%, down from 4.3% last week. For context, this indicator has ranged from low single digits (when stocks are generally overvalued) to approximately 20% when stocks are in the teeth of bear markets like 2008-2009.

Stocks to Study (12/2/2016)

The Long & Short. (December 2, 2016) Projected Annual Return (PAR): Long term return forecast based on fundamental analysis and five year time horizon. Quality Ranking: Percentile ranking of composite that includes financial strength, earnings stability and relative growth & profitability. VL Low Total Return (VLLTR): Low total return forecast based on 3-5 year price targets via Value Line Investment Survey. Morningstar P/FV: Ratio of current price to fundamentally-based fair value via www.morningstar.com S&P P/FV: Current price-to-fair value ratio via Standard & Poor’s. 1-Year ACE Outlook: Total return forecast based on analyst consensus estimates for 1-year target price combined with current yield. The data is ranked (descending order) based on this criterion. 1-Year S&P Outlook: 1-year total return forecast based on S&P 1-year price target. 1-Yr “GS” Outlook: 1-year total return forecast based on most recent price target issued by Goldman Sachs.

We’ve added a Saturday morning Open House session (webcast) to the schedule.

Date: Saturday, December 03 · 10:00 AM – 11:59 AM EST
Location: Online

It’s another Saturday morning as we explore what’s on the mind of our fellow long-term investors. This open house format webcast invites you to participate. We’ll share some thoughts on stocks and topics and issues but mostly we’d like to hear from you.

Register: https://attendee.gotowebinar.com/register/2012622328797380610

Discovery Club

“Dump your hedge funds and explore their small-cap stock picks.”

Small cap is not necessarily small (faster-growing) companies but in general, we like the idea of a nice blend. So yes, we’re interested in hunting down some actionable ideas among the most successful investors on our radar screen — seeking companies that aren’t on too many radar screens, yet. The discovery of smaller, promising and faster-growing companies has always been one of our favorite (and rewarding) activities. In that spirit, we’re expanding our efforts in this realm, seeking smaller, less discovered companies and add them to our coverage. We will continue to scour our Best Small Company Funds with leaders like Brown Small Company.

This Week’s Sources and Suggestions

  • Value Line Investment Survey: Small and Mid-Cap Edition
  • Conestoga Small Cap Investors (CCASX)
  • Goldman Sachs

Coverage Initiated/Restored: Catalent (CTLT), MGP Ingredients (MGPI), Repligen (RGEN), WageWorks (WAGE), Sotheby’s (BID)

Market Barometers (Continued)

As Jeff Traeger pointed out:

Notable change in Value Line’s asset allocation model as of 11/21/16. Common stock allocation moved down from 65% – 75% to 60% – 70%. This is not an every day occurrence and so is worthy of note. The Value Line commentary indicates that the market is still sound but that the higher price levels signals investor caution. The last change in allocation was an upward move on 2/22/16.

Vl s o 20161121

Reminder: We believe elevated safety measures (more emphasis on quality, for some higher percentages of cash equivalents) is merited when the blue long-term trend line crosses through 0.0.

 ushl 20161201


Beyond Cyber Monday … Cyber December

Discover the successful investing approach used by hundreds of thousands of investors over the last several decades. By focusing on company quality, return forecast and growth forecasts — we design and manage portfolios that are built to beat the market.

Create an account at www.manifestinvesting.com for ONLY $79/year — and send an email to manifest@manifestinvesting.com for a 2-for-1 Cyber December SPECIAL. Offer valid  until December 31. You MUST send an email to qualify for the subscription exte

Introductory pricing is only available to households or customers at a business address who have not been subscribers to Manifest Investing within the last 180 days. If you respond to this offer but do not qualify for introductory pricing, we reserve the right to reject your order or prorate your subscription term to reflect current subscriber pricing. This offer may be withdrawn at any time.

End of an Era

This Week at MANIFEST (6/5/2015)

The End of an Era

For the last several years, I’ve shared the story about proper storage, layup and preparation and the joy it delivered as my annual tug-of-war with the grass cutting machine nearly killed me. And then some words of wisdom from my Dad, “Run it dry when you shut down in November” put an end to the agony.

2014 was the tenth year in a row.

Result? A first pull start for a decade or so. This is an amazing thing.

This year, that wonderful streak came to an end. The prep was sufficient and I even changed the oil, bought the best gas, etc. — but I may have primed one too many pumps of the bulb.

But it started on the second pull this year!!! We’ll take that as almost as good. There’s no comparison to the brutal wrestling matches of yore or trips to the repair shop of the past.

Companies of Interest: Value Line

The average Value Line low total return forecast for the companies in this week’s update batch is 5.7% — higher than the 3.7% for the Value Line 1700.

Materially Stronger: Balchem (BCPC)

Materially Weaker: Peabody Energy (BTU), Chesapeake Energy (CHK), Gulfmark Offshore (GLF), Encana (ECA), Ruckus Wireless (RKUS), Itron (ITRI), EOG Resources (EOG)

Standard Coverage Initiated:

Discontinued: Arch Coal (ACI), Alpha Natural Resources (ANR), Penford (PNX), Aruba Networks (ARUN)

Market Barometers

Value Line Low Total Return (VLLTR) Forecast. The long-term low total return forecast for the 1700 companies featured in the Value Line Investment Survey is 3.7%, unchanged from last week. For context, this indicator has ranged from low single digits (when stocks are generally overvalued) to approximately 20% when stocks are in the teeth of bear markets like 2008-2009.

Stocks to Study (6/5/2015)

  • Alliance Resource Partners (ARLP) — Highest MANIFEST Rank
  • Southwestern Energy (SWN) — Highest Low Return Forecast (VL)
  • Peabody Energy (BTU) — Lowest P/FV (Morningstar)
  • Consol Energy (CNX) — Lowest P/FV (S&P)
  • Alliance Resource Partners (ARLP) — Best 1-Yr Outlook (ACE)
  • Chesapeake Energy (CHK) — Best 1-Yr Outlook (S&P)
  • Phillips 66 (PSX) — Best 1-Yr Outlook (GS)

Market Barometers (Continued)

Is “Winter” Coming?

I don’t know. But the combination of a declining $USHL — remember, the number of 52-week highs crests well before a bear market, much like the first signs of falling leaves in Autumn — with the historical low overall return forecasts is cause for vigilance. I’ve started exploring some of the work of Harry Dent, the demographics-centered economist. Dent’s forecasts back in the 1990s certainly merit a closer look because he’s concerned about the outlook for 2015 and 2016. Stay tuned.

In the meantime, quality is your friend. When buying, demand high quality and leadership financial strength.

It’s Quiet. Too Quiet?

During an investment club visit this morning, one of the experienced investors made an observation about the relative lack of volatility in the market right now. My answer was framed around the reality that lower volatility generally leads to lighter paychecks on Wall Street (traders can make more money with more amplitude and frequency in both directions) and that if anything — being “too quiet” is actually disquieting for long-term investors because the rhinos can get restless and go on a misbehaving rampage. It’s the type of condition that fostered the leverage insanity of a few years ago and let’s face it, very little has actually been remodeled or remedied since those tumultuous days a few years ago. $VIX is a measure of general volatility and we see the quiet-too quiet days of 2007 which led up to the Great Recession and the current conditions.

$100/bbl On The Wall, $100/Barrel

Take one down, pass it around …

Here’s a 20-year look at the price of crude oil ($WTIC).

$100/barrel will be back before most people expect — perhaps in the 2018-2020 range. Unless somebody propagates a successful and sustained fusion reaction in their garage.

It is interesting that the slope of the long-term trend following the Great Recession resembles what we’re seeing for top-line growth from all companies, collectively.

 wtic  100 2019 2020

Exxon Mobil (XOM)

Much has been made of Berkshire Hathaway’s recent sale of Exxon Mobil ($XOM) in recent days — with Buffett himself stepping up to defend the company as a high-quality industry leader.  From a long term investing perspective, some of the integrated oil companies look compelling but may admittedly have some tough sledding for the next 18-24 months if current EPS forecasts are credible and materialize.

Because yes, Virginia, stock prices do ultimately follow earnings.

Here’s a look at current Equity Analysis Guide worksheet for Exxon Mobil (XOM) showing the turbulence. It’s not small.

That long-term growth trend is approximately 2%.

Xom eagle 20150304

Exxon Mobil (XOM) can also be an example of using a different valuation method (P/CF) for building a return forecast.

In this case, do a regression-based sales forecast for 5 years from now (~460,000).

The cash flow margin (cash flow/sales) is quite consistent at 13%.

The price-to-cash flow (P/CF) is also very consistent at 8.0×.

Xom pcf 20150304

This supports an average long-term price forecast of $115 — and a return forecast of 8-9%.
Xom pcf forecast 20150304

This Week at MANIFEST (12/5/2014)

Wild Rides, Cyber Monday!

That dull thud we all heard over the Thanksgiving holiday was the energy sector turkey. As shown above, the energy sector took it on the chin to the tune of an 11% swoon as OPEC maintained production levels providing some hefty turbulence. As the following two charts illustrate, few companies in the group were immune from the carnage. Exxon Mobil (XOM) is actually one of the tamer examples from the sessions as these 5-day charts show the disruption.

But it appears that Monday is already bringing some relief … or at least a frozen turkey bounce for some of the higher quality companies in the group …

This week’s update batch (Issue 3 in the Value Line Investment Survey for those keeping score) includes a number of the affected companies. We note several things. First of all, the forecast fundamentals for a number of these companies were already being trimmed by the Value Line analysts. It will be interesting to watch over the next quarter to see if expectations continue to be reduced. We’ve often noted a bifurcation between Morningstar and S&P when it comes to the cyclical stocks — particularly in the energy industry. In this case, Friday’s swoon delivers a price-to-fair value ratio of 91% at Morningstar, essentially screaming something on the order of a Black Friday rush. S&P says “not so fast.” The S&P price-to-fair value ratio is actually greater than 100% (101%) and S&P has been steadily and materially reducing their fair value estimates for the energy stocks over the last few weeks and months. We tend to favor the S&P cyclical expertise in a tiebreaker … so we’d urge caution and an insistence on high-quality during opportunity shopping.

As Hugh has pointed out, BP (BP) was among the tumblers and probably rates fairly well as a long-term opportunity. Exxon Mobil (XOM) is among the study candidates also along with some of the other integrated blue chippers. Keep in mind that Hugh normalizes versus the 52-week low, seeking opportunities when stock prices are near their trailing 52-week lows. Hugh’s spreadsheets compare current prices to their 52-week lows. The accompanying charts for S&P and Morningstar do the same thing — but the comparison is between the current price and the fair value. Less than 100% is potentially attractive, unless it gets “too low.” Stocks in the sweet spot would likely fall into a P/FV ratio of 80-90% representing a discount to fair value of 10-20%.

Coming Events and Attractions

We will catch up on the final November columns and we’ll be out with the December issue of Expected Returns this week.

We’ll continue our expanded coverage of the update stocks this month as part of our quarter long test drive of this feature and the studies and shared ideas it delivers. Please tell us what you think and feel free to join in the Forum discussions for the deeper dives on some of the stocks.

Save the Date: The December Round Table will be held on December 30 at 8:30 PM ET. Register via: https://www2.gotomeeting.com/register/256833802

Companies of Interest: Value Line

The average Value Line low total return forecast for the companies in this week’s update batch is 2.8%.

Materially Stronger: Zebra Technologies (ZBRA)

Materially Weaker: Rhino Resource Partners (RNO), Clean Energy Fuels (CLNE), Gulfmark Offshore (GLF), UGI (UGI), Kronos World (KRO), Marathon Oil (MRO)

Coverage Initiated: Methanex (MEOH), Concho Resources (CXO)

Discontinued: Walter Energy (WLT)

Companies of Interest: Morningstar

The average price-to-fair value (P/FV) ratio at Morningstar for the companies in this week’s update batch is 91%!

It will be interesting to see if the Morningstar analysts make any downward adjustments in fair value for the energy stocks during this turbulent ride.

Southwestern Energy (SWN) checks in at 55% — a stock that Morningstar apparently believes is significantly undervalued.

Companies of Interest: S&P

The average price-to-fair value for the companies in this week’s update batch is 101% — according to S&P.

There are always a couple of things to check during a swoon. One is whether the perceived opportunity is too good to be true. Companies with P/FV ratios less than 70% … or PAR values greater than 16% come to mind. The other is when companies are guilty by association when they don’t deserve it. Is it possible that Imperial Oil (IMO) should be less affected?

Ecolab (ECL) makes the S&P short list at a P/FV of 89% and a quality ranking of 86 — suggesting that it may be worthy of further study.

Market Barometers

The median Value Line Low Total Return (VLLTR) Forecast is at 3.7% — unchanged from 3.7% last week.

Stocks to Study

The following update stocks are ranked in the top 10th percentile of all companies we follow (MANIFEST Rank > 90) and this display provides a wide berth of dueling opinions, as usual.