This Week at MANIFEST (12/2/2016)
“An hour with a book would have brought to your mind,
The secret that took the whole year to find;
The facts that you learned at enormous expense,
Were all on a library shelf to commence.” — via Ted Brooks and Audels Handbook for Mechanics
“My advice is read everything you can.” — Warren Buffett
This week’s update batch includes a number of cyclicals including some of the leaders from the oil patch. Subscribers and Round Table participants have sometimes wondered about the selection of companies like BP (BP) by Hugh McManus. Like a good book, sometimes a modified or evolving perspective is required to put less traditional selections in context. So far as books go, for this topic we’d urge some consideration of Peter Lynch and the Magellan track record investing in cyclical companies. Hugh has the highest relative/excess return, since inception, for all Round Table participants. As always, it’s not for beginners but the rewards can be outsized…
Analysis Across The Chasm

During our stock studies, we are sometimes confronted with a Kobayashi Maru, a test that seems to defy a solution. The last time we remember seeing this on a fairly widely spread basis was while attempting to do stock studies during the Great Recession of 2008-2009.
The Kobayashi Maru is a training exercise in the Star Trek universe designed to test the character of Starfleet Academy cadets in a no-win scenario. The Kobayashi Maru test was first depicted in the opening scene of the film Star Trek II: The Wrath of Khan and also appears in the 2009 film Star Trek. The test’s name is occasionally used among Star Trek fans or those familiar with the series to describe a no-win scenario, a test of one’s character or a solution that involves redefining the problem.
Recessions and large speed bumps wreck SSG-based trend analysis. Ken Kavula and I were faced with challenging studies much more frequently during the Great Recession.

Cyclicals are challenging. Sometimes a 10-year visual analysis isn’t enough to build an image and understanding of long-term growth. We advise beginning investors to avoid companies like this. The price collapses can be catastrophic as economic cycles unfold. But Peter Lynch suggested that significant rewards await experienced investors who can pass the seemingly no-win scenario test. It is in this context that Hugh McManus chooses companies like Bank of America (BAC) … [Yes, Virginia, financial sector stocks are often quite cyclical] … BP (BP) and Conoco Phillips (COP).
Hugh has chosen a number of these companies for the Round Table tracking portfolio. It is worth noting that Hugh has the highest relative return among all participants and contributors. His time horizon is truly massive and he seeks opportunities that are, in Cy’s words, “more temporary than terminal.” He invested in BP (BP) as the leak in the Gulf was dominating the news cycle.
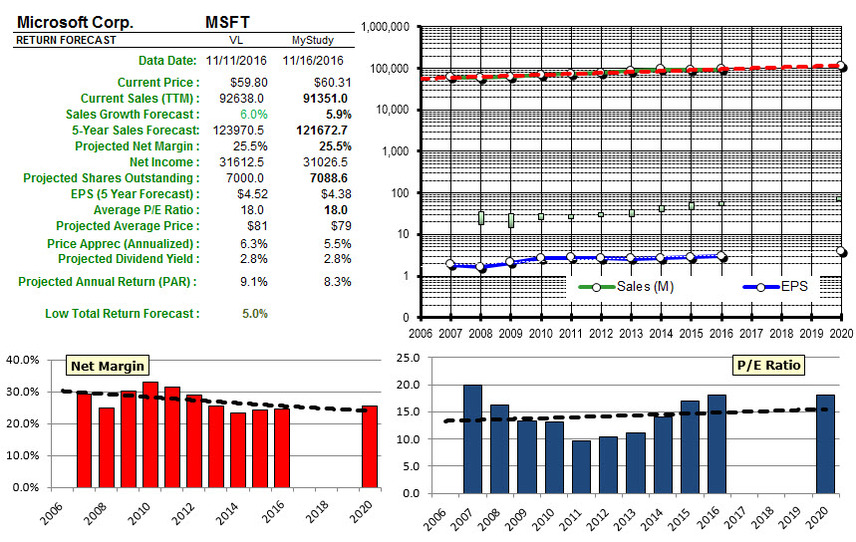
The rhinos (Wall Street analysts and institutions) overreact. Period. In the case of Petroleum (Integrated) companies, I wouldn’t be surprised to see that 2020 actual result more closely match the trend line shown in the accompanying figure. Sometimes, experienced investors simply have to look across the chasm — imagine what it may be like on “on the other side.”
Captain James T. Kirk, as a cadet, was victorious in a No-Win scenario by changing the rules. He reprogrammed the simulation. When faced with a chasm, sometimes you just gotta invest like Captain Kirk.
.

MANIFEST 40 Updates
- 14. Exxon Mobil (XOM)
- BP plc (BP)
- Conoco-Philips (COP)
(None)
Results, Remarks & References
- 20 Years Later, These Ladies Haven’t Changed Their Style (Beardstown Ladies via The Globe & Mail)
- Conestoga: Investing From The Ground Up (Barron’s)
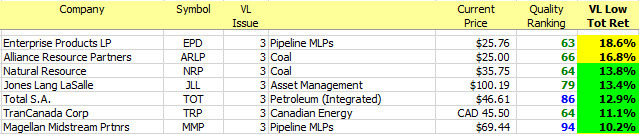
Companies of Interest: Value Line (12/2/2016)
The average Value Line low total return forecast for the companies in this week’s update batch is 4.5% vs. 3.5% for the Value Line 1700 ($VLE).
Attrition (reduction in long term forecasts) seems to have abated a bit for this batch of Value Line updates but remember this is a challenging and cyclical minefield of companies (in general) … shop carefully. There are very few widely-followed or Round Table companies on this week’s menu.
Materially Stronger: Joy Global (JOY) 1, Chemours (CC)
Materially Weaker: Southwestern Energy (SWN), Energy Trans Partners (ETP)
Discontinued: Questar (STR), Infoblox (BLOX), AMN Healthcare (AHS), Rackspace (RAX), Monster Worldwide (MWW)
1 Joy Global (JOY) to be acquired by Komatsu in mid-2017.
Market Barometers
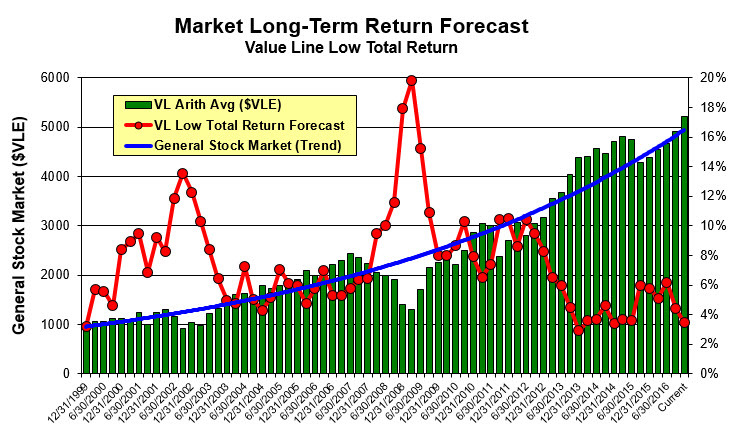
Value Line Low Total Return (VLLTR) Forecast. The long-term low total return forecast for the 1700 companies featured in the Value Line Investment Survey is 3.5%, down from 4.3% last week. For context, this indicator has ranged from low single digits (when stocks are generally overvalued) to approximately 20% when stocks are in the teeth of bear markets like 2008-2009.
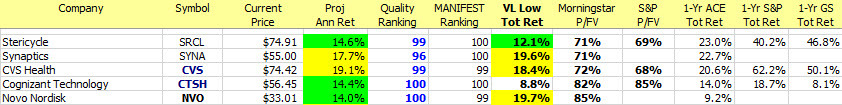
Stocks to Study (12/2/2016)
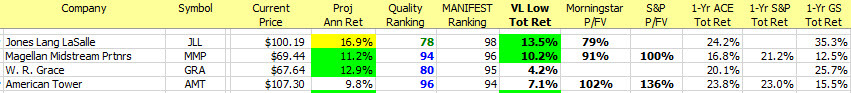
The Long & Short. (December 2, 2016) Projected Annual Return (PAR): Long term return forecast based on fundamental analysis and five year time horizon. Quality Ranking: Percentile ranking of composite that includes financial strength, earnings stability and relative growth & profitability. VL Low Total Return (VLLTR): Low total return forecast based on 3-5 year price targets via Value Line Investment Survey. Morningstar P/FV: Ratio of current price to fundamentally-based fair value via www.morningstar.com S&P P/FV: Current price-to-fair value ratio via Standard & Poor’s. 1-Year ACE Outlook: Total return forecast based on analyst consensus estimates for 1-year target price combined with current yield. The data is ranked (descending order) based on this criterion. 1-Year S&P Outlook: 1-year total return forecast based on S&P 1-year price target. 1-Yr “GS” Outlook: 1-year total return forecast based on most recent price target issued by Goldman Sachs.


We’ve added a Saturday morning Open House session (webcast) to the schedule.
Date: Saturday, December 03 · 10:00 AM – 11:59 AM EST
Location: Online
It’s another Saturday morning as we explore what’s on the mind of our fellow long-term investors. This open house format webcast invites you to participate. We’ll share some thoughts on stocks and topics and issues but mostly we’d like to hear from you.
Register: https://attendee.gotowebinar.com/register/2012622328797380610
![]()
Discovery Club
“Dump your hedge funds and explore their small-cap stock picks.”
Small cap is not necessarily small (faster-growing) companies but in general, we like the idea of a nice blend. So yes, we’re interested in hunting down some actionable ideas among the most successful investors on our radar screen — seeking companies that aren’t on too many radar screens, yet. The discovery of smaller, promising and faster-growing companies has always been one of our favorite (and rewarding) activities. In that spirit, we’re expanding our efforts in this realm, seeking smaller, less discovered companies and add them to our coverage. We will continue to scour our Best Small Company Funds with leaders like Brown Small Company.
This Week’s Sources and Suggestions
- Value Line Investment Survey: Small and Mid-Cap Edition
- Conestoga Small Cap Investors (CCASX)
- Goldman Sachs
Coverage Initiated/Restored: Catalent (CTLT), MGP Ingredients (MGPI), Repligen (RGEN), WageWorks (WAGE), Sotheby’s (BID)
Market Barometers (Continued)
As Jeff Traeger pointed out:
Notable change in Value Line’s asset allocation model as of 11/21/16. Common stock allocation moved down from 65% – 75% to 60% – 70%. This is not an every day occurrence and so is worthy of note. The Value Line commentary indicates that the market is still sound but that the higher price levels signals investor caution. The last change in allocation was an upward move on 2/22/16.
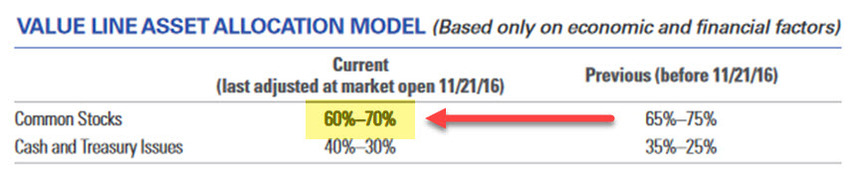
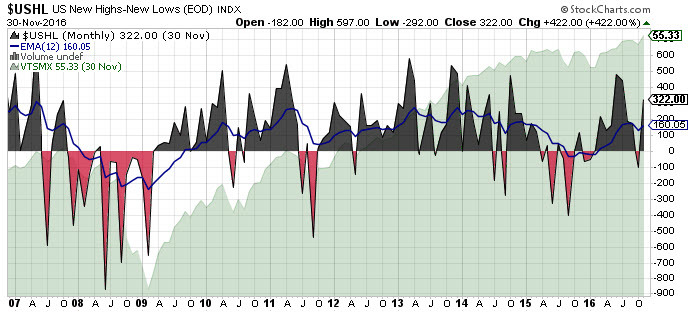
Reminder: We believe elevated safety measures (more emphasis on quality, for some higher percentages of cash equivalents) is merited when the blue long-term trend line crosses through 0.0.
Beyond Cyber Monday … Cyber December
Discover the successful investing approach used by hundreds of thousands of investors over the last several decades. By focusing on company quality, return forecast and growth forecasts — we design and manage portfolios that are built to beat the market.
Create an account at www.manifestinvesting.com for ONLY $79/year — and send an email to manifest@manifestinvesting.com for a 2-for-1 Cyber December SPECIAL. Offer valid until December 31. You MUST send an email to qualify for the subscription exte
Introductory pricing is only available to households or customers at a business address who have not been subscribers to Manifest Investing within the last 180 days. If you respond to this offer but do not qualify for introductory pricing, we reserve the right to reject your order or prorate your subscription term to reflect current subscriber pricing. This offer may be withdrawn at any time.


 When to Sell: The Challenge of Reason We don’t want to give the impression that any of the time-honored selling disciplines change with the exploration/concept described here. We still believe that the reasons for selling are short and simple: (1) You need the money, (2) Signs of quality degradation and (3) You can make the portfolio better. That said, we’ll explore this capital preservation and rate of return potential enhancement and decide if it’s a worthy improvement in our arsenal.


 Iconix Brands (