This Week at MANIFEST (12/23/2016)
Grinchy Bill Griffeth and Rogue destroyer Janet Yellen squelched our Dow 20,000 rally and party hats last week. But we’re resilient and pressing on. This week’s update batch includes Procter & Gamble (PG), Tractor Supply (TSCO), Fastenal (FAST) and those homebuilders and building supply retailers.
Burnt Popcorn!
We refer to market fraught with turbulence and emotions as “popcorn days.” In most cases, it’s a spectator sport as panic or exuberance is met with explanations and rationale that are back-fitted for the day. And these memes are among the most recyclable phenomenon on the planet. The same logic often works in both directions. People are selling today because _____ aligns pretty nicely on other days with People are buying today because ______.
This week, I demonstrated (again) why I could never be a day trader. I really thought we’d reach Dow 20,000 although I would never have taken out a second mortgage on the theory.
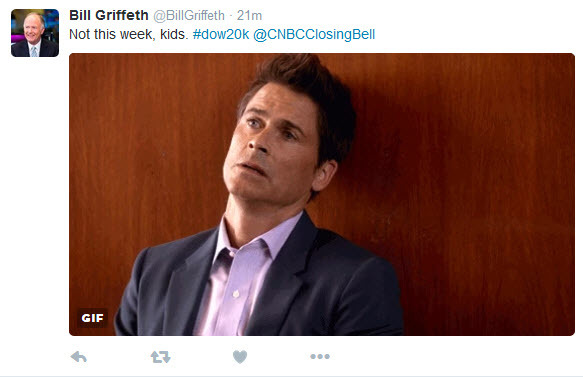
Grinchy Bill Griffeth had some fun with the Dow 20,000 enthusiasts with the accompanying tweet made during Friday’s Closing Bell segment on CNBC.
Other antagonists sent messages that 4 days of prolonged Dow 20,000 watching should probably be treated with a trip to the doctor.
But, we got close … coming within 34 points before Janet Yellen and her Rogue storm troopers at the Fed rained on the parade at 2:30 PM ET on Wednesday. The rest of the week had some moments — but it was pretty much like watching salmon flipping up the ladder. We learned on our Alaska cruise that despite a brief fling when the salmon reach their birthplace, it doesn’t end well. And the week didn’t end well for our box of Dow 20K party hats.


MANIFEST 40 Updates
- 3. Fastenal (FAST)
- 15. Procter & Gamble (PG)
- 30. Home Depot (HD)
- 34. Lowe’s (LOW)
- Chicago Bridge & Iron (CBI)
- Fastenal (FAST)
- Tractor Supply (TSCO)
(None)
Results, Remarks & References
- 7 Internet Memes To Ring In Dow 20,000(MarketWatch)
- I Was Like A Drunken Rock Star On Steriods For Dow 10,000(CNBC)
- The Worst Start To A Year Ever(Joshua Brown)
- Trump-Impervious Market(Ken Fisher)
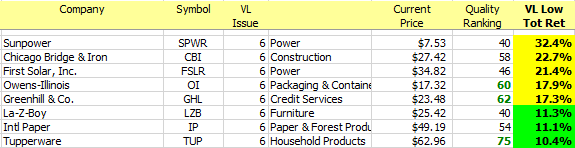
Companies of Interest: Value Line (12/23/2016)
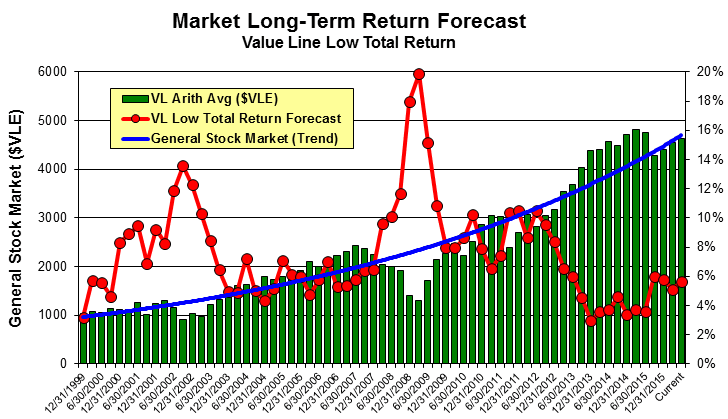
The average Value Line low total return forecast for the companies in this week’s update batch is 2.9% vs. 3.3% for the Value Line 1700 ($VLE).

Materially Stronger: Pulte Homes (PHM)
Materially Weaker: Sunpower (SPWR). First Solar (FSLR)
Discontinued:
Market Barometers
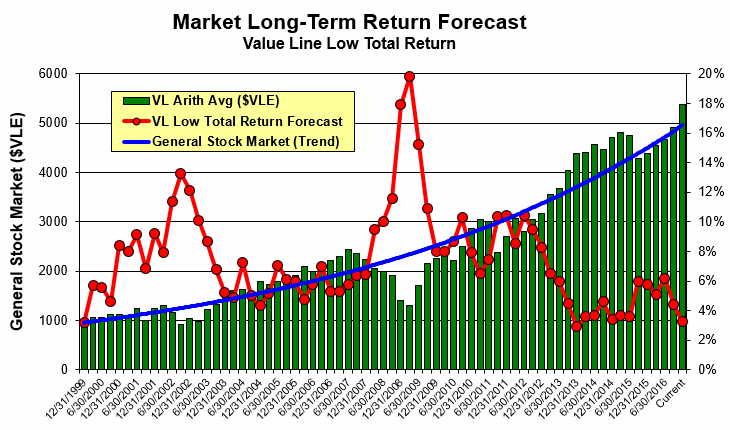
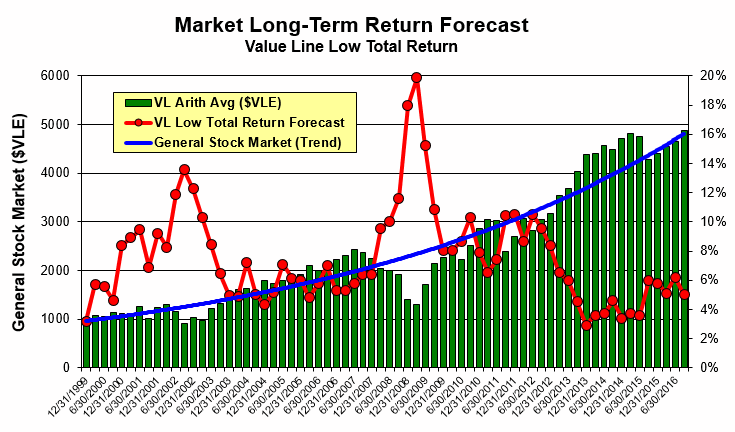
Value Line Low Total Return (VLLTR) Forecast. The long-term low total return forecast for the 1700 companies featured in the Value Line Investment Survey is 3.3%, unchanged from 3.3% last week. For context, this indicator has ranged from low single digits (when stocks are generally overvalued) to approximately 20% when stocks are in the teeth of bear markets like 2008-2009.
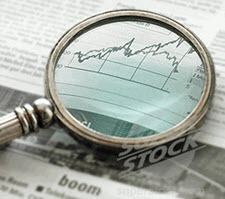
Stocks to Study (12/23/2016)
Normally we “cut off” the list at a MANIFEST Rank of 95 or 90 … and you’ll note that we had to go a little deeper in order to have a list this week. Study and shop well.

The Long & Short. (December 23, 2016) Projected Annual Return (PAR): Long term return forecast based on fundamental analysis and five year time horizon. Quality Ranking: Percentile ranking of composite that includes financial strength, earnings stability and relative growth & profitability. VL Low Total Return (VLLTR): Low total return forecast based on 3-5 year price targets via Value Line Investment Survey. Morningstar P/FV: Ratio of current price to fundamentally-based fair value via www.morningstar.com S&P P/FV: Current price-to-fair value ratio via Standard & Poor’s. 1-Year ACE Outlook: Total return forecast based on analyst consensus estimates for 1-year target price combined with current yield. The data is ranked (descending order) based on this criterion. 1-Year S&P Outlook: 1-year total return forecast based on S&P 1-year price target. 1-Yr “GS” Outlook: 1-year total return forecast based on most recent price target issued by Goldman Sachs.