Ten Years … Gone “Hog Wild”

This started with the top trailing 10-year performers from the S&P 500, which is cool — and at least they got that going for them. But we know the virtues of All-of-the-Above investing, which means the Value Line 1700 list is even cooler. Look what Groundhog Nation did with them.

Carl Quintanilla (CNBC) provided this list of the best performing stocks in the S&P 500 since the market low ten years ago.

It’s been fun and rewarding for many. Take note how many of these have been covered and/or resident in our model portfolios, etc. since then.

Who did we miss? Why?

Spy top 50 performers since 2009 20190308

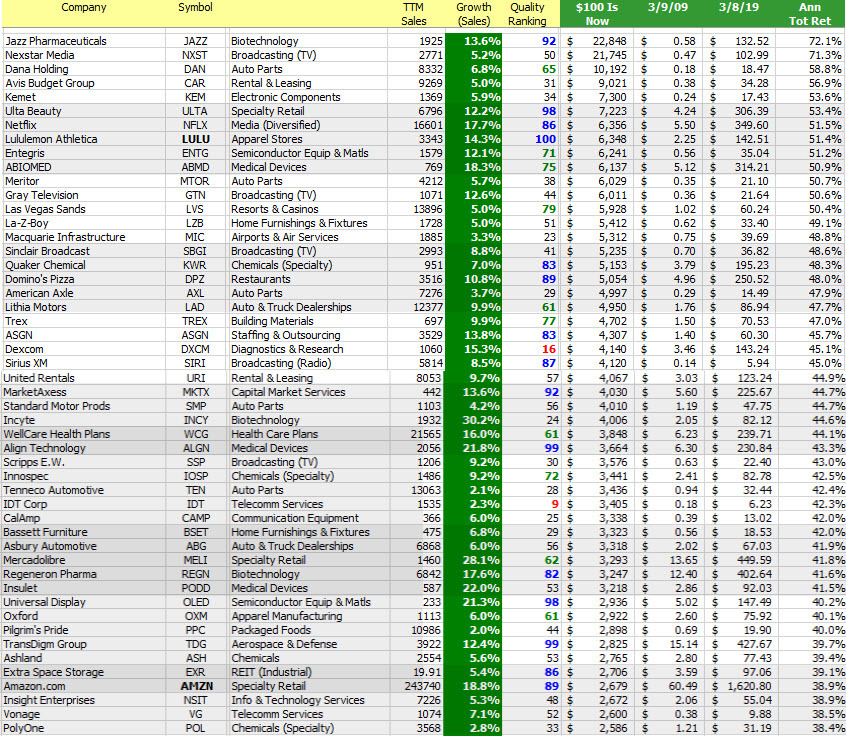
So what were you doing when the “Great” Recession bottomed on March 9, 2009? CNBC got this whole this started with the S&P 500 but we know that even better opportunity manifests in the Value Line 1700 — and we weren’t disappointed.

There are 1200 stocks with stock price data for 3/9/2009 and 3/8/2019, ten years later. Investing $100 into each of these 1200 ($120,000) would worth $1,012,892 this past weekend — an annualized total return of 23.8%. Sorry, Carl Quintanilla, but the S&P 500 checks in at 17.3%.

  • The annualized total return (10 years) on the Wilshire 5000 (VTSMX) is 17.5%. 655 of the 1200 stocks (54.6%) beat the market. This collective of gainers have an average quality ranking of 69.
  • 1138-of-1200 (94.8%) gained and a have a current value greater than $100. The stocks that lost ground have an average quality ranking of 27.
  • The top performing decile has a sales growth forecast of 9.2%. The bottom decile stands with a 5.3% growth forecast.
  • If the Value Line Arithmetic Average were “investable,” the annualized total return was 19.7% as 999.30 advanced to 6046.07 during the time period. All-of-the-Above Investing works.

Gone Hog Wild (March 2009)

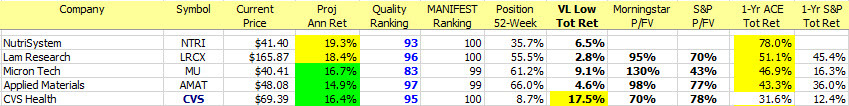
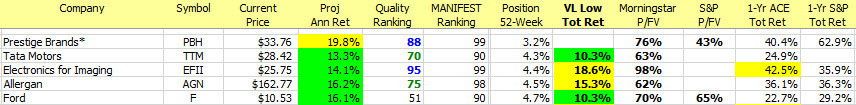
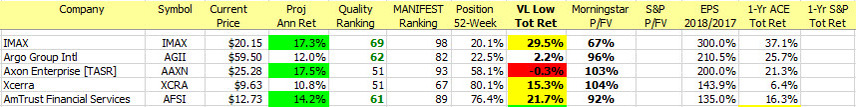
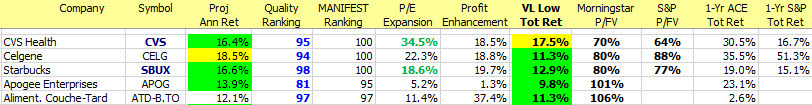
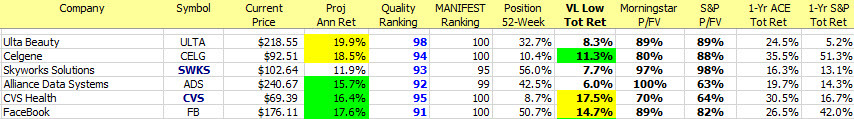
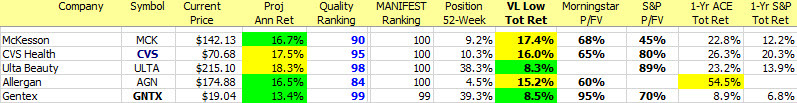
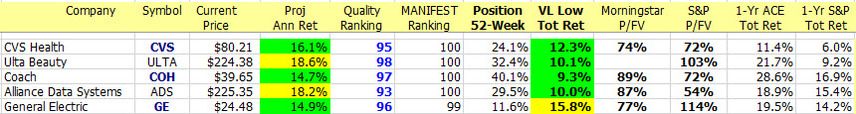
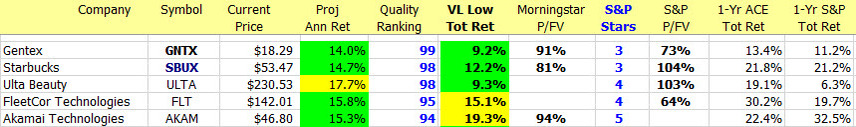
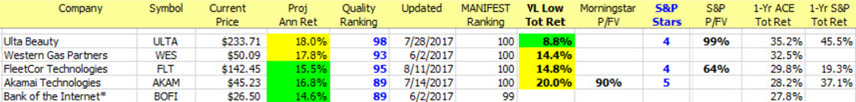
Every year we run a stock picking contest that starts on Groundhog Day and continues until the next Groundhog Day. Back in March 2009, we featured the most-frequently selected stocks as something of a screening exercise. As the accompanying image shows, yes, Virginia, the average return forecast was “north” of 20% at the time.

The Sweet 16 stocks featured back in March 2009 generated a return of 21.2%.

The top performer was the swing-for-the-fences selection of Sigma Designs (SIGM) and every once in a while, Casey does not always strike out. 36.6% can be a wonderful thing. But the rest of the field was also formidable and include a number of community favorites (Manifest Investing 40 residents).

Sweet 16 (3/1/2009) Results — Ten Years Later. As shown the collective performance of the (16) selections known as “Heavy Hogs” delivered a 21.2% annualized total return. Dividends are included. We can’t help but note the strong performance from the companies at the top of the 10-year-old screening results vs. the achievements of some nearer the bottom. Quality Systems (QSII) morphed into NextGen Healthcare (NXGN). [Editor’s Note: If we’d only listened to Cy Lynch and WellCare Health Plans (WCG) at the time, +44.1%.] Buffalo Wild Wings (BWLD) was acquired by Arby’s after a considerable gain. Navellier Fundamental (NFMAX) evolved into a private wrap offering, results shown are from Navellier fact sheet (https://navellier.com/files/3815/4964/8534/fundamental-a-factsheet.pdf).


Invest With Your Friends.  The journey can be a most informative, rewarding and entertaining adventure.


Start a test drive (trial subscription) at http://www.manifestinvesting.com ($79/year, group discounts for club partners and educators) and participate in the next ten years of going “Hog Wild.”

Questions?

Contact Mark Robertson via markr@manifestinvesting.com or via Twitter by reaching out to @manifestinvest.  Manifest Investing also maintains a “slipstream blog” at Facebook: https://www.facebook.com/manifestinvesting/  Comments and inquiries welcome.


Fave Five: 2018 GH Edition

Fave Five (2/9/2018)

Our Fave Five essentially represents a listing of stocks with favorable short term total return forecasts (1 year, according to Analyst Consensus Estimates, or ACE) combined with strong long-term return forecasts and good/excellent quality rankings. The median 1-year ACE total return forecast is 14.7%.

By the way, the ferocity of the correction is on full display here, the median 1-year ACE total return was 1.7% just a couple of weeks ago. That reality, the bolstering fundamentals and a relative strength index that is creeping into “oversold territory” are among the reasons that diligent shopping can be pursued.

This week’s Fave Five will be a parade of several of our favorite screens, including the traditional long/short outlook, best in zone, launchpad ready, Triple Play qualified, etc.

Traditional Fave Five: NutriSystems (NTRI)
Best In Zone “Irish Spring”: Prestige Brands (PBH)
Launchpad Worthy?: IMAX (IMAX)
Triple Play Qualifiers: CVS Health (CVS)
Heavy Hogs (2018): ULTA Beauty (ULTA)

The Long and Short of This Week’s Fave Five

Long & Short Term Perspectives. (February 9, 2018) Projected Annual Return (PAR): Long term return forecast based on fundamental analysis and five year time horizon. Quality Ranking: Percentile ranking of composite that includes financial strength, earnings stability and relative growth & profitability. 52-Week Position: Position on scale between 52-week low price and 52-week target price. VL Low Total Return (VLLTR): Low total return forecast based on 3-5 year price targets via Value Line Investment Survey. Morningstar P/FV: Ratio of current price to fundamentally-based fair value via www.morningstar.com S&P P/FV: Current price-to-fair value ratio via Standard & Poor’s. 1-Year ACE Outlook: Total return forecast based on analyst consensus estimates for 1-year target price combined with current yield. The data is ranked (descending order) based on this criterion. 1-Year S&P Outlook: 1-year total return forecast based on S&P 1-year price target.

Best in Zone — “Irish Spring”

Long & Short Term Perspectives. (February 9, 2018) Projected Annual Return (PAR): Long term return forecast based on fundamental analysis and five year time horizon. Quality Ranking: Percentile ranking of composite that includes financial strength, earnings stability and relative growth & profitability. 52-Week Position: Position on scale between 52-week low price and 52-week target price. VL Low Total Return (VLLTR): Low total return forecast based on 3-5 year price targets via Value Line Investment Survey. Morningstar P/FV: Ratio of current price to fundamentally-based fair value via www.morningstar.com S&P P/FV: Current price-to-fair value ratio via Standard & Poor’s. 1-Year ACE Outlook: Total return forecast based on analyst consensus estimates for 1-year target price combined with current yield. The data is ranked (descending order) based on this criterion. 1-Year S&P Outlook: 1-year total return forecast based on S&P 1-year price target.

Launchpad Candidates

Reminder: These are companies exhibiting HUGE 2018 EPS forecasts versus 2017 projected/actual results. This is just a one year condition for this screen. Ideally, a stock with multi-year breakthrough and breakout potential could be discovered. Stocks exhibiting these characteristics have delivering participating clubs and individuals to the Groundhog Winner’s Circle in the past.

Triple Play Qualifiers

This group has decent (out-sized) long term return expectations in combination with the potential for P/E expansion and profitability/margin enhancement.

Heavy Hogs (2018)

These are the consensus selections — the most commonly selected stocks — among the Groundhog Challenge entries for 2018.

Fave Five Legacy (Tracking Portfolio)

The relative/excess return for the Fave Five tracking portfolio is +4.8% since inception.

The absolute annualized rate of return is 18.1%.

Tracking Dashboard: https://www.manifestinvesting.com/dashboards/public/fave-five

Fave Five: Triple Play (11/17/2017)

Fave Five (11/17/2017)

Our Fave Five essentially represents a listing of stocks with favorable short term total return forecasts (1 year, according to Analyst Consensus Estimates, or ACE) combined with strong long-term return forecasts and good/excellent quality rankings. The median 1-year ACE total return forecast is 7.2%.

This week we return to the triple play screening method for our five favorites. The triple play possibility occurs when you find a stock that is very depressed in price and also appears to be on the verge of substantially boosting its profit margins. The triple play effect is possible in that:

(1) The depressed price of the stock can return to normal levels;

(2) increased profit margins can produce increased EPS and a higher price;

(3) may also cause higher P/E ratios, or P/E expansion.

Schlossing About

We continue to leave the 52-week “position”, a factor that combines with 1-year total return for the short term outlook. Walter Schloss loved to find vetted high-quality companies with solid expectations that were trading near the low end of a 52-week range.

This week’s short list has all the usual attributes over the long term, the next year (or short term) and also is expected to grow at double-digit rates, precisely the type of treat that we seek to discover going into the holiday season this year.

The Long and Short of This Week’s Fave Five

Long & Short Term Perspectives. (November 17, 2017) Projected Annual Return (PAR): Long term return forecast based on fundamental analysis and five year time horizon. Quality Ranking: Percentile ranking of composite that includes financial strength, earnings stability and relative growth & profitability. 52-Week Position: Position on scale between 52-week low price and 52-week target price. VL Low Total Return (VLLTR): Low total return forecast based on 3-5 year price targets via Value Line Investment Survey. Morningstar P/FV: Ratio of current price to fundamentally-based fair value via www.morningstar.com S&P P/FV: Current price-to-fair value ratio via Standard & Poor’s. 1-Year ACE Outlook: Total return forecast based on analyst consensus estimates for 1-year target price combined with current yield. The data is ranked (descending order) based on this criterion. 1-Year S&P Outlook: 1-year total return forecast based on S&P 1-year price target.

Fave Five Legacy (Tracking Portfolio)

The relative/excess return for the Fave Five tracking portfolio is +5.3% since inception.

The absolute annualized rate of return is 20.6%.

Tracking Dashboard: https://www.manifestinvesting.com/dashboards/public/fave-five

Fave Five (9/29/2017)

Fave Five (9/29/2017)

Our Fave Five essentially represents a listing of stocks with favorable short term total return forecasts (1 year, according to Analyst Consensus Estimates, or ACE) combined with strong long-term return forecasts and good/excellent quality rankings. The median 1-year ACE total return forecast is 11.1%.

This week we return to the triple play screening method for our five favorites. The triple play possibility occurs when you find a stock that is very depressed in price and also appears to be on the verge of substantially boosting its profit margins. The triple play effect is possible in that:

(1) The depressed price of the stock can return to normal levels;

(2) increased profit margins can produce increased EPS and a higher price;

(3) may also cause higher P/E ratios, or P/E expansion.

The Fave Five This Week

  • Alliance Data Systems (ADS)
  • Coach (COH)
  • CVS Health (CVS)
  • General Electric (GE)
  • Ulta Beauty (ULTA)

The Long and Short of This Week’s Fave Five

The Long & Short. (September 29, 2017) Projected Annual Return (PAR): Long term return forecast based on fundamental analysis and five year time horizon. Quality Ranking: Percentile ranking of composite that includes financial strength, earnings stability and relative growth & profitability. VL Low Total Return (VLLTR): Low total return forecast based on 3-5 year price targets via Value Line Investment Survey. Morningstar P/FV: Ratio of current price to fundamentally-based fair value via www.morningstar.com S&P P/FV: Current price-to-fair value ratio via Standard & Poor’s. 1-Year ACE Outlook: Total return forecast based on analyst consensus estimates for 1-year target price combined with current yield. The data is ranked (descending order) based on this criterion. 1-Year S&P Outlook: 1-year total return forecast based on S&P 1-year price target.

Fave Five Legacy (Tracking Portfolio)

The rate of return for the tracking portfolio is 21.6% since inception.

The relative/excess return for the Fave Five tracking portfolio is +6.1% since inception.

Tracking Dashboard: https://www.manifestinvesting.com/dashboards/public/fave-five

Fave Five (9/8/2017)

Fave Five (9/8/2017)

Our Fave Five essentially represents a listing of stocks with favorable short term total return forecasts (1 year, according to Analyst Consensus Estimates, or ACE) combined with strong long-term return forecasts and good/excellent quality rankings. The average 1-year ACE total return forecast is 10.6%.

Our Favorite Bubbles …

… just might be the kind of bubbles that evolve when we blend Ivory Soap with Irish Spring. Hugh McManus likes to shop for opportunities among stocks that are trading near their 52-week lows and for non-core case studies, he’ll sometimes demand that the stock prices be near multi-year lows. Part of the driver behind this is the recognition that there’s often a large difference between 52-week highs and 52-week lows, even for some of the bluer chip established stocks. Isolating opportunities to invest when stocks are in the lower part of those annual ranges would seem to provide a margin of safety and reduce some of the downside … and “all things created equal” why should we shop anywhere else. (Read that in an Irish brogue for full effect.)

The five stocks flagged this week are repeat selections for the Fave Five tracking portfolio and as the parade of second opinions shows — there’s largely some consensus about expectations. FleetCor (FLT), Starbucks (SBUX) and Ulta Beauty (ULTA) also popped up as high-quality stocks with relatively outsized return potential in Ken Kavula’s review of the Forbes Most Innovative Companies. Gentex (GNTX) has also been a Round Table favorite with stellar performance over the years and Akamai Technologies (AKAM) has been featured as a worthy exploration consistent with the growing need for cyber security.

StockSearch Results using the stock screener at www.manifestinvesting.com with the following criteria: Manifest Rank (percentile ranking based on combination of quality and long term return forecast) greater than 99.44% — or top 1/2 of top percentile of all stocks covered, Financial Strength > B++ (70%) and stocks within 20% of their 52-week low.

The Long and Short of This Week’s Fave Five

The Long & Short. (September 8, 2017) Projected Annual Return (PAR): Long term return forecast based on fundamental analysis and five year time horizon. Quality Ranking: Percentile ranking of composite that includes financial strength, earnings stability and relative growth & profitability. VL Low Total Return (VLLTR): Low total return forecast based on 3-5 year price targets via Value Line Investment Survey. Morningstar P/FV: Ratio of current price to fundamentally-based fair value via www.morningstar.com S&P P/FV: Current price-to-fair value ratio via Standard & Poor’s. 1-Year ACE Outlook: Total return forecast based on analyst consensus estimates for 1-year target price combined with current yield. The data is ranked (descending order) based on this criterion. 1-Year S&P Outlook: 1-year total return forecast based on S&P 1-year price target. 1-Yr GS: 1-year total return forecast based on most recent price target issued by Goldman Sachs.

Fave Five Legacy (Tracking Portfolio)

The relative/excess return for the Fave Five tracking portfolio is +2.3% since inception.

The absolute annualized rate of return is 15.3%.

Tracking Dashboard: https://www.manifestinvesting.com/dashboards/public/fave-five

Fave Five (8/25/2017)

Fave Five (8/25/2017)

Our Fave Five essentially represents a listing of stocks with favorable short term total return forecasts (1 year, according to Analyst Consensus Estimates, or ACE) combined with strong long-term return forecasts and good/excellent quality rankings. The average 1-year ACE total return forecast is 10.2%.

The Fave Five This Week

  • Akamai Technologies (AKAM)
  • Bank of the Internet (BOFI)
  • FleetCor (FLT)
  • Ulta Beauty (ULTA)
  • Western Gas Partners (WES)

The Long and Short of This Week’s Fave Five

The Long & Short. (August 25, 2017) Projected Annual Return (PAR): Long term return forecast based on fundamental analysis and five year time horizon. Quality Ranking: Percentile ranking of composite that includes financial strength, earnings stability and relative growth & profitability. VL Low Total Return (VLLTR): Low total return forecast based on 3-5 year price targets via Value Line Investment Survey. Morningstar P/FV: Ratio of current price to fundamentally-based fair value via www.morningstar.com S&P P/FV: Current price-to-fair value ratio via Standard & Poor’s. 1-Year ACE Outlook: Total return forecast based on analyst consensus estimates for 1-year target price combined with current yield. The data is ranked (descending order) based on this criterion. 1-Year S&P Outlook: 1-year total return forecast based on S&P 1-year price target. 1-Yr GS: 1-year total return forecast based on most recent price target issued by Goldman Sachs.

Fave Five Legacy (Tracking Portfolio)

The relative/excess return for the Fave Five tracking portfolio is +1.4% since inception.

The absolute annualized rate of return is 13.7%.

Tracking Dashboard: https://www.manifestinvesting.com/dashboards/public/fave-five

This Week at MANIFEST (10/28/2016)

“Americans eat approximately 100 Acres of pizza every day. That’s about 350 slices per second.” Source: Pizza Fun Facts via Pizza.com

October is National Pizza Month. This observance began in October 1984, and was created by Gerry Durnell, the publisher of Pizza Today magazine. Some people observe National pizza month by consuming various types of pizzas or pizza slices, or going to various pizzerias. During the month, some pizzerias give away free pizzas or pizza slices to customers or offer reduced-price promotions. Some businesses run fundraising drives, donating proceeds of pizza sales to benefit various organizations or charities.

The acres of pizza mention took me back to a keynote speech by Ken “Mr. NAIC” Janke that he delivered to an audience of long-term investors in Chicago back in March 1996. It was entitled, The Janke Dozen and 75 Acres of Pizza (Per Day) and I saved his commentary under “Investment Club Lessons.”

At the time, our first grader did his part. Alex contributed to the national average for pizza consumption as often as we allowed him to. The staples of his diet were pizza, chicken sandwiches, pizza, macaroni & cheese, and pizza. Ken shared a number of observations including the statistic that Americans then consumed 75 acres of pizza per day. Twenty years later, we’ve apparently achieved the next digit, topping 100 acres.

Janke made another comment, in passing, that caught my attention. He pondered, thinking out loud, about the legacy of these investment education events and the various companies that he met over the years. “I became aware of some wonderful companies and investment opportunities. In fact, I suspect that a mutual fund built from the presenters and sponsoring companies would have done quite well in the long term scheme of things.”

He spent a few moments talking about the fact that the stock market had gone down a fairly significant amount on the preceding day. His point? The investment value of the four presenting companies at the event had actually gone up. He touched on one of his favorite subjects… the long-term perspective and “When to Buy Stocks.” The consistent response? “Now. Today. No, not just any stock, but solid reliable firms with solid business models, exceptional quality and good prices.”

Ken then proceeded to describe some of the companies that he found “interesting” as study candidates. The attending presenting companies (American Business Products, Libbey, Synovus and General Electric) were included by default. Ken described powerful business opportunities and excellence in management at Intel. Research and development at companies like 3M was something he always found valuable and desirable. ConAgra has positioned themselves well in their market and their management seemed to anticipate opportunity. (Think ethanol, ultimately.) Disney. Powerful franchise and solid brand recognition world wide. Their recent purchase of ABC television was an example of a well-considered delivery strategy. Motorola is a leadership company that faced some tough short-term challenges. Johnson & Johnson and Abbott Labs have good products, a good track record and good people. Hannaford Brothers, an east coast food supermarket chain, was featured in Better Investing magazine and delivered solid returns until ultimately acquired.

The S&P 500 increased by 16.6 percent in the subsequent five years. Over the same time frame, 8% of equity mutual fund managers managed to stay ahead of the market. How did the “Janke Dozen” perform? The twelve stocks gained some 35 percent.

Ken openly admitted that he had no idea how much pizza Americans would eat in the future. He did know that our analysis, patience, discipline and time-honored approach to investing would often lead us to rewarding opportunities.

Make it so. Engage the possibilities. Pass the deep dish. Shop well.

MANIFEST 40 Updates

  • 20. Coach (COH)
  • 38. Wal-Mart (WMT)
  • 40. Costco Wholesale (COST)

Round Table Stocks

  • Coach (COH)
  • Costco Wholesale (COST)
  • Dollar Tree Stores (DLTR)
  • Fossil (FOSL)
  • Hibbett Sporting Goods (HIBB)
  • Michael Kors (KORS)
  • Nordstrom J.W. (JWN)
  • Pricesmart (PSMT)
  • Ulta Salons (ULTA)
  • Vera Bradley (VRA)

Best Small Companies

  • 9. Monro Muffler (MNRO)
  • 20. Francesca’s (FRAN)
  • 22. IMAX (IMAX)
  • 27. TUMI Holdings (TUMI)
  • 39. Five Below (FIVE)

Results, Remarks & References

Companies of Interest: Value Line (10/28/2016)

The average Value Line low total return forecast for the companies in this week’s update batch is 7.8% vs. 4.5% for the Value Line 1700 ($VLE).

Materially Stronger: DSW (DSW), Iconix Brands (ICON), Ulta Salon (ULTA)

Materially Weaker: Express (EXPR), GNC Holdings (GNC), Fred’s (FRED), Rent-A-Center (RCII), Vitamin Shoppe (VSI), Perry Ellis (PERY), Monro Muffler (MNRO)

Discontinued: Mattress Firm (MFRM), Tumi Holdings (TUMI)

Market Barometers

Value Line Low Total Return (VLLTR) Forecast. The long-term low total return forecast for the 1700 companies featured in the Value Line Investment Survey is 4.5%, unchanged from last week. For context, this indicator has ranged from low single digits (when stocks are generally overvalued) to approximately 20% when stocks are in the teeth of bear markets like 2008-2009.

Stocks to Study (10/28/2016)

The Long & Short. (October 28, 2016) Projected Annual Return (PAR): Long term return forecast based on fundamental analysis and five year time horizon. Quality Ranking: Percentile ranking of composite that includes financial strength, earnings stability and relative growth & profitability. VL Low Total Return (VLLTR): Low total return forecast based on 3-5 year price targets via Value Line Investment Survey. Morningstar P/FV: Ratio of current price to fundamentally-based fair value via www.morningstar.com S&P P/FV: Current price-to-fair value ratio via Standard & Poor’s. 1-Year ACE Outlook: Total return forecast based on analyst consensus estimates for 1-year target price combined with current yield. The data is ranked (descending order) based on this criterion. 1-Year S&P Outlook: 1-year total return forecast based on S&P 1-year price target. 1-Yr “GS” Outlook: 1-year total return forecast based on most recent price target issued by Goldman Sachs.

October Round Table October 25, 2016 at 8:30 PM ET ONLINE

Stocks Featured: TBD

The Round Table tracking portfolio has beaten the market by 3-4 percentage points over the last five years. Consider joining Ken Kavula, Hugh McManus and Mark Robertson as they share their current favorite stock study ideas.

We will be continuing the discussion of the relative return-based selling guideline for portfolio management.

Registration: https://www.manifestinvesting.com/events/201-round-table-october-2016

Investing: 2017 & Beyond October 29, 2016 at 9 AM ET Cincinnati, Ohio

  • Overview of Analysis (We’ll actually do a case study — walking through the analysis with exposure to our favorite resources and research.)
  • “Common Ground” – How investment clubs take care of a portfolio. We’ll review portfolio design and discuss management considerations. What is effective stock “watching?” How can we best be vigilant for opportunities and threats to our holdings?
  • “Discovery” – A demonstration of various screening resources with a look at some of our favorite resources.
  • “An Industry Study” – Taking a discovery and putting it through its paces to ensure that we’re considering (or accumulating and retaining the best of the best)
  • Let’s Talk Stocks – An interactive, audience-driven discussion of specific study ideas and case studies.

But not necessarily in that order … and we’ll likely add an emphasis on the 50 Best Small Company list.

Registration: https://www.manifestinvesting.com/events/202-cincinnati-investing-2017-and-beyond

Fave Five (9/23/2016)

Fave Five (9/23/2016)

Our Fave Five essentially represents a listing of stocks with favorable short term total return forecasts (1 year, according to Analyst Consensus Estimates, or ACE) combined with strong long-term return forecasts and good/excellent quality rankings.

So you’re looking at the stocks in the top 1% of all companies according to MANIFEST Rank (Return Forecast and Quality combination) that have the highest 1-year total return forecasts according to the analyst consensus estimates. (ACE)

The Fave Five This Week

  • Celgene (CELG)
  • Extra Space Storage (EXR)
  • Honda (HMC)
  • Stericycle (SRCL)
  • Ulta Salons (ULTA)

Context: The average 1-year total return forecast for the Value Line 1700 is 14.7%. The average 5-year return forecast for $VLE is 5.0% (annualized).

This Week’s Fave Five In The Sweet Spot

Sweet Spot Five. (September 23, 2016) Projected Annual Return (PAR): Long term return forecast based on fundamental analysis and five year time horizon. Quality Ranking: Percentile ranking of composite that includes financial strength, earnings stability and relative growth & profitability.

Weekend Warriors

The relative/excess return for the Weekend Warrior tracking portfolio is +6.3% since inception. 54.1% of selections have outperformed the Wilshire 5000 since original selection.

Tracking Dashboard: https://www.manifestinvesting.com/dashboards/public/weekend-warriors

Fave Five (9/9/2016)

Fave Five (9/9/2016)

We took another slight detour this week to focus on some high-quality stocks with superior long term return forecasts that are near the top of our Sweet Spot. It was a great week for the Weekend Warriors highlighted over the last year as the tracking portfolio now has a rate of return of 16.9% versus 11.2% for the Wilshire 5000 since inception.

The Fave Five This Week

  • Akamai (AKAM)
  • CVS Health (CVS)
  • Novo Nordisk (NVO)
  • Redhat (RHT)
  • Ulta Salon (ULTA)

Context: The average 1-year total return forecast for the Value Line 1700 is 14.7%. The average 5-year return forecast for $VLE is 5.5% (annualized).

This Week’s Fave Five: Top Of The Sweet Spot

Top Of The Sweet Spot. (September 9, 2016) Projected Annual Return (PAR): Long term return forecast based on fundamental analysis and five year time horizon. Quality Ranking: Percentile ranking of composite that includes financial strength, earnings stability and relative growth & profitability.

Weekend Warriors

The return for the Weekend Warrior tracking portfolio is 16.9% since inception. (Wilshire 5000 is at 11.2%) 48.3% of selections have outperformed the Wilshire 5000 since original selection.

Tracking Dashboard: https://www.manifestinvesting.com/dashboards/public/weekend-warriors