![]()
Fave Five (2/9/2018)
Our Fave Five essentially represents a listing of stocks with favorable short term total return forecasts (1 year, according to Analyst Consensus Estimates, or ACE) combined with strong long-term return forecasts and good/excellent quality rankings. The median 1-year ACE total return forecast is 14.7%.
By the way, the ferocity of the correction is on full display here, the median 1-year ACE total return was 1.7% just a couple of weeks ago. That reality, the bolstering fundamentals and a relative strength index that is creeping into “oversold territory” are among the reasons that diligent shopping can be pursued.
This week’s Fave Five will be a parade of several of our favorite screens, including the traditional long/short outlook, best in zone, launchpad ready, Triple Play qualified, etc.
Traditional Fave Five: NutriSystems (NTRI)
Best In Zone “Irish Spring”: Prestige Brands (PBH)
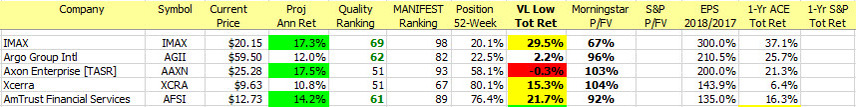
Launchpad Worthy?: IMAX (IMAX)
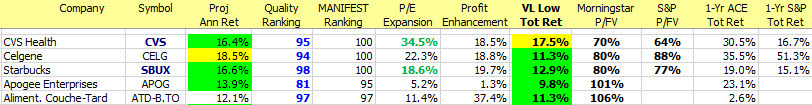
Triple Play Qualifiers: CVS Health (CVS)
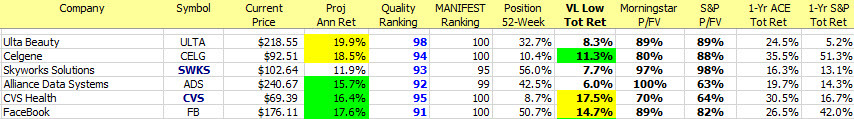
Heavy Hogs (2018): ULTA Beauty (ULTA)
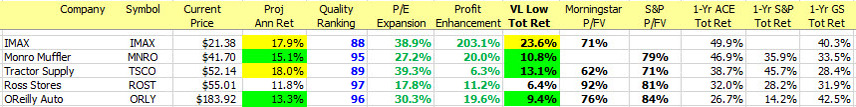
The Long and Short of This Week’s Fave Five
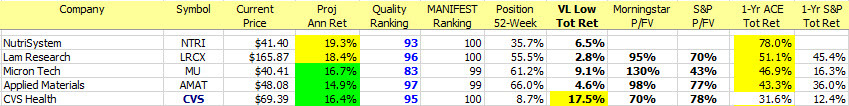
Long & Short Term Perspectives. (February 9, 2018) Projected Annual Return (PAR): Long term return forecast based on fundamental analysis and five year time horizon. Quality Ranking: Percentile ranking of composite that includes financial strength, earnings stability and relative growth & profitability. 52-Week Position: Position on scale between 52-week low price and 52-week target price. VL Low Total Return (VLLTR): Low total return forecast based on 3-5 year price targets via Value Line Investment Survey. Morningstar P/FV: Ratio of current price to fundamentally-based fair value via www.morningstar.com S&P P/FV: Current price-to-fair value ratio via Standard & Poor’s. 1-Year ACE Outlook: Total return forecast based on analyst consensus estimates for 1-year target price combined with current yield. The data is ranked (descending order) based on this criterion. 1-Year S&P Outlook: 1-year total return forecast based on S&P 1-year price target.
Best in Zone — “Irish Spring”
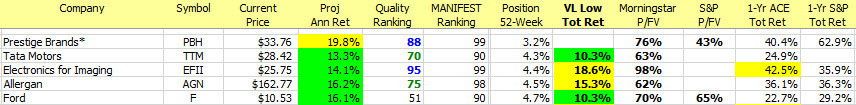
Long & Short Term Perspectives. (February 9, 2018) Projected Annual Return (PAR): Long term return forecast based on fundamental analysis and five year time horizon. Quality Ranking: Percentile ranking of composite that includes financial strength, earnings stability and relative growth & profitability. 52-Week Position: Position on scale between 52-week low price and 52-week target price. VL Low Total Return (VLLTR): Low total return forecast based on 3-5 year price targets via Value Line Investment Survey. Morningstar P/FV: Ratio of current price to fundamentally-based fair value via www.morningstar.com S&P P/FV: Current price-to-fair value ratio via Standard & Poor’s. 1-Year ACE Outlook: Total return forecast based on analyst consensus estimates for 1-year target price combined with current yield. The data is ranked (descending order) based on this criterion. 1-Year S&P Outlook: 1-year total return forecast based on S&P 1-year price target.
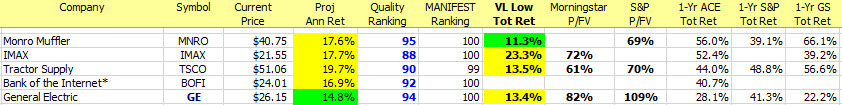
Launchpad Candidates
Reminder: These are companies exhibiting HUGE 2018 EPS forecasts versus 2017 projected/actual results. This is just a one year condition for this screen. Ideally, a stock with multi-year breakthrough and breakout potential could be discovered. Stocks exhibiting these characteristics have delivering participating clubs and individuals to the Groundhog Winner’s Circle in the past.
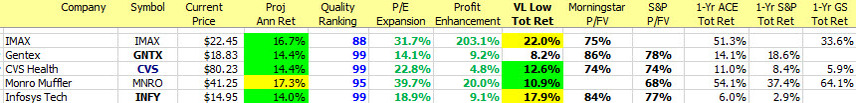
Triple Play Qualifiers
This group has decent (out-sized) long term return expectations in combination with the potential for P/E expansion and profitability/margin enhancement.
Heavy Hogs (2018)
These are the consensus selections — the most commonly selected stocks — among the Groundhog Challenge entries for 2018.
Fave Five Legacy (Tracking Portfolio)
The relative/excess return for the Fave Five tracking portfolio is +4.8% since inception.
The absolute annualized rate of return is 18.1%.
Tracking Dashboard: https://www.manifestinvesting.com/dashboards/public/fave-five