Fave Five (5/18/2018)
Our Fave Five essentially represents a listing of stocks with favorable short term total return forecasts (1 year, according to Analyst Consensus Estimates, or ACE) combined with strong long-term return forecasts and good/excellent quality rankings. The median 1-year ACE total return forecast is 12.6%.
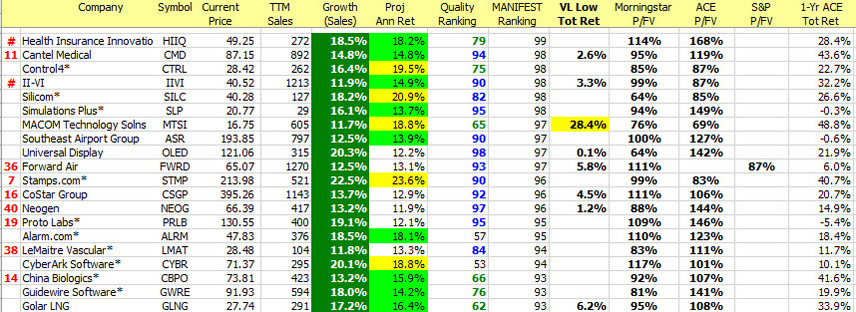
This week we swing for the fences. The only restriction we placed on the long term perspective was to require that the stock be in the sweet spot (or above) with a minimum quality ranking of 60. So we’re looking at good or excellent companies with — in some cases — exorbitant long term forecast that also have out-sized total return forecasts for the next year or so.
Amira Nature Foods (ANFI) is a repeat participant. ANFI was added to the tracking portfolio back in June 2017 and was “expelled” for dropping more than 20% versus the market in fairly short order. The price at the time was $4.21, so today’s current price of $2.30 is 45% lower than that exit point. This is a potential example of the Rule-of-5 sell discipline that Ken Kavula and Mark Robertson discussed and presented at the NAIC national convention.
Universal Display (OLED) is an active holding in the tracking portfolio and increasingly, a community favorite. Added back in October 2016 at $49.69, the price reached $209 before retracing back to $99.28. (We did think about selling near that $209 peak based on projected return > median market forecast in the Round Table also, but we blinked.) At the current price, this holding has still outpaced the Wilshire 5000 by 40.1% (annualized.) We’ve heard unsubstantiated reports of newborn children and grandchildren being named “Universal Display.”
Suburban Propane (SPH), Health Insurance Innovations (HIIQ) and Grupo Aeroport Pacifico (PAC) are new additions.
Suburban Propane is a Master Limited Partnership and should be viewed as a more suitable individual portfolio component. See: Investing in MLPs (Source: bivio.com, Laurie Frederiksen) MLPs are generally challenging for club/partnership portfolios.
Health insurance is a mess. Perhaps it’s a field of opportunity. HIIQ could be worth a study to see if they’re making gains and solving the Rubik’s cube.
PAC is a Motley Fool favorite and was recommended in the October 2016 issue by David Gardner in their Stock Advisor newsletter. “Grupo Aeroportuario del Pacifico operates 12 airports in Mexico’s Pacific region, including popular destinations such as Guadalajara, Tijuana, and Puerto Vallarta. This is a great collection of assets just south of our border. Because airport facilities don’t change much from year to year, many costs are fixed. Its revenues, however, are expanding thanks to rising passenger volumes and more revenues from passenger services such as restaurants and car rental. And since each incremental traveler is mostly profit, profits have accelerated and has rewarded shareholders with an ever-growing dividend. Although friction in the relationship between the U.S. and Mexico is a risk factor here, we expect long-term travel and trade trends to ultimately carry the day. As a result, near-term stock price volatility is giving opportunistic long-term investors a real buying opportunity.” — (Excerpt from a Stock Advisor Update, 2/9/2017)
The Long and Short of This Week’s Fave Five
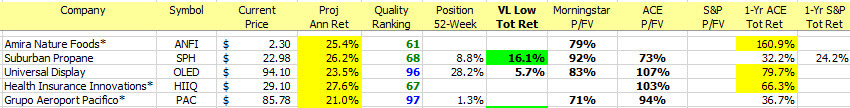
Long & Short Term Perspectives. (May 18, 2018) Projected Annual Return (PAR): Long term return forecast based on fundamental analysis and five year time horizon. Quality Ranking: Percentile ranking of composite that includes financial strength, earnings stability and relative growth & profitability. 52-Week Position: Position on scale between 52-week low price and 52-week target price. VL Low Total Return (VLLTR): Low total return forecast based on 3-5 year price targets via Value Line Investment Survey. Morningstar P/FV: Ratio of current price to fundamentally-based fair value via www.morningstar.com S&P P/FV: Current price-to-fair value ratio via Standard & Poor’s. 1-Year ACE Outlook: Total return forecast based on analyst consensus estimates for 1-year target price combined with current yield. The data is ranked (descending order) based on this criterion. 1-Year S&P Outlook: 1-year total return forecast based on S&P 1-year price target.
Fave Five Legacy (Tracking Portfolio)
The relative/excess return for the Fave Five tracking portfolio is +2.6% since inception.
The absolute annualized rate of return is 16.6%.
Tracking Dashboard: https://www.manifestinvesting.com/dashboards/public/fave-five