Gone RuleBreaker Shopping!


This month’s tracking portfolio, David Gardner’s Stock Advisors Rule Breakers, monitors the progress made over the last 14 years.

It’s a dashboard that the Plungers Investment Club would love. (At least for the non-core and adventure component of their holdings.) This month’s tracking portfolio, David Gardner’s Stock Advisors Rule Breakers, monitors the progress made over the last 14 years. We place $100 into each selection/decision and track the progress of that $100 investment over time.

Paths to Super Investor Returns?

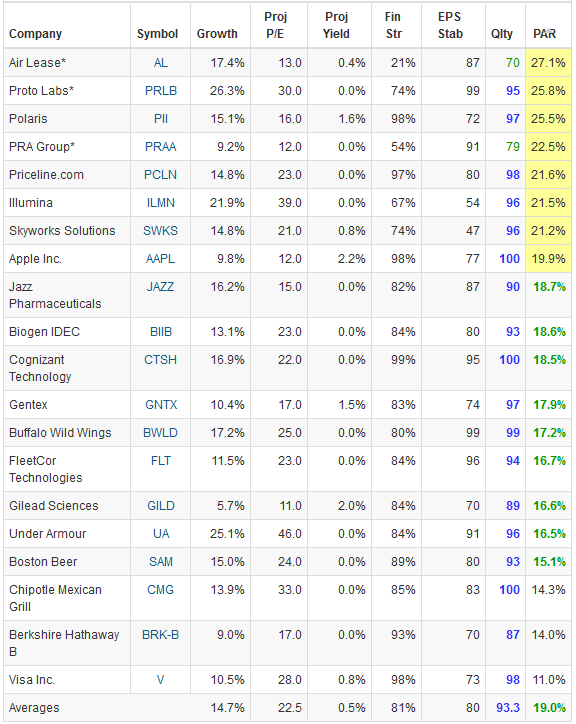
The active positions in the RuleBreaker with the highest return forecasts are featured in the accompanying dashboard excerpt. Rule Breakers focuses primarily on underappreciated growth stocks with solid management and a sustainable business strategy. This time-tested approach works. In fact, the Motley Fool Rule Breakers have consistently been among the leaders of Hulbert Financial’s rankings of 5-year performance. The media has taken notice as well with the Wall Street Journal previously calling Rule Breakers manager David Gardner one of the best stock pickers on Earth.

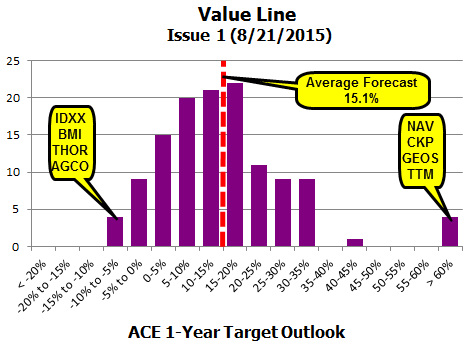
Our cover story review this month documented a 15.1% absolute return over the trailing 14 years — excess relative return of +7.2% over the Wilshire 5000. These results were achieved with a few roller coaster stocks like Amazon, Apple, Priceline.com, Activision Blizzard and Netflix. All of these stocks will have their speed bump moments.

The consensus forecasts in the dashboards may or may not resemble the expectations built by David and the Rulebreaker team of analysts. Tracking portfolio companies that David would deem worthy of study right now include: Illumina (ILMN), Texas Roadhouse (TXRH), Activision Blizzard (ATVI), McCormick & Co. (MKC), Amazon.com (AMZN), Apple (AAPL), Gilead Sciences (GILD) and Disney (Walt) (DIS).

Restoration Hardware (RH) is down 59.4% since selection back on 3/20/15. Do the fundamentals support a closer look? A strengthening economy could provide some bolstering as home repairs mend. The generic pharmaceuticals have been solid and Mylan Labs (MYL) has been on the radar for years. We featured Boston Beer (SAM) recently in the Fave Five and long-time Rulebreaker favorites like Apple, Gilead Sciences, Priceline.com and Amazon have returned to the sweet spot with return forecasts likely to place them in the buy zone. PayPal (PYPL) was recently featured by Kim Butcher during a Round Table session and Starbucks (SBUX) can be a jolt. There’s much to study here. Break at will.

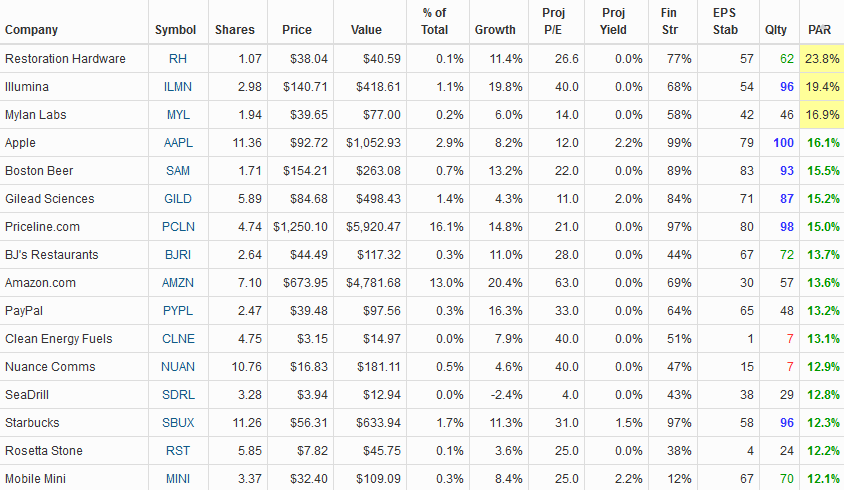
Stock Advisor Rule Breakers. Based on the flagship Motley Fool newsletter, $100 is invested into mentioned companies. The top 16 (by PAR) is shown here. The 14-year annualized rate of return is 15.1%. Source: http://www.fool.com, Stock Advisor


Mark Robertson is founder and managing partner of Manifest Investing, a source for research and portfolio management for long term investors. Fool on!

2 Guys Talk Stock (BINC)

We’re not sure which one is Jake and which one is Elwood, but the 2 Guys (Ken & Mark) completed the third leg (insert pirate joke here) of their mission as they rolled into Washington D.C. for the 2016 BI National Convention.

Observing that “Sweet 16” stocks in a stock search based on MANIFEST Rank > 99.44, our Ivory Soap screen … a study list of candidate companies is generated that easily dominated a good part of the hourly discussion.

Here’s the StockSearch results:

For more demonstration and discussion, investors can review the YouTube recording from the Chicago 2 Guys session via: https://www.youtube.com/watch?v=ysi7T_FTgx0

This Week: Stocks to Study

This Week at MANIFEST (5/20/2016)

“If you are not willing to learn, no one can help you. If you are determined to learn, no one can stop you.”

We gather. The convention serves a unique purpose. Because connecting investors can prove to be the most valuable resource imaginable for individual investors. In that context, the national convention becomes a true investment club — centered on sharing and discovering actionable ideas and pursuing successful investing, together.

During the current Book Club review of Peter Lynch’s Beating The Street, Hugh McManus mentioned the special session with Peter Lynch at the 1998 NAIC national convention in San Jose. Lynch reviewed many of the key points covered in the book during his speech. This reference inspired me to track down a copy of Smart Money from January 1999 where Emily Harrison Ginsburg provided a story on the heritage of NAIC via Thomas O’Hara. I thought Emily mentioned Peter Lynch in the article, but on further review, I found that she hadn’t. If you’re new to the investment club movement or simply want to go on a nostalgic binge, the Smart Money feature can be found here.

MANIFEST 40 Updates

Round Table Stocks: Caterpillar (CAT), Deere (DE), Illumina (ILMN), Landauer (LDR), Masimo (MASI), Stryker

Results, Remarks & References

Companies of Interest: Value Line (5/20/2016)

The average Value Line low total return forecast for the companies in this week’s update batch is 4.2% vs. 5.6% for the Value Line 1700 ($VLE).

Materially Stronger: Honda Motors (HMC), Nissan Motor (NSANY.PK), II-VI (IIVI), Edwards Lifesciences (EW), Baxter (BAX), Bruker (BRKR)

Materially Weaker: Manitowoc (MTW), OSI Systems (OSIS), Navistar (NAV), Fiat Chrysler (FCAU), Haemonetics (HAE), Douglas Dynamics (PLOW), Terex (TEX), Actuant (ATU)

Discontinued: Newport (NEWP), Affymetrix (AFFX), Sirona Dental (SIRO)

Coverage Initiated/Restored:

Market Barometers

Value Line Low Total Return (VLLTR) Forecast. The long-term low total return forecast for the 1700 companies featured in the Value Line Investment Survey is 5.6%, up from 5.4% last week. For context, this indicator has ranged from low single digits (when stocks are generally overvalued) to approximately 20% when stocks are in the teeth of bear markets like 2008-2009.

Stocks to Study (5/20/2016)

  • Illumina (ILMN) — Highest MANIFEST Rank
  • Honda Motor (HMC) — Highest Low Return Forecast (VL)
  • Fiat Chrysler (FCAU) — Lowest P/FV (Morningstar)
  • Honda Motor (HMC) —Lowest P/FV (S&P)
  • Cutera (CUTR) — Best 1-Yr Outlook (ACE)
  • General Motors (GM) — Best 1-Yr Outlook (S&P)
  • Alere (ALR) — Best 1-Yr Outlook (GS)

The Long & Short of This Week’s Update Batch

The Long & Short. (May 20, 2016) Projected Annual Return (PAR): Long term return forecast based on fundamental analysis and five year time horizon. Quality Ranking: Percentile ranking of composite that includes financial strength, earnings stability and relative growth & profitability. VL Low Total Return (VLLTR): Low total return forecast based on 3-5 year price targets via Value Line Investment Survey. Morningstar P/FV: Ratio of current price to fundamentally-based fair value via www.morningstar.com S&P P/FV: Current price-to-fair value ratio via Standard & Poor’s. 1-Year ACE Outlook: Total return forecast based on analyst consensus estimates for 1-year target price combined with current yield. The data is ranked (descending order) based on this criterion. 1-Year S&P Outlook: 1-year total return forecast based on S&P 1-year price target. 1-Yr “GS” Outlook: 1-year total return forecast based on most recent price target issued by Goldman Sachs.

May Round Table May 22, 2016 at 11 AM ET ONLINE

Stocks Featured: TBD

The Round Table tracking portfolio has beaten the market by 3-4 percentage points over the last five years. Consider joining Ken Kavula, Cy Lynch and Mark Robertson as they share their current favorite stock study ideas.

The May session will be simulcast from the NAIC Better Investing national convention near Washington D.C.

Round Table Online Registration: https://attendee.gotowebinar.com/register/8401811825391796481

Various attendance options — including single day passes — are available if you’re interested in attending the BI National Convention and the Round Table “live”: 2016 BI National Convention

Market Barometers (Continued)

Watching Rhino Walk, Not Rhino Talk. If you believe supply-and-demand matters (and you should) then the collective actions of the herd have bearing. By monitoring the relationship of new highs vs. new lows, we get an early warning clarion that signaled as Halloween 2007 approached. Current $USHL has recovered somewhat from the “test” a few months ago.

2 Guys Talk Stock (1/30/2016)

Two Guys Talk Stock

Ken Kavula and Mark Robertson share stock ideas, favorite sources of ideas and screening techniques during this Chicago event. The program is among the most popular at recent national conventions and is on the agenda for the NAIC National Convention (Washington D.C.) in May.

Favorite Resources and Screens Covered

Stocks Discussed

  • Luxoft* (LXFT)
  • Illumina (ILMN)
  • FleetCor Technologies (FLT)
  • Polaris (PII)
  • Customers Bancorp* (CUBI)
  • Popeye’s Louisiana Kitchen (PLKI)
  • Mesa Labs (MLAB)

View the program via YouTube: https://www.youtube.com/watch?v=ysi7T_FTgx0

16 Stocks On The Launch Pad?

Screening Results (February 2016)

In Search of “First Stage” Potential

by Mark Robertson

As we’ve watched the Broad Assets investment club win three of the last four years in the Groundhog group competition, we’ve searched for a common theme … a genesis of their statistically significant success.

Escape Velocity?

Our May 2014 cover story captured the essence pretty well. We’re looking for companies that are not only well-positioned for the long term with the insurance component of high quality, but companies poised to deliver large year-over-year increases in earnings. If we believe that stock prices follow earnings — and we do — it seems natural to seek these launch pad situations.

This month’s screening results are an attempt to do just that. The list that follows is a collection of excellent quality companies. But they also have relatively large expectations for 2016 earnings vs. 2015. The average forecast increase is 12.4%. All of these top that threshold. We include the relative strength index (RSI) for a glance at oversold potential. (RSI near 30) We’ll check back in a year to see if the EPS step changes take shape and if prices follow. If they do, it won’t hurt my Groundhog 2016 entry a bit.

20 Consensus Stock Selections

Here are the consensus selections from the participants in our annual stock picking contest — Groundhog X (2016) … twenty pretty good stock studies that could be worthy of a closer look.

The tracking dashboard can be accessed here: https://www.manifestinvesting.com/dashboards/public/heavy-hogs-2016

Heavy hogs dash 20160205

Growth: Top line growth forecast.  Projected P/E: Long term P/E ratio.  Projected Yield: Long term “average” dividend yield.  Financial Strength: Consensus ranking based on Value Line, Morningstar, S&P and debt quality considerations.  EPS Stability: Relative variability of EPS trend (2009-2019).  Quality: Percentile ranking based on financial strength, EPS stability and relative growth & profitability.  PAR: Projected Annual Return for long term return forecast.

Successful Stock Selection

This Week at MANIFEST (11/20/2015)

Success is a journey, not a destination. — Anonymous

“There are no secrets to success. It is a result of preparation, hard work … and learning from failure.” — Colin Powell

We’re better when we learn together. Success is better when experienced with your friends (and family.)

The contestants in this year’s NAIC Mid-Michigan chapter’s stock selection challenge faced the same difficult market as everybody else. The difference is that half of the entries scrapped and clawed to outperform the market over the trailing twelve months. And their consensus selections from one year ago BEAT THE MARKET for the 12th time in 13 years.

Taking home the gold for 2014-2015 was the FEMME$ Investment Club of Flint, Michigan. Their winning selections are shown here:

Consensus Favorites for 2015-2016

Yes, it’s a game. But it bears repeating. The consensus selections from this group of like-minded investors has beaten the S&P 500 in 12 of the last 13 years. Those selections — and we’d argue, formidable shopping list — are shown in the following dashboard.

https://www.manifestinvesting.com/dashboards/public/mid-mich-your-favorites-2015-2016

September 2015 Round Table

What: Round Table Discussion of Favorite Stock Study Ideas

When: Tuesday, September 29 at 8:30 PM ET

Where: Online. Register via https://www.manifestinvesting.com/events/178-round-table-september-2015

Who: Kim Butcher, Ken Kavula, Herb Lemcool, Hugh McManus and Mark Robertson

Why: Because we like to share ideas for successful investing. The selections made by Round Table participants have beaten the market over the last five years with a relative return of approximately +3.0%

Stocks Likely To Be Covered: Apple (AAPL), Illumina (ILMN), McGraw Hill Financial (MHFI)

The session (webcast) is FREE. Please invite your friends and family to attend.

If you’d like to be added to an email reminder list for this and all future (monthly) Round Tables, send a request to nkavula1@comcast.net

A Matter of Perspectives

This Week at MANIFEST (8/21/2015)

It’s a matter of perspective.

It is true that from a behavioral economics perspective [that average investors] are fallible, easily confused, not that smart, and often irrational. [They] are more like Homer Simpson than Superman. So from this perspective it [could be] rather depressing. But at the same time there is also a silver lining. There are free lunches! — Dan Ariely

The recipe for said free lunch depends on our willingness to be better investors — capturing all that patience and discipline will offer. Because the misbehavior of the herd ranks up there with death, taxes and gravity.

This week, we’ll spend a few moments taking a look at the weekly perspectives that we share from sources like Value Line, Morningstar, Standard & Poor’s, analyst consensus estimates and Goldman Sachs. What are their opinions and expectations? Forecasts? Time horizons? Do they always see things the same?

Of course not. And time horizon matters — a lot. But the profile of their opinions yields the stocks that capture our attention during every weekly update.

We also believe that taken collectively, much like our usage of MIPAR, the average “rating/score” can tell us something about the pessimism or optimism of the various research entities.

Value Line Investment Survey … A Most-Trusted Resource

We start with the Value Line Investment Survey — mostly because it provides the foundation of our weekly updates. 1/13th of the 1700 Value Line companies are updated each week.

As shown in the accompanying figure, the bell curve distribution of low total return forecasts features an average forecast (for the companies in the Issue 1 population) of 3.8%. Some of the higher return forecasts belong to GeoSpace (GEOS) and Navistar (NAV). We’re generally most interested in any high-quality companies that land in the blue circle as candidates for further study. Some of these can be found in our weekly summary table (see Value Line: Companies of Interest below).

Companies that are not “on sale” from the Value Line perspective would be Tesla Motors (TSLA) and Dexcom (DXCM).

Keep in mind that the only inputs to these results are (1) current price, (2) projected low price and (3) projected yield over an approximate 4 year period. (We continuously adjust the calculation for the actual number of years)

Companies of Interest: Value Line

The average Value Line low total return forecast for the companies in this week’s update batch is 3.8% — slightly lower than the 4.5% for the Value Line 1700.

Materially Stronger: Douglas Dynamics (PLOW), NextEra Energy (NEE), Natus Medical (BABY)

Materially Weaker: Navistar (NAV), ResMed (RMD), Gorman-Rupp (GRC), UltraTech (UTEK), Manitowoc (MTW)

Standard Coverage Initiated: Zimmer Biomet (ZBH)

Discontinued: Zimmer Holdings (ZMH)

Market Barometers

Value Line Low Total Return (VLLTR) Forecast. The long-term low total return forecast for the 1700 companies featured in the Value Line Investment Survey is 4.5%, unchanged from last week. For context, this indicator has ranged from low single digits (when stocks are generally overvalued) to approximately 20% when stocks are in the teeth of bear markets like 2008-2009.

Companies of Interest: Morningstar

Morningstar computes a discounted cash flow-based current fair value (FV) for stocks. As shown here, the population is slightly lower as only 57-of-125 of the Value Line issue 1 population is covered.

The price-to-fair value (P/FV) is simply a comparison of the current price to the current fair value. A value of 100% would be a “fair” price at this time. A value greater than 100% suggests that a stock is potentially overvalued — or priced at a “premium” — and a value less than 100% suggests a potential discount. The graphic has been “flipped” to align with the return forecast charts — basically mapping the less attractive stocks on the left and the more attractive stocks on the right.

This week’s P/FV leader is Tata Motors (TTM) with honorable mention to General Motors (GM), Ford (F) and Fiat Chrysler (FCA).

Companies of Interest: Standard & Poor’s (S&P)

Standard & Poor’s gives us two flavors of perspective:

  • A current fair value based on long-term discounted cash flow analysis that basically suggests what a “good” price for a given stock is today. The calculation is similar to the Morningstar analysis. The current price is compared to the “fair value” to form a P/FV ratio. 100% would be fair value. Less than 100% suggests a discounted price and a potential undervalued opportunity. Greater than 100% suggests that a stock is potentially overpriced.
  • The second perspective is based on a shorter time horizon (1 year or next 52 weeks) and gives another outlook for the covered stocks. For us, S&P provides a bridge between the long term analyses (Value Line, Morningstar and S&P) and the short term 1-year outlook generated by S&P, analyst consensus (ACE) and Goldman Sachs.

This week’s update batch delivers an interesting perspective on the potential of Toyota Motors ( TM ), Honda (HMC) and Nissan (NSANY) from the point of view of the S&P analysts. It’s an interesting bunching of these global automakers to the right hand side (consider buying) of the graphic.

The Outlook For The Coming Year

I’m not sure how useful this piece of information is to an investor versus a trader. It might prove useful in deploying conservative option strategies. But my instinct is that it could serve as one of the tiebreaking factors when comparing a few candidates for purchase. Given two stocks with equal return forecasts over the 5-year time horizon, I might be compelled to select the stock with the better 1-year outlook.

It’s interesting that the stocks on the far right are General Motors (GM) and Cummins (CMI) because both have been regarded as potentially “sluggish” for the coming year based on economic influences. Many of the capital-intensive equipment companies have been punished of late — and the global recession continues to hinder the near-term outlook for many of them.

Companies of Interest: Analyst Consensus Estimates (ACE)

According to the analyst consensus, the stocks with the best outlook for the coming year from this week’s update batch are: Tata Motors (TTM), Checkpoint Software (CKP), Geospace Tech (GEOS) and Navistar (NAV).

The average 1-year total return forecast is 15.1% — but we know the analyst consensus to be (1) volatile and (2) optimistic.

The ACE outlook consistently ranks as the highest among the research entities that we follow.

Our favorite source for analyst estimates is probably finance.yahoo.com with their 1-year price target and current yield — but we frequently audit the sample using benzinga.com and/or marketbeat.com and/or flashratings.com.

Companies of Interest: Goldman Sachs

Why Goldman Sachs? There are number of high visibility research firms from Bank of America (Merrill Lynch) to Morgan Stanley and other firms like Raymond James. But Goldman Sachs is the most influential based on empirical observations over a number of decades.

It’s best to own one of their “new favorites” before they add it to their conviction buy list or substantially raise their price target because you’re virtually guaranteed a boost in return. In fact, one of my colleagues used to use the Goldman Sachs buy and sell list to do just the opposite. He’d watch for exit opportunities after watching the price move up after a buy upgrade and look for shopping opportunities a few days after a sell recommendation.

Sometimes we get a broad update courtesy of articles like this one: Goldman Sachs: Buy and Avoid List (March 2015)

Stocks to Study (8/21/2015)

  • Illumina (ILMN) — Highest MANIFEST Rank
  • Geospace Tech (GEOS) — Highest Low Return Forecast (VL)
  • Tata Motors (TTM) — Lowest P/FV (Morningstar)
  • Nissan Motors (NSANY) — Lowest P/FV (S&P)
  • Tata Motors (TTM) — Best 1-Yr Outlook (ACE)
  • Cummins (CMI) — Best 1-Yr Outlook (S&P)
  • Ford (F) — Best 1-Yr Outlook (GS)

Note: The price targets from Goldman Sachs are from public releases and represent a partial sample. The price target is logged as of the most recent public analyst report. Although every effort is made to keep this information as current as possible, some of the ratings may not reflect more recent research and updates.