Huge Expectations

We’ll monitor this as we roll along the data array updates over the next several weeks of update batches. But the early returns do show quite a bump in expectations for 2018 and 2021.

Observations

  • This is a work-in-progress. Think of it like “exit polling” with 30% of “precincts” reporting as we’ve logged the forecasts for 2018 and 2021 for issues 1-4 so far.
  • The sales bump for 2018 is significant and material. It will be interesting to see if it persists.
  • The long term growth trend has been “bent” back to 3.5-4.0% with the optimism. As shown, growth in the “New Normal” has been pretty close to zero.
  • The recessionary conditions for 2015-2016 become a little more obvious here. Although not an official recession, profitability lagged for many companies in recent years. We also see the traditional Value Line analyst optimism in the 3-5 year forecasts for net margin.
  • Average P/E forecasts for 2017 seem a little elevated but not as much as we read and hear from the pundits. If the exuberant forecasts from the rhinos materialize, the burst of EPS (E) will do a lot for the P/E equation. We also note that the 3-5 year P/E forecasts are not “outlandish” and suggest at least a semblance of moderation for the long term outlook, company by company.

Trucking In Tulsa (3/10/2017)

This Week at MANIFEST (3/10/2017)

Common Sense, Care Of Catoosa

“If you want to be successful, it’s just this simple. Know what you are doing. Love what you are doing. And believe in what you are doing.” — Will Rogers

No, I haven’t forgotten that the trucking and logistics stocks are in Issue 2 and that this week’s update centers on Issue 4 — home to many healthcare and aerospace/defense stocks.

It’s just that a significant number of hours sharing lanes with Knight Transportation, Swift, Old Dominion and a number of CVS Health semis provides some time for pondering while en route on Route 66 to the Port of Catoosa. (Tulsa)

Ken Kavula and I were met in Catoosa by a throng of committed long term investors and we greatly enjoyed spending the weekend with them. Ken did his travel research on the Issue 1 airlines and perhaps he can explain Buffett’s sudden interest in the group, but that’s a topic for another day. Probably.

We took a stroll through 70 years of investing better — together. Some rules and guidelines were reinforced. Others were disturbingly challenged. We were reminded how the Tin Cup model portfolio handled the 2007-2008 market challenge and wondered why we spend so much time worrying about asset allocation (shifting to cash equivalents when the market seems overpriced.) Our subscribers fondly remember our 2008 open letter to the Presidential candidates: An Open Letter To The President.

Is the market over priced? What if it’s not? Recall those surging estimates for S&P 500 earnings from the analysts a few weeks ago. If they’re right about 2018, 2019 and beyond …

If the accompanying chart isn’t “haunting” or reinforcing — it probably ought to be.

And in that spirit, we think it probably makes sense to keep doing what we always do … INVEST IN THE BEST, but only when they’re on sale. We’ve never seen a moment where we couldn’t find several worthy stocks. If we ever do, we’ll start worrying about electric fences.

“With a sufficiently long term perspective, bear markets become blips.” — Cy Lynch

Thanks, Catoosa.

MANIFEST 40 Updates

Round Table Stocks

Best Small Companies

(None)

Results, Remarks & References

Companies of Interest: Value Line (3/10/2017)

The average Value Line low total return forecast for the companies in this week’s update batch is 1.9% vs. 2.9% for the Value Line 1700 ($VLE).

Materially Stronger: Community Health (CYH), Regeneron Pharma (REGN), Illinois Tool Works (ITW), Anthem (ANTM), Envision Health (EVHC)

Materially Weaker: Tenet Healthcare (THC), Quality Systems (QSII)

Discontinued: Clarcor (CLC), Tessera Tech (TSRA)

Market Barometers

Value Line Low Total Return (VLLTR) Forecast. The long-term low total return forecast for the 1700 companies featured in the Value Line Investment Survey is 2.9%, down from 3.0% last week. For context, this indicator has ranged from low single digits (when stocks are generally overvalued) to approximately 20% when stocks are in the teeth of bear markets like 2008-2009.

Stocks to Study (3/10/2017)

There continues to be evidence of strengthening fundamentals and 1-year price targets are getting adjusted upward, on balance. Many of the biotech and pharma companies are showing the damage — and resultant higher return forecasts — as a result of “bashing” and criticism from inside the Beltway.

Based on the near term expectations for Round Table selection MEDNAX (MD), it will be interesting to see if we’re truly “early” and/or if we catch a wave as the S&P and Morningstar and Goldman Sachs analysts catch up with us. [Grin] […and Hope]

The Long & Short. (March 10, 2017) Projected Annual Return (PAR): Long term return forecast based on fundamental analysis and five year time horizon. Quality Ranking: Percentile ranking of composite that includes financial strength, earnings stability and relative growth & profitability. VL Low Total Return (VLLTR): Low total return forecast based on 3-5 year price targets via Value Line Investment Survey. Morningstar P/FV: Ratio of current price to fundamentally-based fair value via www.morningstar.com S&P P/FV: Current price-to-fair value ratio via Standard & Poor’s. 1-Year ACE Outlook: Total return forecast based on analyst consensus estimates for 1-year target price combined with current yield. 1-Year S&P Outlook: 1-year total return forecast based on S&P 1-year price target. 1-Yr “GS” Outlook: 1-year total return forecast based on most recent price target issued by Goldman Sachs.

Apple & Long Term Perspective

The business model changed …

Growth appears to be plateauing …

P/E ratios are moderating and settling into “mature company” characteristics for this industry …

Stock price follows earnings.

How many times have you scratched your head over questions like these during your studies of companies? Our most widely-followed company, Apple (AAPL) turns out to be a pretty good study of changing conditions for company over a span of a few decades. Here’s the business model visual analysis.

Apple (AAPL): Business Model Analysis (1984-2020). Did you know that the road to “today’s Apple” and the mother ship piloted by Tim Cook was this bumpy and turbulent? There’s a couple of things that stand out — from the long term double digit growth to the years with negative earnings (1996-1997,2001) to what clearly seems to be a new trajectory over the last decade.

Apple (AAPL): Profitability, Net Margin (1984-2020). The volatile profitability of the company is on full display for 1984-2005. When speaking of shifts in business models, it can often be discerned from the profitability profile and Apple is something of a poster child here. Note the ramp up as the iPhone emerged as a ubiquitous necessity and the elevated net margins delivered over the last several years. This is how a company ends up with $80 billion in the check book after paying dividends and buying back 20-25% of shares outstanding.

Apple (AAPL): P/E Ratios (1984-2020). One of the things many investors have wondered about Apple over the decades is “Why the P/E of 10x or so?” The answer lies in the preceding roller coaster of bottom line (profitability) — a condition that inhibits P/E ratios for most companies. The P/E ratio has actually been pretty stable over the years, considering, and a case for low to mid-teens can be made and substantiated. One could also argue that continuing to maintain the current profitability levels could promulgate some higher P/Es …

Round Table (November 2016)

November Round Table

Our Round Table, a monthly session featuring our favorite stock ideas right now in true round table fashion, was held November 29.

Stocks Discussed

  • CVS Health (CVS)
  • Infosys Tech (INFY)
  • Mercadolibre (MELI)

The stocks selected for this program over the last six years have collectively beaten the Wilshire 5000. The excess return (annualized) has been ranging from 2-3%. We seek actionable opportunities to study and pursue.

The agenda will also include a continuation of our selling decision concept based on relative return.

The round table knights include small company champion and Mid-Michigan Director Ken Kavula; Cy (MythBuster) Lynch; pharmaceutical scientist Hugh McManus; and Manifest Investing’s Mark Robertson who will analyze their favorite stocks. Guest damsels have included Anne Manning, Susan Maciolek and Kim Butcher. Guest knights who have jousted include Nicholas Stratigos, Herb Lemcool and Matt Spielman.

The audience selected CVS Health (CVS).

Positions closed/sold: Knight Transportation (KNX), Landauer (LDR), PRA Group (PRAA), US Physical Therapy (USPH)

The tracking portfolio has been updated at: https://www.manifestinvesting.com/dashboards/public/round-table

Rt poll 20161129

Relatively Better Selling?


During the October Round Table, we discussed our exploration into the possibility of building an excess/relative return based trigger to limit losses and preserve capital.  We repeat. This is intended to be incremental and additive to the time-honored selling guidelines reviewed here and this is a work-in-progress.  We’re continuing to review whether the trigger point should be variable (a function of inherent characteristics) and whether the 1-year vigilance period is appropriate.  This reprint is a recent cover story from Manifest Investing that provides a thumb nail of the concept/project.

“The ability to select stocks, manage them over time and know when to sell them is incredibly difficult, even for professional fund managers.” — Barry Ritholtz

When to Sell: The Challenge of Reason We don’t want to give the impression that any of the time-honored selling disciplines change with the exploration/concept described here. We still believe that the reasons for selling are short and simple: (1) You need the money, (2) Signs of quality degradation and (3) You can make the portfolio better. That said, we’ll explore this capital preservation and rate of return potential enhancement and decide if it’s a worthy improvement in our arsenal.

During the April Round Table, we struck a community collective nerve. We reminded that we’ve deployed a new selling discipline in a few different places that is based on the notion of an alert, or a flag, based on relative return. Based on the case studies with the embryonic Fave Five Weekend Warriors and Round Table tracking portfolios the concept is compelling. The approach is incremental. Nothing about our traditional selling disciplines is disrupted. This month, we explore the impact of this concept on the Solomon Select monthly features over the last 11-12 years. will be intended to side step excursions and preserve capital.

“The ability to select stocks, manage them over time and know when to sell them is incredibly difficult, even for professional fund managers.” — Barry Ritholtz

I’d go a step further than Barry and say that “especially” might be more acurate (than “even”) for rhinos and average investors. It might even be more challenging when it comes to companies doing share repurchases. But that’s a story for another day.

We’re here for the returns. Anything that offers the potential of an incrementally higher performance is something that grabs our attention. We’ve long been troubled by selections that have underperformed, rapidly losing 60-80% of the purchase price — in some cases within a few months of the original decision. It seems like the damage is often done in 90 days or less. So we decided to subject the monthly decisions made for the Solomon Select feature to this concept. Many stocks have been “sold” when the stock price soared and the return forecast dropped below the market average. Victory laps are always fun. Those stocks have been celebrated and “dismissed” from the tracking portfolio over the years. But what about the other extreme? It’s a question that has haunted many of us — for a long time.


Total Assets vs. “Small” Incremental Returns. The audience at the Better Investing national convention treasured this reminder about small advantages and huge gains in incremental results. We do, too.


Investing $100 each and every month into the Wilshire 5000 since the inception of Manifest Investing would deliver a passive rate of return of 9.6%.

So far, using the original three selling criteria, the tracking portfolio rate of return is 11.1% — a relative rate of return vs. the total stock market of +1.5%.

Implementing at relative return “stop”/alert concept explored here increases the rate of return since inception to 13.3% —2.2% higher!

The accompanying figure courtesy of Walter Schloss and his track record is a powerful reminder about the vast gains possible over the long term from a “percentage point or two.” And yes, Virginia, it’s exponential.

+2.2%?

Yes, +2.2%. Matching the market at 10% over the period shown for Walter Schloss netted $4114 from the original $100. Beating the market by 2%, or 12% absolute, turned that $100 into $8308. Tacking on a mere +2.2%, or an additional two percentage points swells that $8308 to $16,569. It’s the answer to “When is 2% actually worth 100%?”

Think about it. +2% matters.

Iconix Brands (ICON): Time Out! Poster child for a concept. $1000 invested in ICON for the Round Table tracking portfolio had sunk to $800 against a flat total stock market. “Selling” preserved the $800 which would have plummeted to $330 within a few months.

“Time Out” Based on Relative Return

The concept is simple. It’s inspired by one of the steadfast rules on selling stocks made popular by Investor’s Business Daily and William O’Neil. Their discipline is to sell any holding that drops 7-8% from the original selection point. In our view, this would lead to excessive turnover if we attempted to apply the discipline to our style of investing. But the preservation of capital concept has merit and the general approach of “stopping” to check for assumption errors, etc. seems worthy.

But we’d want to avoid selling a stock that drops 8% when the total stock markets drops, for example, 10%. Hence, our focus and emphasis on relative return. We want to single out stocks that have under performed the overall market on an individual, and comparison, basis.

We’ve discussed this at a few Round Table webcasts and most notably during the selection of Iconix Brands (ICON) during April 2009. We now see the ICON case as something of a “poster child” for the concept. The original $1000 invested in ICON as part of the Round Table tracking portfolio on 4/30/2015 had dwindled to $800 by 8/3/2015. The Wilshire 5000 had actually gained 0.1% over the same period. As shown in the accompanying figure, ICON continued its swoon. This finance.yahoo.com chart is constructed by comparing the price of the stock with VTSMX with the selection date as the start date and displayed on the far left. The relative return is the difference between the blue and red lines over time.

As shown, the swoon did not stop at $800 and the original $1000 invested was worth only $256 by 11/6/2015. Was a “time out” clearly in order after dropping the original 20%?

Solomon Select Suggestion

So we asked a question. Actually, a few questions.

(1) Are there any cases of a stock “bottoming” and getting toggled out of the portfolio where the selection had gone on to deliver market-beating returns?

(2) Is 20% the right number?

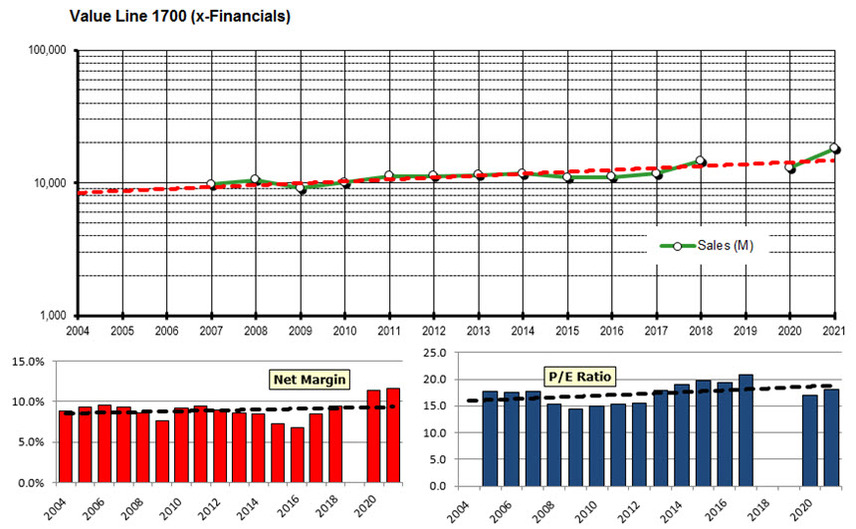
One of the earliest Solomon Select features was Oracle (ORCL) back in May 2005. As shown, ORCL trailed the overall stock market by approximately 15% in early 2006. Setting the limit closer to 15% would have stopped out this strong performer — +7.2% annualized relative return for 11 years. We were not able to find another case where a “premature” time out would have ultimately prevented a strong long term performance.

(3) Would 20% result in a high turnover rate?

We found that (24) of the 134 transactions made over the last eleven years for the Solomon Select feature actually triggered the 20% condition. The names read like a roll call of disappointment: American Capital Strategies, Atwood Oceanics, Capella Education, Coach, Dolby Labs, Garmin, Landauer, Nokia, Quality Systems, Strayer Education, Urban Outfitters …

(In all fairness, companies like Coach and Urban Outfitters also have SUCCESSFUL close outs within the Solomon Select tracking portfolio — a condition that we’d probably reasonably expect from this relatively volatile sector.)

So we’re generally looking at a couple of instances per year — a notion shared by one Round Table webcast participant who wondered if this wouldn’t simply flag companies on the wrong end of the Rule-of-Five … and reduce losses, pain and suffering? Bottom line: We don’t know if 20% is the number — it may be variable and perhaps a function of quality, for example — but a target setting in this range would not seem to produce excessive turnover.

(4) What is the typical holding period for these triggered transactions?

With one exception (Qualcomm at 3.3 years), the 20% limit triggered in less than 18 months with an average holding period of approximately 9 months. That would be easy to remember! Nearly 50% of the cases triggered in less than six months.

(5) Do the tools exist to do this?

Not exactly. An investor could use spreadsheets but we’re not aware of an existing commercial source for tracking this condition. Would we add it to Manifest Investing? Possibly. If our explorations continue to show this potential, we’ll consider adding this type of performance tracking as a portfolio management tool.

Our Like-Minded Community Heard From

We think the concept is both intriguing and compelling. Our community of investors apparently agrees as we’ve received an unusually large amount of correspondence on the subject. Most of it rhymes with this:

“I think you guys could really be on to something here. In the same way that Stock Selection Guide based studies can be messed up by a plummeting stock price – with Upside-Downside ratios run amok – and a company that is struggling actually can appear ‘more attractive’ on a Guide … I think this concept holds merit for gauging and challenging those stocks with PARs greater than the sweet spot.”

“This could be a game changer. I’ve been looking for a concept like this for a very long time.”

In short, I think the potential is promising. Probably at least as compelling as embedding the analyst estimates in our business model analyses. It’s not a violation of “buy low and sell high” because we’re here for the returns and it’s the bigger picture, the cumulative results that matter. We’ll continue to test other portfolios and implement standing procedures that may become disciplines and best practices over time.

Wrong Way To View Investment Risk?

After a cursory review, I’m wondering if this book doesn’t have the potential to parallel (and rhyme with) Nicholson’s 1984 Individual Investor’s Manual and for that reason, I’ve ordered my advance copy for a closer look. As you read this overview, notice how often the things he says, starting with the definition of risk through the eyes of a disciplined long-term investor, the recovery following the Great Recession of portfolios like Tin Cup … and a host of other philosophies that we hold dear, including but not limited to our practice of all-of-the-above investing. (Note his references to the equally-weighted Wilshire 5000) His objective mapping even resembles our +5% mantra. I look forward to a closer look and sharing thoughts with our community of investors during a future book review.

Looking at Investment Risk the Wrong Way

by James B. Cloonan, AAII Founder and Chairman

We have all been looking at investment risk the wrong way. And unfortunately we have been paying dearly for this mistake. Please allow me a moment to explain this statement and to teach you how you can change your day-to-day investment approach to compensate for what has more than likely been years of under performance.

You can easily produce much more investment return if you are willing to embrace what I call Level3 logic and reason when dealing with your investment program. The simple truth is that every long-term investor will hit two, perhaps three, major market downturns in their investment life.

Historically, these major downturns take only 3 to 4 years to recover from (come back to even) if you were to do nothing but simply stay in the market. Remember, markets have historically always risen and that is a great advantage for the individual investor … But the financial press, CNBC and Wall Street has everyone brainwashed to believe that we need to put 40%, 50% or even 60% of our assets into so-called safe investments (bonds and cash). Investing with that level of safety is insane when you realize that since 1871 market downturns have recovered as follows:

  • 33% of market downturns recover within a month
  • 50% of market downturns recover within 2 months
  • 80% of market downturns recover within 1 year
  • 95% of the time, those big “once or twice in a lifetime drops” return back to even in 3 to 4 years with an appropriate portfolio

Collectively, since 1871 the time it takes for the market to recover (top to trough to top again) is a mere 7.9 months. (This context and perspective is urgent to understanding what we do and how we do it.)

Unfortunately, most individual investors watch daily, weekly, monthly and quarterly market moves like their life depends on it. The logical and far more reasonable way to invest is to put only what you will need to withdraw from your portfolio for living expenses over the short term into extremely safe (cash-like) accounts and to invest the rest of your assets in stocks. I define short-term as 3 to 4 years. This is a logical and rational use of funds that serve as a safety net that can be used to ride out any downfall Mr. Market throws our way. It also serves to keep us from having to focus on the near-term performance results of our portfolios. Having a near-term safety net allows investors to be more aggressive in the overall stock portion of their portfolios while being able to simultaneously ignore short-term market swings.

The equal-weighted Wilshire 500 index represents a much broader basket of companies and has a much larger number of small-cap and mid-cap stocks in its holdings. That smaller company skew is what propelled the Wilshire 5000 equal-weighted index up to an annualized return of 17.1% over the past 45 years (the longest data set available for this segment of the market).

Trust me when I say that long term most investors would be jumping up with joy to achieve just the S&P 500’s return. But the fact is, most investors fail to come even close to the overall market return, let alone our favored cousin – the equal-weighted Wilshire 5000. In-the-know researchers and studies from actual brokerage account transactions show that most investors get into and out of the market at the absolute wrong time. That coupled with their fixation on large-cap growth stocks has produced returns that are closer to 7% or 8% on an annualized basis.

Following the Level3 Investing approach that I have developed allows investors the ability to implement 3 investor advantages that can propel portfolio returns and generate huge sums of wealth:

Advantage #1—My Level3 Investment Strategy teaches you how to understand and use risk to your advantage by building a cash cushion that will weather any market downturn. Simultaneously the strategy frees you to put more of your assets into higher returning portions of the investment marketplace – individual stocks and a handful of passive ETFs (I call them forever funds.)

Advantage #2—Level3 Investment Research has tapped into academic and time-tested studies to show beyond a reasonable doubt that investment portfolio growth comes from small and mid-cap stocks not large-cap companies. So if you are a long-term investor, you should be looking closely at building up not only the overall size of your equity portfolio but the percent you equate to small and mid-cap stocks and funds. Remember, these are the types of investments that history shows have outpaced the overall market by more than 4% per year. Average investors produce 8% return, while a Level3 approach should produce 12%. Regardless of the size of your portfolio, that 4% difference will provide you with twice the assets of a regular investor in 18 short years.

Advantage #3—Level3 Investing drives home the use of Time Diversification. My new Level3 approach uses investment research that has proven that no matter how much the equity market collapses it historically has always exceed its previous high.We know that investing can be difficult when markets drop, but as an individual investor you must remember that history shows that all dips all crashes and all drops ultimately lead to higher returns. Market data since 1871 bears this out. And best of all, the kinds of stocks that Level3 investing favors are the kinds of stocks that rebound the fastest! Going forward, if you can keep the concept that time favors the individual investor in the forefront of your mind, you will find that investing becomes much easier.

If you are interested in becoming a Level3 type of investor, I encourage you to do the following …

Accept that true investment risk is not some arbitrary percentage downfall in the market this day, week, month or year, but that investment risk is actually failing to meet your retirement lifestyle goals because the funds we reasonably expect to have are NOT THERE when needed. That’s the Level3 definition of long-term risk, not having the assets needed to live the life you deserve!

Think about what it means to be a true long-term investor and recognize that any funds you need in the next 4 to 5 years should simply not be invested in stocks or bonds. Your near-term spending needs should be placed in money market accounts, CDs or savings. Thus when and if the market drops, near-term you know that you will have the funds needed to live your current lifestyle and not have to worry about selling at a bottom to get cash or fleeing the overall market because you are afraid of losses. This one simple strategy allows you to earmark the bulk of your overall assets into long-term Level3-type stock and fund investments that can generate wealth quicker than any other asset class.

Recognize that greater long-term [appreciation] comes from investing in smaller and mid-cap companies. If these types of holdings are not in your portfolio, consider adding them. You can start by looking into Guggenheim’s RSP or you can use the link below to purchase my new “Investing at Level3” book where I share a handful of ETFs that you could simply hold forever.

“Investing at Level3” is a refreshingly simple and historically proven way to invest that has the power to greatly impact your wealth as well as your retirement lifestyle.

The “Investing at Level3” approach, if followed diligently, could double or triple the value of a portfolio at retirement for the long-term investor when compared to today’s current investment practices. The book provides a research-driven yet easy-to-use approach to help individual investors with overcoming their unease with investment risk, investing while in retirement, investment selection, asset allocation, retirement funding and more.

Fondly,

James B. Cloonan
AAII Founder and Chairman

  • The Wilshire 5000 Equal Weighted index is not generally quoted and has no symbol. There is no fund replicating it because many of the stocks have limited float, but it does serve as a good proxy for the type of investing I outline in my new book “Investing at Level3.” If I have piqued your interest, current and past values can be found at Wilshire.com under the Wilshire Index Calculator. (This is why we use the Value Line Arithmetic Average, $VLE via www.stockcharts.com)

Wall Street on Water … Ahead

This Week at MANIFEST (9/23/2016)

If you’ve ever wondered what a cruise ship class room looks like, here’s Christi Powell (Oklahoma City) aboard the Holland Cruise Lines Westerdam doling out another one of her exceptional classes on common sense financial matters. This voyage had two side-by-side class rooms, attended pretty much as you see here. As you can see, it’s like any other class room — except for the glaciers, whales, salmon and Alaskan fjords out the window.

Relatively small blocks of time (1 hour each) were carved out during the cruise to present a number of investing-related classes over a span of seven days. It was the first time Manifest Investing had attended and participated in one of these efforts and we came away impressed with the potential. The pace was unhurried and attendees had plenty of opportunities over dinners and while navigating the waters to discuss just about anything. We’ll probably explore collaborating with Better Investing and reaching out to some other communities for a Boston-to-Montreal version of this cruise next year. Stay tuned for more details and please send us a note (manifest@manifestinvesting.com) if you’d be interested in exploring more details about a future cruise… and we’ll add you to the “Maybe” Manifest. (grin)

There were many highlights and we’ll continue the roll out of the handbook chapters we issued to our ship mates in days ahead.

MANIFEST 40 Updates

  • 4. Fastenal (FAST)
  • 15. Procter & Gamble (PG)
  • 31. Home Depot (HD)
  • 35. Lowe’s (LOW)

Round Table Stocks: Chicago Bridge & Iron (CBI), Fastenal (FAST), Tractor Supply (TSCO)

Best Small Companies (None this week)

Results, Remarks & References

Companies of Interest: Value Line (9/23/2016)

The average Value Line low total return forecast for the companies in this week’s update batch is 5.0% vs. 5.0% for the Value Line 1700 ($VLE).

Materially Stronger: Ethan Allen (ETH), Bemis (BMS)

Materially Weaker: Sunpower (SPWR), Tractor Supply (TSCO), Tile Shop Holdings (TTS)

Discontinued: Cablevision (CVC), Elizabeth Arden (RDEN)

Market Barometers

Value Line Low Total Return (VLLTR) Forecast. The long-term low total return forecast for the 1700 companies featured in the Value Line Investment Survey is 5.0%, unchanged from 5.0% last week. For context, this indicator has ranged from low single digits (when stocks are generally overvalued) to approximately 20% when stocks are in the teeth of bear markets like 2008-2009.

Stocks to Study (9/23/2016)

The Long & Short. (September 23, 2016) Projected Annual Return (PAR): Long term return forecast based on fundamental analysis and five year time horizon. Quality Ranking: Percentile ranking of composite that includes financial strength, earnings stability and relative growth & profitability. VL Low Total Return (VLLTR): Low total return forecast based on 3-5 year price targets via Value Line Investment Survey. Morningstar P/FV: Ratio of current price to fundamentally-based fair value viawww.morningstar.com S&P P/FV: Current price-to-fair value ratio via Standard & Poor’s. 1-Year ACE Outlook: Total return forecast based on analyst consensus estimates for 1-year target price combined with current yield. The data is ranked (descending order) based on this criterion. 1-Year S&P Outlook: 1-year total return forecast based on S&P 1-year price target. 1-Yr “GS” Outlook: 1-year total return forecast based on most recent price target issued by Goldman Sachs.

Stock Selection & Portfolio Management September 24, 2016 at 9:00 AM ET Indianapolis, Indiana

Ken Kavula & Mark Robertson will be the featured presenters at this all-day educational workshop for long-term investors. Overview of Analysis (We’ll actually do a case study — walking through the analysis with exposure to our favorite resources and research.) Common Ground – How investment clubs take care of a portfolio. We’ll review portfolio design and discuss management considerations. What is effective stock “watching?” How can we best be vigilant for opportunities and threats to our holdings? Discovery – A demonstration of various screening resources with a look at some of our favorite resources. An Industry Study – Taking a discovery and putting it through its paces to ensure that we’re considering (or accumulating and retaining the best of the best) Let’s Talk Stocks – An interactive, audience-driven discussion of specific study ideas and case studies.

For more information: Go here.

September Round Table September 27, 2016 at 8:30 PM ET ONLINE

Stocks Featured: TBD

The Round Table tracking portfolio has beaten the market by 3-4 percentage points over the last five years. Consider joining Kim Butcher, Ken Kavula, Hugh McManus and Mark Robertson as they share their current favorite stock study ideas.

We will be continuing the discussion of the relative return-based selling guideline for portfolio management.

Registration: https://www.manifestinvesting.com/events/199-round-table-september-2016

Discovery Club

“Dump your hedge funds and explore their small-cap stock picks.”

Small cap is not necessarily small (faster-growing) companies but in general, we like the idea of a nice blend. So yes, we’re interested in hunting down some actionable ideas among the most successful investors on our radar screen — seeking companies that aren’t on too many radar screens, yet.

The discovery of smaller, promising and faster-growing companies has always been one of our favorite (and rewarding) activities. In that spirit, we’re expanding our efforts in this realm. This week, we redouble our efforts to discover some smaller, less discovered companies and add them to our coverage. The EXTENDED EDITION of the Value Line Investment Survey will be the first resource scanned and we’ll also take a look at some new positions or significant accumulations among our Best Small Company Funds starting with Brown Small Company.

But it doesn’t end with only the smaller companies, we’ll also be vigilant for opportunities flagged by reviewing the quarterly filings of idea generation resources like the Renaissance Technologies hedge fund.

This Week’s Sources and Suggestions

  • ITC Holdings (ITC) — Thanks, Marty Eckerle (Temporary Reinstatement)
  • Value Line Investment Survey

Coverage Initiated/Restored: CalAtlantic (CAA), Fonar Corp (FONR), ITC Holdings (ITC), State National (SNC)

Market Barometers (Continued)

By popular demand, it’s probably time to check in on our of favorite, albeit obscure, market barometers.

US New Highs-New Lows ($USHL)

The long-term trailing average for $USHL actually dipped below zero within the past year — and trepidation was a little more rampant. But as shown here, the storm seems to have passed.

 ushl 20160921

Five Smooth Stones


Invest regularly in high-quality companies when they’re on sale. Prudently diversify. It’s a little like going to battle armed with five carefully selected smooth stones and a steadfast long-term perspective. — Manifest Investing Newsletter (June 2012)

The biblical story of David vs. Goliath is fairly widely known. Many would consider it among their favorite stories as a child. After declining the king’s body plate and armor, shepherd David proceeds to a stream and selects five smooth stones. Why five? Well, first and foremost, that was his divine guidance. But another potential driver is not as well known (and sometimes disputed.) Answer: Goliath had four brothers. Form your own conclusions. We prefer to think of this as extreme planning. And in days when market predators seem to ravage our flocks of stocks with abandon, it’s comforting to think about longer perspectives and five smooth stones with masterful sling shot prowess. Bear markets, even gigantic ones, are brought to their knees with the right perspective.

With Tin Cup sinking below $900,000 after our recent million-dollar moment, we’re reminded — starkly — that “Stock prices fluctuate.” Should we have increased cash equivalents for Tin Cup based on some elusive indicator during the first quarter? No. As a policy measure, Tin Cup is committed to remaining fully invested in equities 100% of the time. This necessarily means that we’ll endure roller coasters.

In the aftermath of a month like May 2012, many investors within this community long for the messages delivered by the late Louis Rukeyser. Lou’s steady and calming Wall Street Week (WSW) messages were a staple several years ago on PBS. Hugh McManus shared a number of YouTube rebroadcasts of these messages. Among our favorites include the October 1987 show where Mr. Rukeyser reminded investors worldwide to stay focused on what really matters — family, friends — and discouraged any thought of kicking the family dog or dining room furniture.

We happen to believe that high-quality excellent companies purchased/accumulated with elevated return forecasts means that the roller coasters will be of the kinder, gentler variety … but some turbulence is unavoidable.

We wrote extensively of the carnage endured by Tin Cup during the Great Recession (2008-2009) and didn’t waiver in our expectations that “everything will ultimately be all right.” We fully acknowledge that this whole scenario can be different depending on your age/time horizon, risk tolerance, attainment of critical mass, etc. But we also think — for some — avoiding the challenge of making asset allocation adjustments is also quite desirable. In fact, we can point to several successful long-term investors who refuse to spell asset allocation or worry about any form of tactical decisions along the way (outside of carefully pursuing growth/size diversification.)

Benjamin Franklin and Albert Einstein are two individuals often attributed with the following worn-out expression:

“The definition of insanity is doing the same thing over and over again while expecting different results.”

In a commentary by O’Reilly’s George Alistair Sanger, he points out:

(1) The saying isn’t true.

(2) It isn’t the definition of insanity, instability or even pimples.

(3) It could actually be harmful advice.

(4) It contradicts the notions of experiment and practice.

(5) It does not make up for being harmful and wrong by being particularly funny.

(6) It is not documented to have originated from either Franklin or Einstein.

Invest Long and Prosper

On these pages a little over a year ago (March 2011) Hugh McManus shared some thoughts on fear, primal instincts and linked his conclusions to Star Trek. That’s right. Hugh urged us to invest like Spock not like Captain Kirk. Fear is powerful and can trigger emotions that cloud our long-term judgment.

Hugh admitted during a recent discussion that he actually hoped for a sluggish stock market — some would say “lost decade”, starting in approximately 2000. Is there method to his madness? Absolutely. But you have to account for his age and position on the spectrum of peak-compensation years, etc. In his view, the last several years have been an opportunity to accumulate stocks like Solomon Select feature Walgreen (WAG) at multi-year low prices.

Our discussion rekindled memories and thoughts of the 1970s and the stocks featured by Better Investing magazine during the teeth of the oil embargo and misery index days. Some of the best-performing stocks were chosen during those dark days — a reality that we’ve not fully capitalized on. Are the present conditions and doldrums an opportunity for history to repeat?

As a case in point, The Limited (LTD) was selected by Better Investing in 1982 just in time for the secular bull market. The story was solid — centered on the steadily increasing number of women in workplace and apparel market drivers. The Limited has been one of the absolute best performing stocks over the last several decades, delivering 17% (+7.3% relative return) from 1982-2012.

Hugh does an excellent job of separating emotion from investing and sticks to excellent companies or special situations with long-term merit. He’ll sometimes dabble with a turnaround or emerging company if he perceives opportunity and effective leadership. His perspective extends from at least five years to decades.

Long-Term Performance Profiling. Mapping the relative return results of a variety of club-based portfolios (dark blue dots) and MANIFEST portfolios (light blue) versus a relatively random sampling of institutional portfolios (red dots) presents a compelling story. From Peter Lynch’s Magellan track record at the top to DALBAR’s recent findings of -5.3% relative returns experienced by “average investors” from 1991-2010, the influences are intriguing. We really do believe that groups of investors who heed the lessons of Nicholson, Babson & Graham have at least one leg up on the crowd.

Portfolio Stewardship

In a recent article for US New & World Report David Armstrong asks: “As an investor, have you taken stock of your personal behavior as it relates to the stewardship of your portfolio? If you haven’t, let me tell you it matters—a lot.”

“It’s well documented that investment success is linked in part to behavior. Some investors continue to make the same mistake over and over again: They buy high in the face of euphoria and sell low in the face of fear.”

“In fact, I suspect such behavior has a lot to do with the horrible returns the average investor has achieved from 1991 to 2010 as reported by a recent DALBAR study. It is a pitiful 2.6 percent annual return.”

At 2.6% over that time frame, the relative return achieved by “average investors” according to the DALBAR study is -5.3%. Chase hot stock tips and buy high, sell low. It’s the only way to get “there.”

Checking Emotion At The Door

We believe that the analysis techniques and portfolio design & management methods of the modern investment club movement offer significant potential. Refer to the accompanying graphic of group averages. Although we should consider the preliminary results to be a work-in-progress, similar to a small percentage of “precincts reporting”, the average results of the club-influenced portfolios are outperforming their institutional counterparts. We should note that — if anything — there’s a positive bias for the rhino funds, because we included the most successful and widely-held in our early sampling efforts.

We know the drill. Invest regularly in high-quality companies when they’re on sale. Prudently diversify. It’s a little like going to battle armed with five carefully selected smooth stones and a steadfast long-term perspective. Sling at will. Invest long and prosper.

Morningstar Conference (2016)

Morningstar Investment Conference (2016)

“I see investing as the responsible act of the broad middle class, yet there’s still so many people we don’t touch today.” — Don Phillips, Morningstar

The annual shareholder meeting of Berkshire Hathaway has been called the Woodstock of capitalism, drawing tens of thousands of investors from all over the world.

I think the Morningstar Investment Conference might be “bigger” than the annual pilgrimage to Omaha.

Really? Yes, really. On a per capita basis, comparing the number of investors in Omaha versus the over 2000 advisors and practitioners in Chicago, the Morningstar Investment Conference, or #MICUS, might be a bigger “show.” Before you scoff, consider the population of registered advisors and representatives vs. how many attend. Morningstar puts on an effective event and while you’re scratching your head over the per capita comparison, don’t forget there’s an admission price for the Chicago program.

Make no mistake. Don Phillips and the Morningstar gang throw one heckuva party. We’re reminded about rampant fallacies with respect to passive vs. active investing, a growing discovery and emphasis on sustainability, the mistaken generalizations about advisors vs. registered reps, the new DOL fiduciary regulations and a litany of topics worthy of consideration and discussion.

  • “Supporting responsible investing is actually more closely related to behavior modification.” — Don Phillips
  • We’ve been fans of the Morningstar MOAT Fund for some time. Microsoft’s acquisition of LinkedIn (LNKD) provides quite a boost to the fund’s value in recent days. The merits of LinkedIn — and investment thesis — were covered by Morningstar’s Elizabeth Collins during an early panel session.
  • Best Ideas: Biogen (BIIB) and Williams-Sonoma (WSM). (Elizabeth Collins)
  • “Global growth over last four years has been slower … but it’s actually closer to long-term norms.” Prevalent themes: persistent strong U.S. dollar, U.S. treasury yields not justified and some scattered opportunities in emerging markets. (Michael Hasenstab, Franklin Templeton)
  • “Investors should not use a shot gun approach with respect to emerging markets. Use a rifle instead.” (Hasenstab)
  • Reminiscent of a couple of previous Morningstar conferences, Bill Bernstein served as this year’s “Grumpy Old Man” but he seems to agree with many of us on many issues. But he’s a delightful curmudgeon.
  • “The case for index and passive investing has been dramatically overstated.” (Phillips)
  • “Alternative funds are not an investment. They are a compensation scheme.” (Bernstein) [Told you …]
  • What hasn’t been overstated? The cleavage between high-cost and low-cost. (Phillips, Bernstein)
  • “I pride myself on not knowing what stocks are in my portfolios. I’m a Quant.” (Cliff Asness, AQR)
  • I respect and enjoy the work of Rob Arnott (Research Affiliates) and Cliff Asness (AQR). But watching them debate like sumo wrestlers trying to give each other a wedgie in a cage match on the head of a pin is not my favorite post-breakfast activity. I’m glad they believe in “Tin Cup”, grant permission for us to “sin a little” with asset allocation and speculation and I now have a greater appreciation for Smart/Strategic Beta and I’m thankful that at it’s core — we have been doing a lot of the factor-based opportunity stuff for a long time. But most of all, I’m grateful for the elegant simplicity of our methods. It’s a powerful reminder about Occam’s Razor.

(Continuing with our regularly scheduled programming and weekly update …)

MANIFEST 40 Updates

  • 9. Cisco Systems (CSCO)
  • 10. Qualcomm (QCOM)
  • 12. Walgreen Boots (WBA)
  • 37. CVS Health (CVS)
  • 40. LKQ Corp (LKQ)

Round Table Stocks: Cisco Systems (CSCO), CVS Health (CVS), Gentex (GNTX), Inteliquent (IQNT), ITC Holdings (ITC), LKQ Corp (LKQ), Neustar (NSR), Qualcomm (QCOM), Synaptics (SYNA)

Results, Remarks & References

Companies of Interest: Value Line (6/17/2016)

The average Value Line low total return forecast for the companies in this week’s update batch is 5.6% vs. 5.5% for the Value Line 1700 ($VLE).

Materially Stronger: Infinera (INFN), Drew Industries (DW)

Materially Weaker: American Movil (AMX), Synaptics (SYNA), Titan (TWI), Dish Network (DISH)

Discontinued: Time Warner Cable (TWC), Cleco (CNL), Fuel Systems Solutions (FSYS)

Coverage Initiated/Restored:

Market Barometers

Value Line Low Total Return (VLLTR) Forecast. The long-term low total return forecast for the 1700 companies featured in the Value Line Investment Survey is 5.6%, unchanged from 5.6% last week. For context, this indicator has ranged from low single digits (when stocks are generally overvalued) to approximately 20% when stocks are in the teeth of bear markets like 2008-2009.

Breaking.

Guggenheim has reinstated the S&P Small- and Mid-Cap equally-weighted funds: EWSC and EWMC

For a complete list of Guggenheim ETFs, see:

http://gi.guggenheiminvestments.com/products

Market Barometers (Continued)

In honor of this week’s Morningstar Investment Conference in Chicago, their weekly determination of stock prices in general vs. the “fair value” for the overall stock market.

Mstar market fair value 20160615

Stocks to Study (6/17/2016)

  • LKQ Corp (LKQ) — Highest MANIFEST Rank
  • Neustar (NSR) — Highest Low Return Forecast (VL)
  • Borg Warner (BWA) — Lowest P/FV (Morningstar)
  • Arris Group (ARRS) —Lowest P/FV (S&P)
  • China Auto Systems (CAAS) — Best 1-Yr Outlook (ACE)
  • Juniper Networks (JNPR) — Best 1-Yr Outlook (S&P)
  • Verifone Systems (PAY) — Best 1-Yr Outlook (GS)

The Long & Short of This Week’s Update Batch

The Long & Short. (June 17, 2016) Projected Annual Return (PAR): Long term return forecast based on fundamental analysis and five year time horizon. Quality Ranking: Percentile ranking of composite that includes financial strength, earnings stability and relative growth & profitability. VL Low Total Return (VLLTR): Low total return forecast based on 3-5 year price targets via Value Line Investment Survey. Morningstar P/FV: Ratio of current price to fundamentally-based fair value via www.morningstar.com S&P P/FV: Current price-to-fair value ratio via Standard & Poor’s. 1-Year ACE Outlook: Total return forecast based on analyst consensus estimates for 1-year target price combined with current yield. The data is ranked (descending order) based on this criterion. 1-Year S&P Outlook: 1-year total return forecast based on S&P 1-year price target. 1-Yr “GS” Outlook: 1-year total return forecast based on most recent price target issued by Goldman Sachs.

Gone RuleBreaker Shopping!


This month’s tracking portfolio, David Gardner’s Stock Advisors Rule Breakers, monitors the progress made over the last 14 years.

It’s a dashboard that the Plungers Investment Club would love. (At least for the non-core and adventure component of their holdings.) This month’s tracking portfolio, David Gardner’s Stock Advisors Rule Breakers, monitors the progress made over the last 14 years. We place $100 into each selection/decision and track the progress of that $100 investment over time.

Paths to Super Investor Returns?

The active positions in the RuleBreaker with the highest return forecasts are featured in the accompanying dashboard excerpt. Rule Breakers focuses primarily on underappreciated growth stocks with solid management and a sustainable business strategy. This time-tested approach works. In fact, the Motley Fool Rule Breakers have consistently been among the leaders of Hulbert Financial’s rankings of 5-year performance. The media has taken notice as well with the Wall Street Journal previously calling Rule Breakers manager David Gardner one of the best stock pickers on Earth.

Our cover story review this month documented a 15.1% absolute return over the trailing 14 years — excess relative return of +7.2% over the Wilshire 5000. These results were achieved with a few roller coaster stocks like Amazon, Apple, Priceline.com, Activision Blizzard and Netflix. All of these stocks will have their speed bump moments.

The consensus forecasts in the dashboards may or may not resemble the expectations built by David and the Rulebreaker team of analysts. Tracking portfolio companies that David would deem worthy of study right now include: Illumina (ILMN), Texas Roadhouse (TXRH), Activision Blizzard (ATVI), McCormick & Co. (MKC), Amazon.com (AMZN), Apple (AAPL), Gilead Sciences (GILD) and Disney (Walt) (DIS).

Restoration Hardware (RH) is down 59.4% since selection back on 3/20/15. Do the fundamentals support a closer look? A strengthening economy could provide some bolstering as home repairs mend. The generic pharmaceuticals have been solid and Mylan Labs (MYL) has been on the radar for years. We featured Boston Beer (SAM) recently in the Fave Five and long-time Rulebreaker favorites like Apple, Gilead Sciences, Priceline.com and Amazon have returned to the sweet spot with return forecasts likely to place them in the buy zone. PayPal (PYPL) was recently featured by Kim Butcher during a Round Table session and Starbucks (SBUX) can be a jolt. There’s much to study here. Break at will.

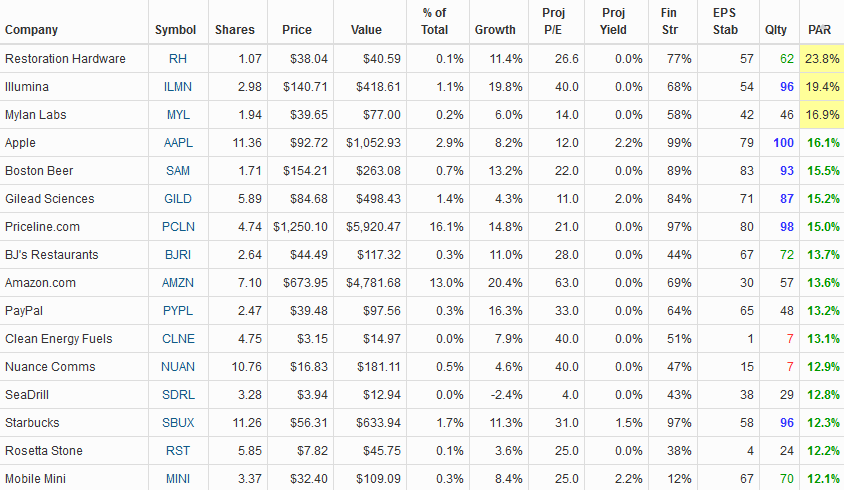
Stock Advisor Rule Breakers. Based on the flagship Motley Fool newsletter, $100 is invested into mentioned companies. The top 16 (by PAR) is shown here. The 14-year annualized rate of return is 15.1%. Source: http://www.fool.com, Stock Advisor


Mark Robertson is founder and managing partner of Manifest Investing, a source for research and portfolio management for long term investors. Fool on!