A Harangue of Hoopla

This column appeared in Better Investing magazine nearly 20 years ago. The only time I now trim my eyebrows is when my wife threatens me.

1998. Paraphrasing a great statesman, “It was a year like all years, filled with events that shape and illuminate our times.” It’s so true. In some ways this one was different, but in many others, the same.

One difference was thanks to the recent space mission, our 12-year-old daughter has now seen Mr. Cronkite, and she now knows who he is. Our 8-year-old observed that he seems to be a “nice, smart man, but he needs to trim his eyebrows.” We gently reminded him to be polite and offered some photos of Albert Einstein. During an afternoon at the Ford Automotive Museum, we discovered that the more “famous” of the Fords was Henry, not the Harrison variety that the kids seem to know better. The kids (and adults) were treated to stories of innovation about the real Mr. Ford and his relationship with Thomas Edison. Alex, in noticing Mr. Edison’s “bad hair day” in a photo, combined with the Einstein photo, and Walter’s eyebrows, decided to muss his hair to see if it stirred his imagination. I’d submit that it already had.

As this issue went to press, we appeared to be headed for another strong annual performance result. 1998 had its moments, including the July-August sell-off which quickly reminded many that these things do happen. Interestingly enough, the September-to-November rebound may have inhibited the message a little. Although far from a market call, we might observe that third and fourth quarter earnings results continue to weaken. If this trend continues, it would be easy to build a case for some tough days ahead.

There are risks associated with investing in stocks. Recent exuberance sometimes makes this message a little hard to deliver. But in 1998, as in every year, one of our core messages is to encourage investors to stay the course, no matter what tomorrow brings. The greater risk, to us, is that of NOT being involved.

The Wall Street Journal caused a bad hair day for the NAIC last week, followed by legions of syndicated translations nationwide in the days that followed. The Chicago Tribune decided that their own interpretation was “Join an Investment Club? No Thanks!”

We might suggest two themes for your consideration. The first is that it’s possible that, once again, the message delivered misses the point. See “Our Editor’s Reaction” below.

The second is that it’s time to extinguish some of the mystery. NAIC investors are extremely successful, so much so that we’ll continually be challenged by those untouched by our community and experience. It’s time for a factual debate and apples vs. apples comparisons. In the months ahead, we’ll look to explore the facts and share them with you.

The annual performance of growth mutual fund managers is commonly cited. We read that 5, 10, 20 and in rare cases, 30 or 40 percent of funds exceed the S&P 500 in a given year. The NAIC has conducted surveys, going back decades, that measure performance, using lifetime statistics and a more stringent comparison, as we assess performance. Placing mutual funds under a multiyear microscope, here’s a chilling statistic. From a sample of 3,637 funds, regardless of type, 18 or 0.5 percent (that’s 1-in-200, folks) outperformed the S&RP 500 over the last five years.

It’s time to explore our fascinating track record and Great Expectations going forward. As for our eight year old, Alex, I doubt that he’ll ever trim his eyebrows.

The NAIC wishes a most jubilant and safe holiday season, to you and your family.

On Recessions (State of Investing)

The thing very few people tell you about “overvalued” markets is that, occasionally, the fundamentals arrive to justify them. — Joshua Brown

If there’s one image that captures the State of the Investing “Union”, this is one of the more important flavors. Recessions massacre profitability and explode Stock Selection Guides (2008-2009). Companies with weak profitability dip below zero and EPS “disappear.”

Value Line Arithmetic Average Companies ($VLE) ex-Financials. This statistic covers the industrials and excludes the asset-based companies where we focus on ROE.

One of the biggest reasons that the 2016-2017 period for the bull market was so “empty” for most investors is because of the recessionary conditions that materialized in some segments, rolling corrections. With the tax law revisions for 2018 and beyond, we’ll be carefully monitoring the additions of 2020 and 2024 estimates to our studies as Value Line ratchets their data arrays one year during upcoming Issue updates.

Crowning Groundhogs (2018)

This Week at MANIFEST (2/8/2019)

“A group of investors heeding the lessons of Graham, Babson and Nicholson has at least one leg up on the crowd and a better than average opportunity to generate exceptional returns.” — Our Groundhog Creed.

Super Performances

The Super Bowl is on Sunday.

Sorry Patriots fans, but if you care about the 2019 stock market, the only thing standing between you and the oblivion of an “old AFL team” winning the Super Bowl and poking the restless bear, the accompanying image of a focused Ram is it. Go Rams!

And that’s the second most important thing going down this weekend.

Our courageous band of Groundhogs have finished another revolution around the sun, the twelfth such rendition — and we’ll be crowning another repeat champion, Anna Gombar of Holly, Michigan.

Inviting Anna Gombar (and her husband Rod) to a stock selection contest is like inviting Tom Brady to a football tournament.

The results are in and the accounting team is crunching numbers, munching pizza and chugging adult beverages in the conference to compile the final results. Spoiler alert: They’re outstanding. Again. (I hope) No, we expect.

Back To The Super Bowl And All Things Commercial

What have been your favorites over the years? The Coca-Cola ad ranks as one of the best of all time. The Apple commercial is epic. And Budweiser consistently hits it out of the park with the gorgeous Clydesdales. But the E*Trade babies and the CareerBuilder Monkeys are legendary.

But — to us (particularly in Michigan) — the Eminem commercial by Chrysler stands out among the best. Ever.

The S&P’s 7.9% Advance Marked Its Best Start To The Year Since 1987

Sharp Rebound. The S&P 500 had it’s best month in three years following December’s slump. Hard to think of the market gyrations over the last four months as anything but a YoYo “Walk-The-Dog” market.

MANIFEST 40 Updates

  • 2. Cognizant Technology (CTSH)
  • 4. Microsoft (MSFT)
  • 12. Alphabet/Google (GOOG)
  • 19. Visa (V)
  • 27. Oracle (ORCL)
  • 28. Wells Fargo (WFC)
  • 36. T. Rowe Price (TROW)

Round Table Stocks

  • Amazon (AMZN)
  • Baidu (BIDU)
  • Booking.com (BKNG)
  • Cognizant Technology (CTSH)
  • eBay (EBAY)
  • EPAM Systems (EPAM)
  • FleetCor (FLT)
  • Global Payments (GPN)
  • Infosys Tech (INFY)
  • Microsoft (MSFT)
  • PayPal (PYPL)
  • SEI Investments (SEIC)
  • T. Rowe Price (TROW)
  • Western Union (WU)

Best Small Companies (2019 Dashboard)

The status of the 2019 Best Small Companies can be tracked at: https://www.manifestinvesting.com/dashboards/public/best-small-2019

Investing Round Table Sessions (Video Archives)

Turnout Tuesday Educational Sessions

Results, Remarks & References

Companies of Interest: Value Line (2/8/2019)

The median Value Line low total return forecast for the companies in this week’s update batch is 5.7% vs. 7.7% for the Value Line 1700 ($VLE).

Materially Stronger: Fiserv (FISV)

Materially Weaker: Sohu.com (SOHU), Ameriprise (AMP), SEI Investments (SEIC), BlackRock (BLK), Ctrip.com (CTRP), GroupOn (GRPN), Capital One (COF), Ansys (ANSS)

Discontinued:

Market Barometers

The thing very few people tell you about “overvalued” markets is that, occasionally, the fundamentals arrive to justify them. — Joshua Brown

Value Line Low Total Return (VLLTR) Forecast. The long-term low total return forecast for the 1700 companies featured in the Value Line Investment Survey is 7.7%, decreasing from 7.7% last week. For context, this indicator has ranged from low single digits (when stocks are generally overvalued) to approximately 20% when stocks are in the teeth of bear markets like 2008-2009.

Groundhog Challenge 2019

Gh invite 20190130

Timeless Perspective From Omaha

A number of Manifest Investing community participants have recently forwarded this message to investment club partners, friends and family.  It’s a timeless reminder from 2008-2009, Warren Buffett … and we doubled down on it recently.

The following was excerpted from Bloomberg (11/21/2008):

Billionaire Warren Buffett’s Berkshire Hathaway Inc. slumped 32 percent last year, the worst performance in more than three decades, as the U.S. recession forced down the value of the firm’s equity holdings and derivative bets.

Most of the stock decline happened in the last three months as Berkshire posted a fourth straight profit drop amid sagging insurance results. The company still beat the 38% tumble of the S500, the 14th year in 20 that Buffett outperformed the benchmark. Just six of 1,591 (0.37%) U.S. stock mutual funds with at least $250 million in assets made money for investors last year, according to data compiled by Bloomberg.

“In 2008, there was nowhere to hide,” said Guy Spier, chief investment officer at Aquamarine Capital Management, which holds shares in the Omaha, Nebraska-based company. “Berkshire can’t escape the general fate of American businesses. What Buffett tries to do is ensure that Berkshire Hathaway does less badly than other companies.”

Buffett built Berkshire over four decades from a failing textile maker into a $150 billion company by buying out-of-favor stocks and businesses whose management he deemed superior.

Buffett Not Concerned

The stock plunge “doesn’t make any difference,” Buffett told Fox Business Network Nov. 21.

“It’s happened to me three other times,” Buffett said. “It happened when it went from 90 to 40 back in 1974, and it happened in 1987. It went down 50 percent in 1998-to-2000. I mean, I hope I live long enough so it happens a couple more times.”

=End of Excerpt=

It’s a perspective that has led to 20% annualized returns over multiple decades. Ignore it only if you’re willing to settle for a dimmer future.

Mark Robertson

Brkvsp5002008

I recently watched a 10-year retrospective on the financial crisis of 2007-2009.

Do you remember Buffett’s reaction to one of the most challenging market moments of his lifetime?

Answer: I hope I live long enough to experience a couple more of these.

Perspective matters.

Here’s what Warren Buffett says to do when the market tanks (CNBC, 10/10/2018)

“Don’t watch the market closely,” he advised those worried about their retirement savings at the time. “If they’re trying to buy and sell stocks, and worry when they go down a little bit … and think they should maybe sell them when they go up, they’re not going to have very good results.”

… he recommends investors “get ice cream with their kids and say hi to a friend they haven’t spoken with in a while.”


And he’d appreciate it if you’d find the nearest Dairy Queen for the occasion.

All Of The Above Investing

This Morning’s Powerful Reminder About All-Of-The-Above Investing. We build and maintain portfolios with a sufficient number of small and medium-sized companies such that the overall growth forecast (weighted average) is approximately 11%. This assures that we’ll have a suitable balance of promising faster-growing smaller companies and large core/blue chip stalwarts.

$100 invested in the S&P 500 on 6/13/1997 would now be worth $314.85. (5.9%)

$100 invested in the Value Line 1700 Arithmetic Average ($VLE) would now be worth $820.50. (11.1%)

The Rest of the Story: Wasted Wish?

Perspectives, by Mark Robertson, Managing Partner


Originally Posted on January 1st, 2010 — we felt it was worth another look back at a visit from Santa … from a few years ago on the heels of a vicious bear market.

With certain apologies to Paul Harvey, we need to continue a look at our “Best Season To Invest?” theme from last month. Our December cover story included an exchange with Santa Claus where we playfully negotiated three wishes. The 3rd wish was for Santa to let us know the best day to invest during any given year.

Santa reluctantly agreed to see what he could do … after exploring our comments about lottery-related spam email. But his message was pretty clear, the perceived advantage isn’t nearly what most people think it would be.

We resumed the discussion where we left off during his visit to Rochester Hills, Michigan on a snowy December 25.


A Wish Already Granted? $100 invested into Tin Cup (our model portfolio) would have led to total assets of $1565 over the last ten years. The same $1000 invested on the best day for investing in each of those ten years stands at $1317. Investing regularly in quality companies with leadership projected returns turns out to be pretty compelling.


MI: So how’d it go in Omaha?

Santa: I’m still undecided. Buffett is on probation until I figure out why he said “Buy American!” and then bought a Chinese stock? But he gets good list points for pointing out long-term investing in general.

MI: Indeed. We think Buffett, and for that matter, all of us, should be willing to invest wherever your sled flies on Christmas Eve.

Santa: I might be mixed up on the years … but in any event, he’s on probation until I finish reading Snowball. If he’s gonna use one of my favorites for the title of the book, he’d better behave. I’m not convinced. For now, it’s a fly-by.

MI: Charlie Munger, too?

Santa: Not a chance. Charlie’s a hoot, one of my favorites. I may leave him a clump of coal just to play mind games with him. He’ll probably wonder if Buffett is out to buy an entire coal company next.

MI: Now who’s misbehaving?

Santa: Watch it. That 2010 list is already a work-in-progress. You’re already hanging in the balance.

MI: OK, I’ll add “being nice” to my list of resolutions for 2010.

Santa: It’s early. You have a shot.

MI: We’ve been doing some more thinking about that wasted third wish from last month. Is it possible that I wished for something less than we already have?

Santa: Ding. Ding. And two more angels get their wings. Your subscribers have already checked in with their own observations that Tin Cup gained 48% during 2009?

MI: Right. We’re thrilled!

Santa: Well … investing $100/year in Tin Cup and not worrying about “best day of the year” achieved $1565 over the last ten years vs. $1317 using the “best day” approach. Celebrate that. Hey! Nice touch on the beverage, chips and salsa … milk and cookies are great, but they get old after a few million stops.

MI: Thanks, Santa. Have a great year!

Round Table (May 2017)

These excerpts are from our monthly webcast series (The Round Table) that usually airs on the last Tuesday at 8:30 PM ET.  The sessions are FREE and include the selection of 3-5 stocks to study with a demonstration of the analysis used to determine the quality and return forecast.  This demonstration has beaten the market over the last seven years, featuring a collective rate of return of 13.2%.  A tracking portfolio is maintained at:
If you would like to be added to the reminder list for future sessions, send a request to be added to the list maintained at nkavula1@comcast.net

The Core/Non-Core discussion was a thought starter for sure. Clarifying my thought, adding ‘Successfully’ to ‘Survived At Least One Recession’ means to me that the company was ‘at least’ earnings profitable during a recession period. An example would be UTHR owned by the investment club I belong to. — Marty Eckerle, Cincinnati

[Here is one of the slides used in the discussion …]

Core mettle


Selling Decisions Based on Relative Return

Nothing about the traditional selling decision, or Challenge, changes. We still sell with the overall portfolio characteristics in mind. It’s a standard procedure to challenge the holdings with the lowest return forecast. This was referred to by George Nicholson as “Rule One” for portfolio management. For this month’s meeting, Coach (COH) was challenged, updated, analyzed and sold to provide some boost to overall portfolio PAR.

Following that, any company selected within the trailing 12 months that lags (falls behind) the Wilshire 5000 and exhibits a relative return of -20% is subjected to some “head scratching.” The following flow/decision chart is an attempt to capture this process.

Rt flow chart 20170530

Selling Decisions (May 2017)

How To Use This Chart. This chart summarizes the decisions made by checking various attributes of stocks that have triggered the -20% relative return threshold over the last year.

The first chart is a dashboard sorted by PAR (Ascending). The stock at the top of the sort, Coach (COH) is therefore — on the HOT SEAT. After further discussion and the update included in this thread (see below), Coach did not survive and was SOLD.

When a stock reaches a relative return of -20% (versus the Wilshire 5000, VTSMX) it qualifies for this raking over the coals. The relative performance is displayed in the Relative Return column. If LKQ (LKQ) can remain under -20%, it will be removed from this listing at future Round Tables.

Core? is a decision as to whether a stock should be subjected to tighter constraints or given “blue chip” treatment with a “longer leash.” Most participants tend to regard Retail/Apparel companies as Non-Core and we’ve found over the years that steady forecasts and steady results are generally the hallmark of companies that we consider to be core.

If a company is deemed to be core, a quick check of the return forecast (PAR) and Quality is in order to detect degradation or erosion of expectations. In this case NVO is definitely “on the fence” and we’re monitoring for signs of further weakness. It was noted that the stock price performance has been stronger over the last few weeks.

The last “life line” (vs. Industry) is a quick check to see if a company is actually faring relatively well versus its industry or peers while lagging the market. This essentially “saved” LKQ last month as we noted that the Auto & Commercial Vehicle Parts Index (BigCharts: WSJUSIXOTA) has lagged the overall stock market.

Coach (COH) was sold from the Round Table tracking portfolio on 5/30/2017.

Coh analysis 20170530

The Audience Poll was a bit of a photo finish for May 2017. We ruled that the audience selected both Dollar General (DG) and LGI Homes (LGIH) and will invest $1000 in each. The live audience in Cincinnati on 5/19/2017 selected CVS Health (CVS).

Rt poll 20170530

Profitability Forecasting

 We collectively owe all Value Line analysts an apology. We’ll use this household products leader — and walking, talking and breathing Up, Straight & Parallel business analysis — to take a closer look at profitability forecasting.

Church & Dwight (CHD)

Church & Dwight Co., Inc. engages in the development, manufacture, and market of household, personal care and specialty products. It sells consumer products under a variety of brands through a broad distribution platform that includes supermarkets, mass merchandisers, wholesale clubs, drugstores, convenience stores, dollar, pet and other specialty stores and websites all of which sell the products to consumers. The firm focuses its marketing efforts on its brands, which includes ARM & HAMMER, TROJAN Condoms, XTRA laundry detergent, OXICLEAN pre-wash laundry additive, NAIR depilatories, FIRST RESPONSE home pregnancy and ovulation test kits, ORAJEL oral analgesics and SPINBRUSH battery-operated toothbrushes. It operates through the following segments: Consumer Domestic, Consumer International and Specialty Products. The Consumer Domestic segment includes the eight power brands and other household and personal care products such as SCRUB FREE, KABOOM and ORANGE GLO cleaning products, ANSWER home pregnancy and ovulation test kits, ARRID antiperspirant, CLOSE-UP and AIM toothpastes. The Consumer International segment primarily sells a variety of personal care products, some of which use the same brands as its domestic product lines in international markets. The Specialty Products segment produces sodium bicarbonate, which it sells together with other specialty inorganic chemicals for a variety of industrial, institutional, medical and food applications in U.S. The company was founded by Dwight John and Austin Church in 1846 and is headquartered in Ewing, NJ. [Source: Wall Street Journal]


I think we might owe the Value Line analysts an apology.

This might be one of those moments when we realize that something we’ve believed, shared and taught just doesn’t work out the way we expected.

I hate when moments like these happen.

The culprit is usually a Value Line company report. You know the ones I’m talking about. The companies that have been running close to a 5.0% net margin for the last few years and the Value Line analyst has a 3-5 year forecast of 7.5% for the projected net margin. We snicker. Some of us guffaw. Almost all of us discount the forecast.

It’s probably time for a deep breath. A few more moments with curved shower rod curtains while we tack the ends of the ham and restore it to Grandma’s oven. (See Cutting Off The Ends for more on this subject)

The Management Report Card: Profitability

The second part of an SSG-based stock analysis includes a look at profitability trends.

Faced with slide rules and abacus beads, George Nicholson resorted to a moving average for “instant trend analysis.” It’s very straightforward. A comparison of current conditions (higher or lower) versus the trailing 5-year average tells us whether recent results are above (good) or below (bad?) the longer term trend. There is nothing wrong with this convention.

But we use the Preferred Procedure — a business model analysis — to build the long term return forecast for the companies we study and analyze. And we’ve generally used the trailing 5-year average net margin as the projected profitability.

(1) This will build in some conservatism, and (2) we lean on the “excuse” that we’re doing the analysis for each and every company the same — so it’s all “relative.” This too is a decent, but flawed, convention. Even if it’s WRONG.

The problem is that we’re striving for better absolute forecasts.

“The moving average forecast is based on the assumption of a constant model.” — University of Texas, Statistics


Does anything about that accompanying chart of long-term aggregate net margin (1940-Present) look CONSTANT???

Church & Dwight (CHD): Profitability Trends. The actual and forecast net margins for CHD are shown in the profitability graphic on the left. The graphic on the right supports a comparison of actuals (red bars, 2009-2016) versus the forecasts (purple bars) based on 5-year trailing averages back at the time the forecasts were formed.

The fact that we have embedded analyst estimates for profitability for this year, next year and 3-5 years out (when available) for our long-term forecasts means that we are less impacted by this condition than what is depicted on the right.

Bottom Line

I think it’s clear that we’d want a forecast for CHD that is essentially between the VL 3-5 year forecast and the exponential regression shown on the left image. It’s probably also clear that for a profitability profile like the one on the left, the trailing average forecast is going to consistently produce a lagging forecast.

Remember the example of margin expansion by Coca-Cola over the years cited by Steve Sanborn. It’s simply a reality that profitability characteristics shape and evolve over the life cycle of all companies.

The moving average forecast method really only works (accurately) for mature stocks with relatively constant profit margins.

The problem is that there aren’t very many companies that fit this description. Our database includes a forecast algorithm that essentially smoothes and weights the more recent years. When we use this method for Church & Dwight, our 5 year net margin forecast aligns very closely with Value Line’s 3-5 year construct. We checked about (50) more companies — and those forecasts that we snickered and guffawed about — all checked out very closely.

We may owe the Value Line analysts an apology.

We will begin infusing this method with updates going forward until the entire database (at Manifest Investing) is converted.

Huge Expectations (An Update)

Value Line 1700 (x-Financials)

We’ll monitor this as we roll along the data array updates over the next several weeks of update batches. But the early returns do show quite a bump in expectations for 2018 and 2021. Here’s an update through 4/28/2017.

Observations

  • This is a work-in-progress. Think of it like “exit polling” with 85% of “precincts” reporting as we’ve logged the forecasts for 2018 and 2021 for issues 1-11 so far.
  • The sales bump for 2018 seems a little less significant, but still material. It will be interesting to see if it persists and if the 2021 expectations remain elevated above the long-term trend.

Just Like Home …

This Expected Returns cover story from April 2009 underscores the things that really matter during bear markets, corrections and recessions.  We were reminded at the time to focus on high-quality opportunities with vigilance for upstart, promising companies ratcheted up.  If you’re curious about our work at Manifest Investing and the resources we provide for long-term investors, and interested in a FREE 90-day test drive, let me know via markr@manifestinvesting.com … for now, may your investing brackets be “nothing but net.”

The stock market madness of early March has given way to a rally that at least delivers welcome respite from the cascading decline we’ve experienced for several months.

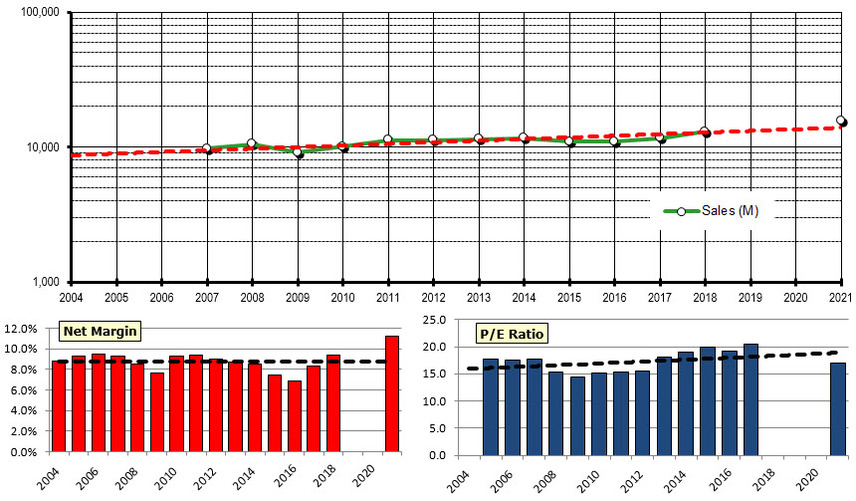
Triple Play: A Measure of Opportunity. History suggests that the discovery of companies poised with Triple Play characteristics can lead to rewards. We’ve leaned on Nicholson’s Triple Play concept often since the 4th quarter of 2008, citing potential impact on our shopping efforts. Finding companies with the prospects of potential profit margin and P/E expansion seems prudent. Combining that potential with high-quality companies exhibiting out-sized PARs could deliver a measure of success and shining moments for our portfolios going forward.


March Madness now extends into April as the NCAA basketball championships bring the current season to a close. And the stock market madness of early March has given way to a rally that at least delivers welcome respite from the cascading decline we’ve experienced for several months. In the movie ‘Hoosiers’, there’s a classic scene where Gene Hackman, coach of the underdogs from a very small town, leads the boys into the championship venue for their pregame practice. He hands a tape measure to the anxious players and urges them to confirm that the hoop is 10 feet above the floor … just like home … and the free throw line, 15 feet … just like home.

From “Just Like Home” …

As many of you know, we’ve discovered that NAIC/BI co-founder, the late George Nicholson, focused his attention on “the next bull market” during the dreadful bear market of 1973-74. As we studied his writings at the time, we learned that he looked back to the lessons of the 1937-38 bear market — days when he was launching a successful career and lifetime of successful investing.

He believed that the challenges and opportunities of 1973-74 were similar to conditions last seen in 1937-38 complete with year-over-year 50% declines in automobile sales (sound familiar?) and a variety of economic ailments related to scarcity of commodities and mischievous behavior in the banking and investing sectors, etc. He developed a set of criteria — intended to seek opportunities just like “home.”

Although we can’t be certain, I can imagine that he saw it as a sort of antidote to the poisonous paralysis that afflicts so many of us as stock prices decline. In fact, Nicholson “pleaded” with investment clubs to commit to decisions during early 1975 — citing a recent 80% gain in Coca-Cola over a span of less than six months as evidence that prices could and often do, move in sudden spurts. (The stock price of Coca-Cola proceeded to languish for the next 5-6 years.) If you missed the autumn 1974 opportunity to own the Real Thing and waited a few months before committing, your experience was considerably less rewarding.

… to “Shining Moments”

CBS Sports features the song ‘One Shining Moment’ to encapsulate the highlight reel celebrating the coronation of this year’s champion.

Nicholson shared that some of the best shining moments of a lifetime of successful investing could be traced to the elements of his Triple Play concept. Here are the three features that qualify a stock for Triple Play status: (1) A depressed stock price. Think elevated projected returns. (2) A potential for P/E expansion over a 5-year time horizon and (3) A potential for profit margin expansion. Such stocks are most frequently found at the end of a long bear market.

“I have been investing in Triple Play situations during 1973-74 in preparation for the next bull market. If past performance is any guide, the performance should exceed [stock market returns] by a wide margin.” — George Nicholson.

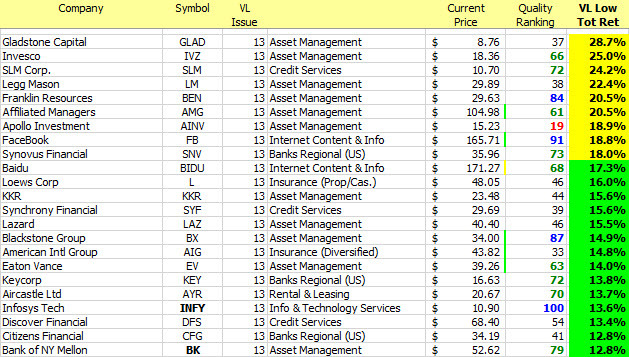
Triple Play Candidates. This listing of study candidates was shared with the attendees at the Better Investing regional conference in Lansing, Michigan on April 3-4, 2009. Our database was screened for companies with PAR>21%; Quality>60; EPS Stability > 60; and Financial Strength > 70. A large number of companies are poised for P/E expansion (not shown) and the screening results shown here are sorted by annualized net profit margin (%) expansion in descending order. Note Solomon Select company, Mettler-Toledo, and the other precision instrument companies.

Bear Down, Regularly

There’s an insurance company commercial running on television where the celebrity sponsor (President Palmer for ‘24’ fans …) shares that we’ve been through twelve recessions over the last 50 years or so. All of them ended and a period of economic expansion ensued.

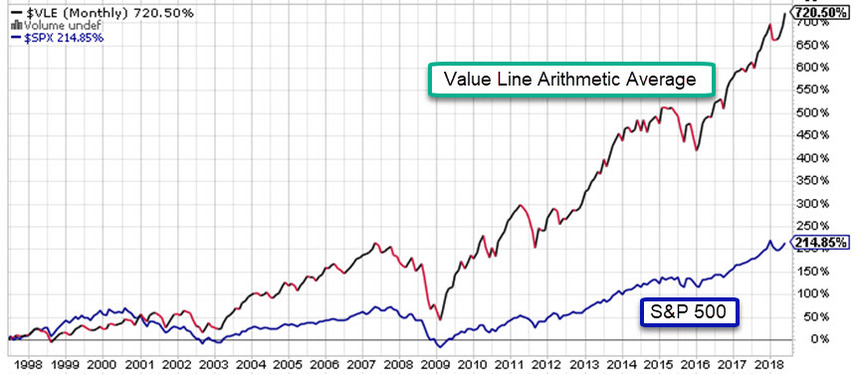
During a recent seminar, Steve Sanborn, retired director of research for Value Line, and I shared that — in his wealth of investing experience — all bear markets have ended. In that seminar, we explored the history of bear markets and underscored the similarities between 1938, 1974 and 2009 as supported by the accompanying graphic.

The lessons of history suggest that it’s probably time to think less about poisonous paralysis — avoid remaining unduly mired in yesterday’s quagmire — and focus a whole lot more on an effort to engage tomorrow’s prosperity. The table displays a listing of companies with depressed stock prices and the potential for profitability and P/E expansion. Many of these companies were mentioned multiple times by some pretty effective stockpickers and educators at the regional conference in Lansing, Michigan on April 3-4.

The list includes some community favorites, a few newcomers and a few Solomon Select legacy features.

Growth by Recession

It’s probably time for a reminder that our emphasis on focus on size diversification includes a healthy nudge. That nudge entails the continuous pursuit of companies with higher top line growth expectations. It also includes an increased focus or emphasis during periods when we may be approaching the end of a recession.

Bear Market Comparisons. As shown here, the bear markets of 1937-38, 1973-74 and 2007-2009 exhibit some similarities when compared versus all of the bear markets that have come and gone before. No, Virginia, we’re not seeing conditions like the Great Depression (see 1929-32) yet. Nicholson seized the moment in 1973-74, seeking Triple Play candidates to ready his portfolio for the next bull market.


You’ll hear some pundits, rhinos and talking heads continuing to encourage blue chip companies and we’ll nod and agree that this pursuit should be continuous, too.

That said, we also heed the advice of Peter Lynch. The Magellan maestro suggested that small companies can be more nimble and recover more quickly coming out of recessions. This reality is one of the things that leads to frustrating periods where blue chip languish while “garbage companies” seem to flourish. An investor over-concentrated in slow-growth blue chips last experienced this during the 2003 bull market.

Dial up shopping efforts and maintain overall portfolio sales growth at the high end of your comfort range. Languish a little less.

I have a small confession. Much like Jim Surowiecki, I’m sometimes conflicted with doubts about how much this “quality stuff” really matters. After writing The Wisdom of Crowds, Surowiecki shares several experiences where he doubted the wisdom of a gaggle of chefs in some “predictive kitchen” only to discover that the collective wisdom held up well … again, despite and in deference to any doubt.

And every time I check, I’m stunned by the reinforcement and rediscovery that comes with it.

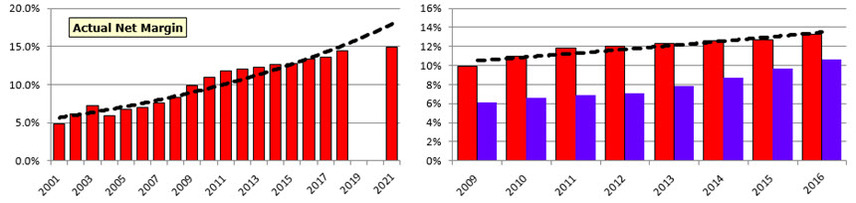
2-Year Annualized Returns for Low-Quality Companies. The companies shown represent approximately (20) of the lowest quality ratings as of March 2007. The average annualized loss for this group of companies is 60%. Yes, 60% … and that doesn’t count three companies no longer “on the board” because they’ve gone bankrupt and no longer exist. In a word, Ouch.

The accompanying graphic is from a couple of slides presented at the regional conference — updating a look at bear market performance for low-quality companies versus high-quality companies. Yes, we’re talking about the current bear market.

And yes, the contrast is stunning. And it hits a little close to home as we watch companies like General Motors (GM) drop from $29.27 to $1.94 over a period of two years — an annualized loss of 74% (per year!)

Nicholson’s Legacy Continues

The companies shown in the accompanying graphic are often found on subscriber dashboards and rank among the most commonly-held and widely-followed by our Community. We’re proud, yet humbled, that companies like Solomon Select feature Strayer Education (STRA) tops these charts, compelling us to continue our quest.

2-Year Ann. Returns for Highest-Quality Companies. In sharp contrast, the highest-quality companies combined for an average return of -19% versus a stock market down -27%. Note that three companies (including a couple of community favorites and a Solomon Select alum) managed positive returns!


Nicholson strongly cautioned avoiding lower quality companies as bull markets raged. In our vernacular and interpretation, we’d translate that to: “periods where MIPAR is historically low” as our measure of bull market condition.

Where’s your “investing tape measure?” In the spirit of Hoosier coach Norman Dale (Gene Hackman), we continue to urge that seeking Triple Play Candidates and heeding the repeating lessons of Quality are pretty good yardsticks to honor.

Just like home … Indeed.