
This Week at MANIFEST (5/20/2016)
“If you are not willing to learn, no one can help you. If you are determined to learn, no one can stop you.”
We gather. The convention serves a unique purpose. Because connecting investors can prove to be the most valuable resource imaginable for individual investors. In that context, the national convention becomes a true investment club — centered on sharing and discovering actionable ideas and pursuing successful investing, together.
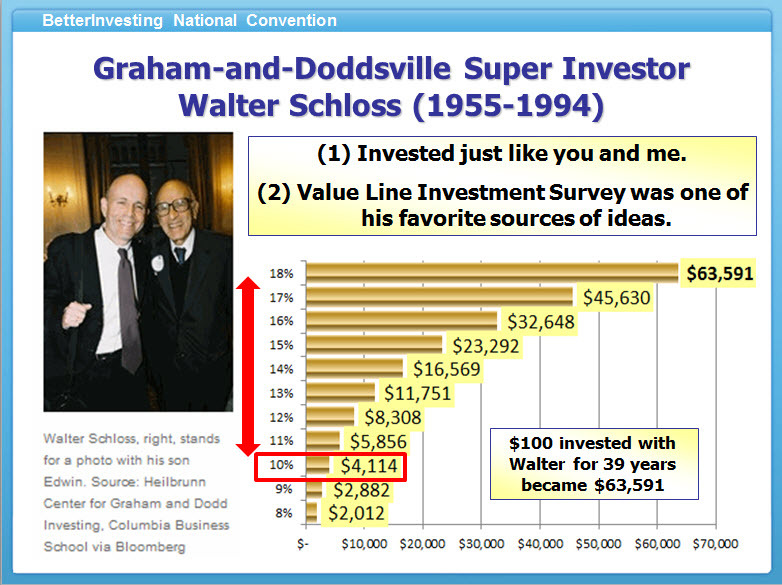
During the current Book Club review of Peter Lynch’s Beating The Street, Hugh McManus mentioned the special session with Peter Lynch at the 1998 NAIC national convention in San Jose. Lynch reviewed many of the key points covered in the book during his speech. This reference inspired me to track down a copy of Smart Money from January 1999 where Emily Harrison Ginsburg provided a story on the heritage of NAIC via Thomas O’Hara. I thought Emily mentioned Peter Lynch in the article, but on further review, I found that she hadn’t. If you’re new to the investment club movement or simply want to go on a nostalgic binge, the Smart Money feature can be found here.
MANIFEST 40 Updates
- 5. Stryker (SYK)
- 6. Johnson & Johnson (JNJ)
Round Table Stocks: Caterpillar (CAT), Deere (DE), Illumina (ILMN), Landauer (LDR), Masimo (MASI), Stryker
Results, Remarks & References
- The Investor’s Speech
- Sage of Madison Heights (Smart Money, 1999)
- As Good As It Gets (Manifest Investing, July 2014)
- Berkshire Buying Apple (WSJ Blog 5/16/2016)
Companies of Interest: Value Line (5/20/2016)
The average Value Line low total return forecast for the companies in this week’s update batch is 4.2% vs. 5.6% for the Value Line 1700 ($VLE).

Materially Stronger: Honda Motors (HMC), Nissan Motor (NSANY.PK), II-VI (IIVI), Edwards Lifesciences (EW), Baxter (BAX), Bruker (BRKR)
Materially Weaker: Manitowoc (MTW), OSI Systems (OSIS), Navistar (NAV), Fiat Chrysler (FCAU), Haemonetics (HAE), Douglas Dynamics (PLOW), Terex (TEX), Actuant (ATU)
Discontinued: Newport (NEWP), Affymetrix (AFFX), Sirona Dental (SIRO)
Coverage Initiated/Restored:
Market Barometers

Value Line Low Total Return (VLLTR) Forecast. The long-term low total return forecast for the 1700 companies featured in the Value Line Investment Survey is 5.6%, up from 5.4% last week. For context, this indicator has ranged from low single digits (when stocks are generally overvalued) to approximately 20% when stocks are in the teeth of bear markets like 2008-2009.

Stocks to Study (5/20/2016)
- Illumina (ILMN) — Highest MANIFEST Rank
- Honda Motor (HMC) — Highest Low Return Forecast (VL)
- Fiat Chrysler (FCAU) — Lowest P/FV (Morningstar)
- Honda Motor (HMC) —Lowest P/FV (S&P)
- Cutera (CUTR) — Best 1-Yr Outlook (ACE)
- General Motors (GM) — Best 1-Yr Outlook (S&P)
- Alere (ALR) — Best 1-Yr Outlook (GS)
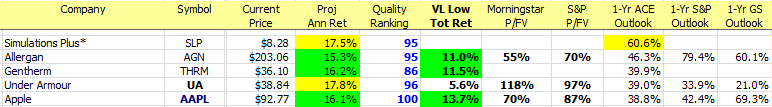
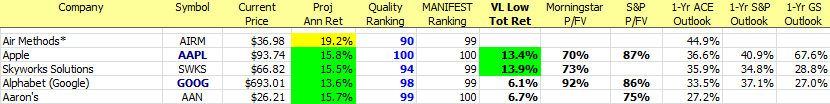
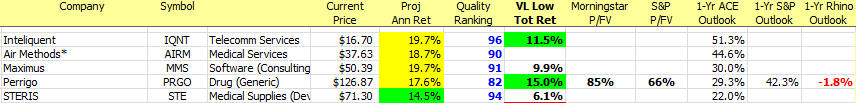
The Long & Short of This Week’s Update Batch

The Long & Short. (May 20, 2016) Projected Annual Return (PAR): Long term return forecast based on fundamental analysis and five year time horizon. Quality Ranking: Percentile ranking of composite that includes financial strength, earnings stability and relative growth & profitability. VL Low Total Return (VLLTR): Low total return forecast based on 3-5 year price targets via Value Line Investment Survey. Morningstar P/FV: Ratio of current price to fundamentally-based fair value via www.morningstar.com S&P P/FV: Current price-to-fair value ratio via Standard & Poor’s. 1-Year ACE Outlook: Total return forecast based on analyst consensus estimates for 1-year target price combined with current yield. The data is ranked (descending order) based on this criterion. 1-Year S&P Outlook: 1-year total return forecast based on S&P 1-year price target. 1-Yr “GS” Outlook: 1-year total return forecast based on most recent price target issued by Goldman Sachs.


May Round Table May 22, 2016 at 11 AM ET ONLINE
Stocks Featured: TBD
The Round Table tracking portfolio has beaten the market by 3-4 percentage points over the last five years. Consider joining Ken Kavula, Cy Lynch and Mark Robertson as they share their current favorite stock study ideas.
The May session will be simulcast from the NAIC Better Investing national convention near Washington D.C.
Round Table Online Registration: https://attendee.gotowebinar.com/register/8401811825391796481
Various attendance options — including single day passes — are available if you’re interested in attending the BI National Convention and the Round Table “live”: 2016 BI National Convention
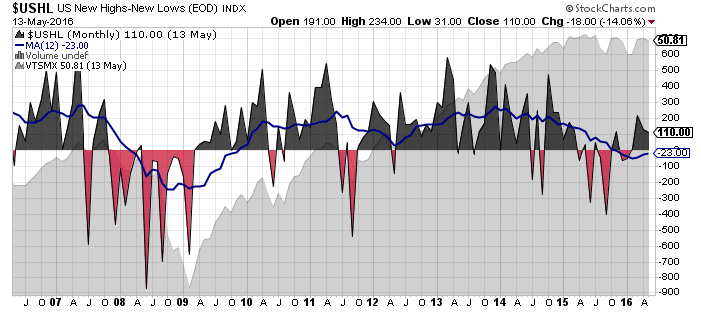
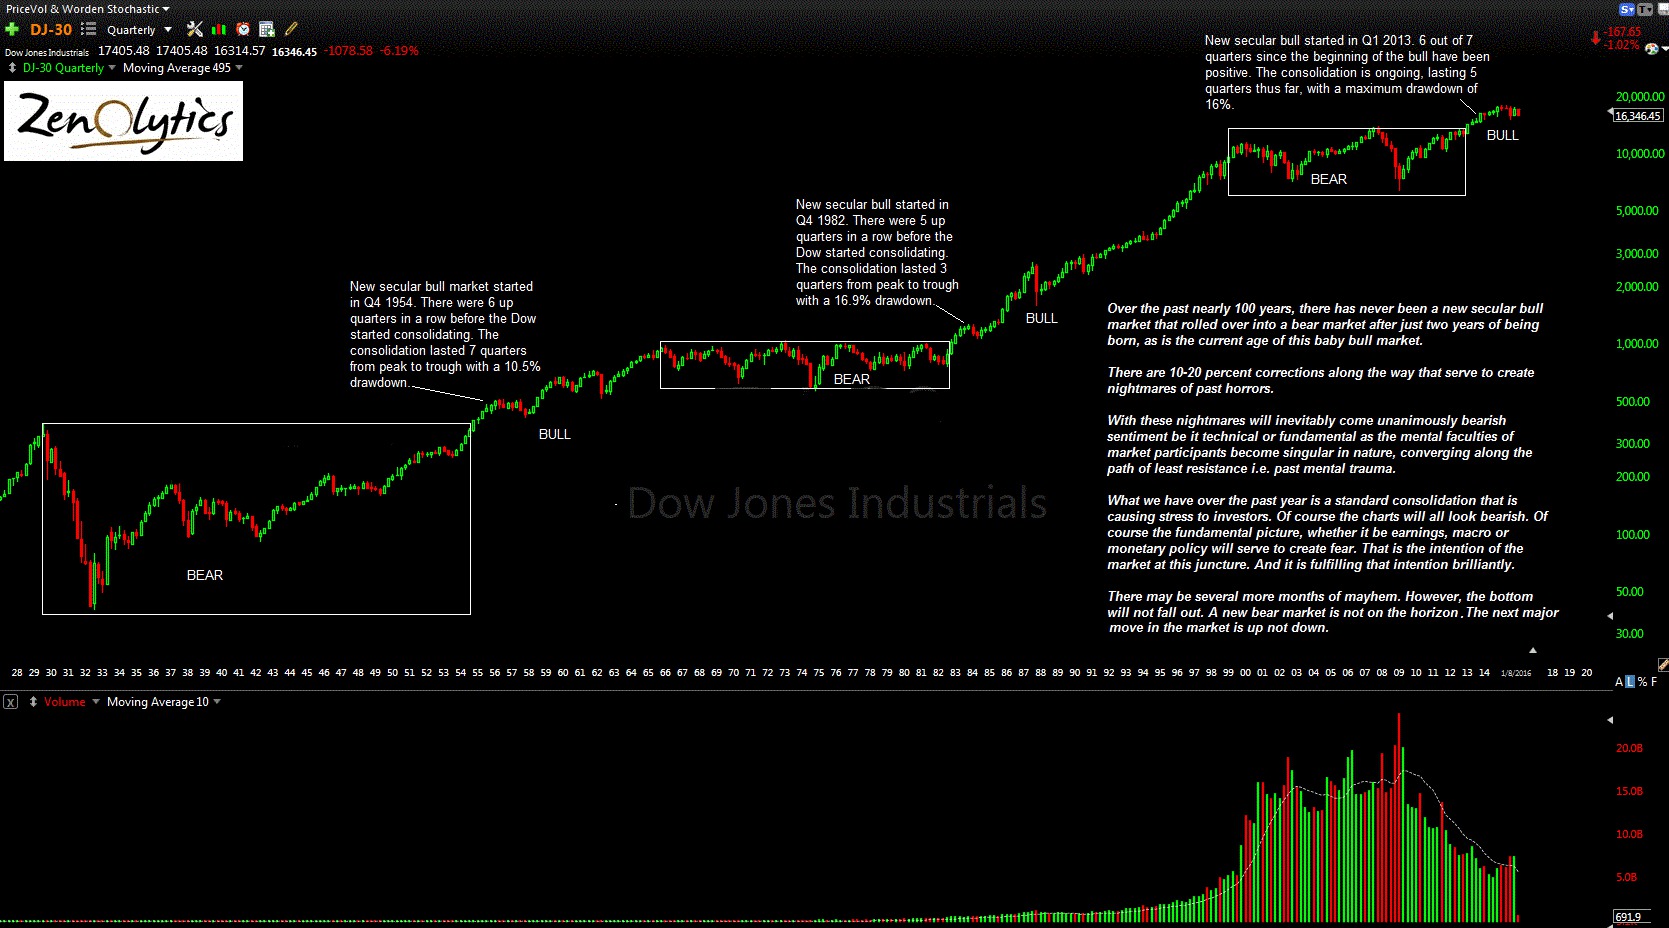
Watching Rhino Walk, Not Rhino Talk. If you believe supply-and-demand matters (and you should) then the collective actions of the herd have bearing. By monitoring the relationship of new highs vs. new lows, we get an early warning clarion that signaled as Halloween 2007 approached. Current $USHL has recovered somewhat from the “test” a few months ago.


