Wild Rides, Cyber Monday!
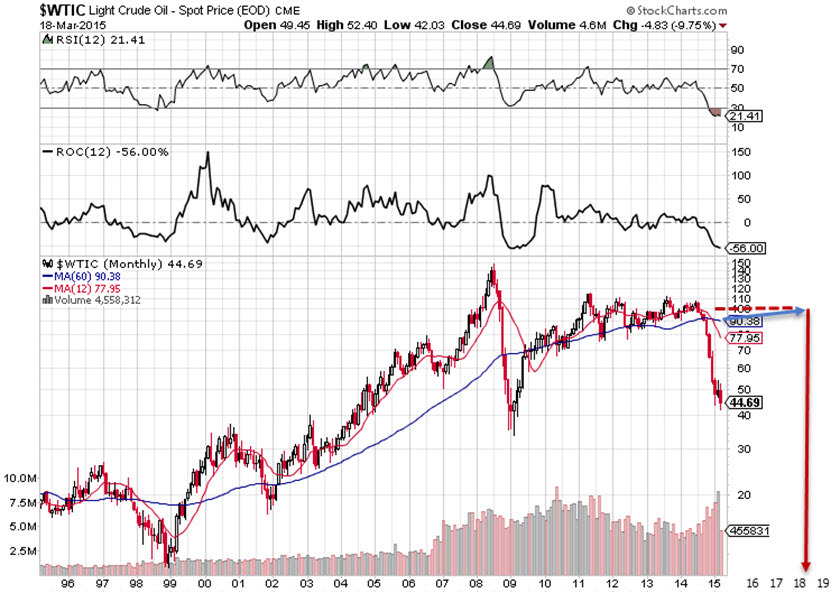
That dull thud we all heard over the Thanksgiving holiday was the energy sector turkey. As shown above, the energy sector took it on the chin to the tune of an 11% swoon as OPEC maintained production levels providing some hefty turbulence. As the following two charts illustrate, few companies in the group were immune from the carnage. Exxon Mobil (XOM) is actually one of the tamer examples from the sessions as these 5-day charts show the disruption.

But it appears that Monday is already bringing some relief … or at least a frozen turkey bounce for some of the higher quality companies in the group …

This week’s update batch (Issue 3 in the Value Line Investment Survey for those keeping score) includes a number of the affected companies. We note several things. First of all, the forecast fundamentals for a number of these companies were already being trimmed by the Value Line analysts. It will be interesting to watch over the next quarter to see if expectations continue to be reduced. We’ve often noted a bifurcation between Morningstar and S&P when it comes to the cyclical stocks — particularly in the energy industry. In this case, Friday’s swoon delivers a price-to-fair value ratio of 91% at Morningstar, essentially screaming something on the order of a Black Friday rush. S&P says “not so fast.” The S&P price-to-fair value ratio is actually greater than 100% (101%) and S&P has been steadily and materially reducing their fair value estimates for the energy stocks over the last few weeks and months. We tend to favor the S&P cyclical expertise in a tiebreaker … so we’d urge caution and an insistence on high-quality during opportunity shopping.
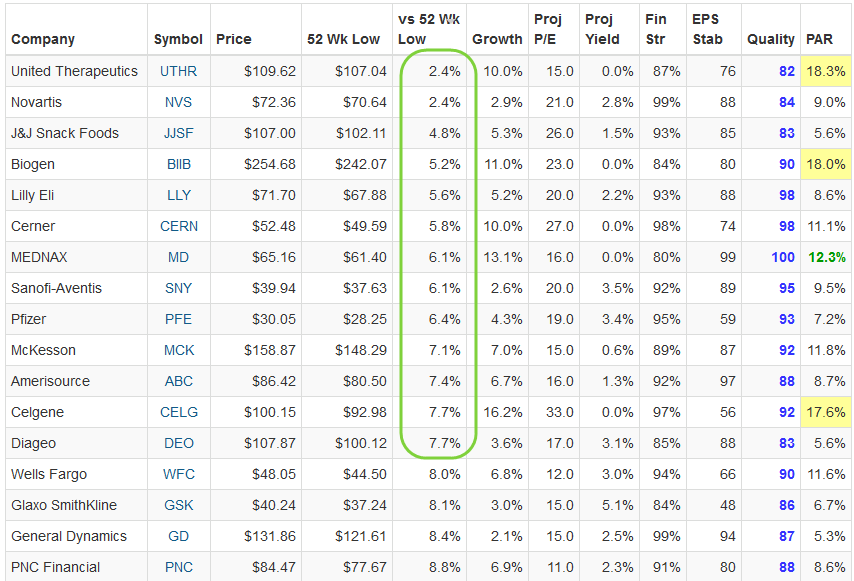
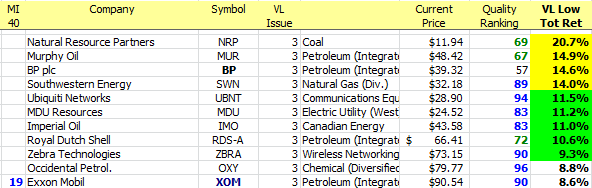
As Hugh has pointed out, BP (BP) was among the tumblers and probably rates fairly well as a long-term opportunity. Exxon Mobil (XOM) is among the study candidates also along with some of the other integrated blue chippers. Keep in mind that Hugh normalizes versus the 52-week low, seeking opportunities when stock prices are near their trailing 52-week lows. Hugh’s spreadsheets compare current prices to their 52-week lows. The accompanying charts for S&P and Morningstar do the same thing — but the comparison is between the current price and the fair value. Less than 100% is potentially attractive, unless it gets “too low.” Stocks in the sweet spot would likely fall into a P/FV ratio of 80-90% representing a discount to fair value of 10-20%.
Coming Events and Attractions
We will catch up on the final November columns and we’ll be out with the December issue of Expected Returns this week.
We’ll continue our expanded coverage of the update stocks this month as part of our quarter long test drive of this feature and the studies and shared ideas it delivers. Please tell us what you think and feel free to join in the Forum discussions for the deeper dives on some of the stocks.
Save the Date: The December Round Table will be held on December 30 at 8:30 PM ET. Register via: https://www2.gotomeeting.com/register/256833802
Companies of Interest: Value Line
The average Value Line low total return forecast for the companies in this week’s update batch is 2.8%.
Materially Stronger: Zebra Technologies (ZBRA)
Materially Weaker: Rhino Resource Partners (RNO), Clean Energy Fuels (CLNE), Gulfmark Offshore (GLF), UGI (UGI), Kronos World (KRO), Marathon Oil (MRO)
Coverage Initiated: Methanex (MEOH), Concho Resources (CXO)
Discontinued: Walter Energy (WLT)

Companies of Interest: Morningstar
The average price-to-fair value (P/FV) ratio at Morningstar for the companies in this week’s update batch is 91%!
It will be interesting to see if the Morningstar analysts make any downward adjustments in fair value for the energy stocks during this turbulent ride.
Southwestern Energy (SWN) checks in at 55% — a stock that Morningstar apparently believes is significantly undervalued.

Companies of Interest: S&P

The average price-to-fair value for the companies in this week’s update batch is 101% — according to S&P.
There are always a couple of things to check during a swoon. One is whether the perceived opportunity is too good to be true. Companies with P/FV ratios less than 70% … or PAR values greater than 16% come to mind. The other is when companies are guilty by association when they don’t deserve it. Is it possible that Imperial Oil (IMO) should be less affected?
Ecolab (ECL) makes the S&P short list at a P/FV of 89% and a quality ranking of 86 — suggesting that it may be worthy of further study.
Market Barometers
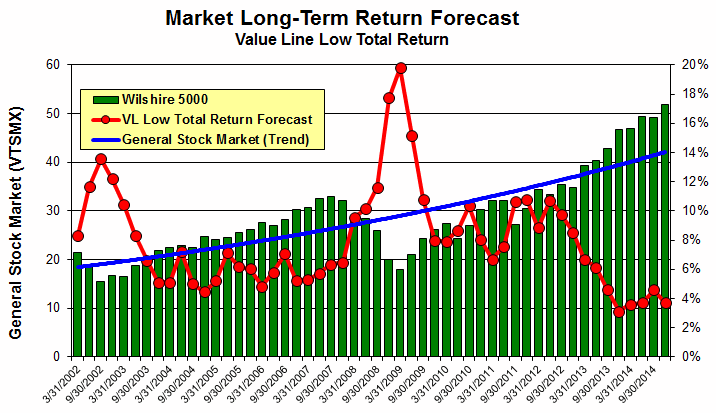
The median Value Line Low Total Return (VLLTR) Forecast is at 3.7% — unchanged from 3.7% last week.
Stocks to Study
The following update stocks are ranked in the top 10th percentile of all companies we follow (MANIFEST Rank > 90) and this display provides a wide berth of dueling opinions, as usual.