This Week at MANIFEST (3/13/2015)
March. “Madness … takes its toll.” — Riff Raff
The name “Hebron” traces back to a range of meanings from “colleague”, “unite” or “friend”. In the proper name Hebron, the original sense may have been alliance. Invest With Your Friends.
From 1908-1971, the Illinois boys high school basketball championship was a single tournament contested by nearly all high schools in Illinois. The Illinois High School Basketball Championship was the first tournament to be called ‘March Madness’. The term was first used about the Illinois tournament in 1939, decades before it was used about NCAA basketball tournament.
The movie Hoosiers was preceded by these real events from across the state line in Illinois. In 1952, the Hebron Green Giants (from a high school with a total enrollment of 98) defeated Quincy in a real David and Goliath story.
But that doesn’t stop us from fondly remembering the scene where Gene Hackman and his high school boys arrive at Butler Field House for the state championship game. Hackman has players measure the distance from the basket to the free throw line and the height of the basket, demonstrating to the players that everything is “the same as our gym back in Hickory.”
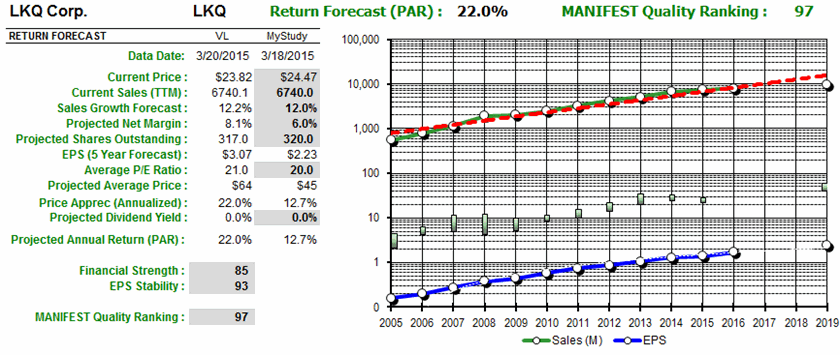
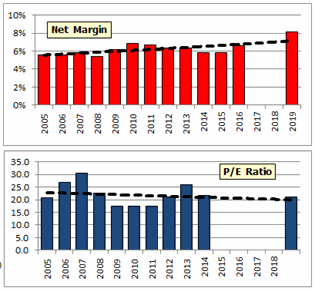
Our methodology is based on measuring and monitoring the sales growth forecast, profitability expectations and projections for a reasonable, considered average P/E ratio in the future for all companies that we analyze. This is how we do.
Equally important is to make sure that we’re prudent. This requires diversification across sectors and industries like everybody else out there building portfolios in the investing world. But we emphasize — on a higher level — the urgency of diversifying such that our blend of companies will produce an average sales growth forecast (plus or minus a percent or two) of 11-12%. So in our investing world, the “Hebrons” are as important as the Quincy entries.
And in the spirit of Gene Hackman’s Coach Norman Dale, measuring what matters is what really matters.
Our Periodic Reminder About “All-Of-The-Above” Investing
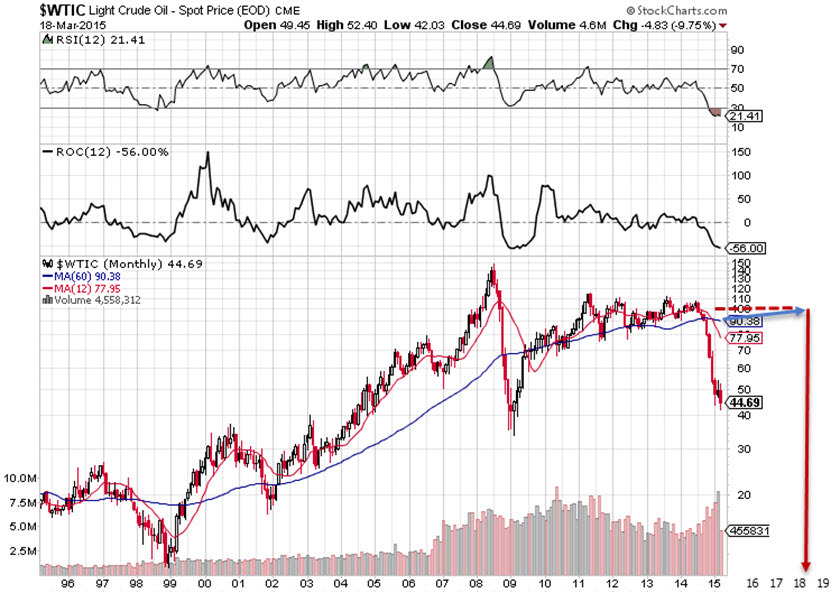
While the rest of the world hyperventilates over NASDAQ 5000, we’ll be watching for a different 5000 — that being the 5000 level for the Value Line Arithmetic Average. We think the overall performance of the Value Line 1700 stocks over time is a powerful reminder of the common sense wisdom to achieve and maintain diversification by average overall portfolio growth rate (company size).

The 10-year rate of return on the Value Line 1700 (Arithmetic Average) is (4806.57/1771.3) = 10.5%
The 10- year rate of return on the S&P 500 (VFINX) is (191.73/91.60)^(0.1)-1 = 7.7%
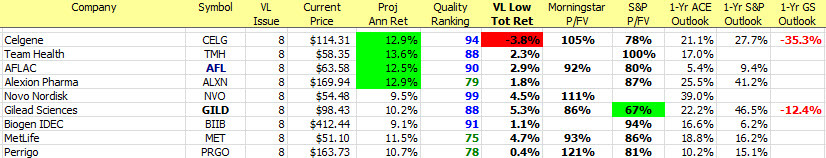
Companies of Interest: Value Line
The average Value Line low total return forecast for the companies in this week’s update batch is 4.0% — slightly higher than the 3.6% for the Value Line 1700.
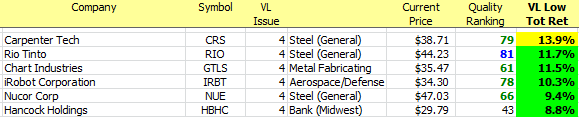
Materially Stronger: Seattle Genetics (SGEN), TCF Financial (TCB), U.S. Steel (X), Fifth Third Bancorp (FITB), ACE (ACE), Private Bancorp (PVTB), Biomarin Pharma (BMRN), Cerner (CERN)
Materially Weaker: Arcelor Mittal (MT), Schnitzer Steel (SCHN), Kennametal (KMT), Brookdale Senior (BKD)
Standard Coverage Initiated:
Discontinued: Alliant Techsystems (ATK), Orbital Sciences (ORB)
Market Barometer

Value Line Low Total Return (VLLTR) Forecast. The long-term low total return forecast for the 1700 companies featured in the Value Line Investment Survey is 3.6%, up slightly from 3.5% last week. For context, this indicator has ranged from low single digits (when stocks are generally overvalued) to approximately 20% when stocks are in the teeth of bear markets like 2008-2009.