
Celgene (CELG)
Celgene seeks to deliver truly innovative and life-changing drugs for patients. This major pharmaceutical company focuses on the discovery, development and commercialization of products for the treatment of cancer and other severe immune inflammatory conditions.
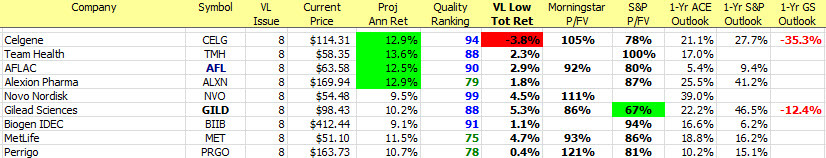
This one is worth a closer look. Celgene (CELG) ranks at the top of the list for this week’s update batch based on the combination of return forecast (PAR) and quality rating.
But the long-term low total return forecast via Value Line is -5%! What gives?
This provides an opportunity for a closer look at the consensus aspect of what we do.
Thanks for the question. I was really hoping that someone would ask.
With any forecast, it really does come down to the three judgment milestones and your question can basically be framed by seeking differences between Value Line, your own personal study and perhaps the analyst consensus.
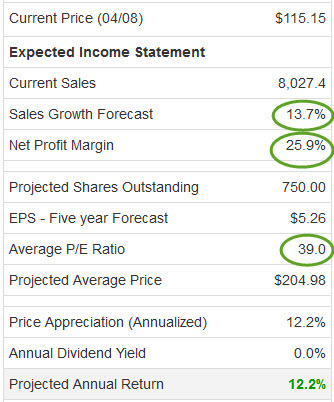
The three most influential factors are:
- Sales Growth Forecast (%)
- Expected Net Margin (%)
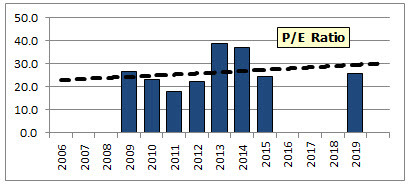
- Projected Average P/E Ratio
The first place you can turn for these comparisons after the batch update is the Company Report page (excerpt/snapshot shown here).
Remember, these are the consensus estimates based on a number of sources.
The influences include: Value Line, Standard & Poor’s, Morningstar, the Analyst Consensus Estimates and to some degree, Goldman Sachs (although this is a work in progress, more on that in a minute).
The next step is to check them versus the Value Line assumptions to see if we can determine where the differences/variances are — because there’s a world of difference between a -5% forecast and a double-digit forecast.

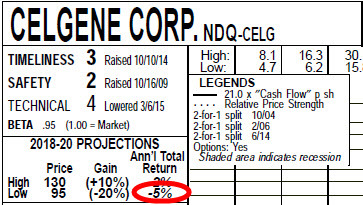
The date on the Value Line company report and our batch update will say April 10, 2015. But the Value Line analysis was performed on 3/30/2015 — something we can determine by finding the date that corresponds with $120.02 here Keep in mind that the Value Line-based low total return forecast is adjusted for (1) change in price and (2) change in time horizon when published at MANIFEST.
Sales Growth Forecast: Although Value Line displays 13.5% in the Annual Rates box … the growth rate for the 3-5 year time horizon is (13000/9000)^(1/4)-1 = 9.6%. (Keep in mind that the Annual Rates box data can be greatly distorted by mergers, acquisitions and/or divestitures.) The growth rate displayed in the Business Model (visual analysis) is 13.7%. I think most of us would be comfortable with expectations of 10-12% for Celgene.
Profitability: These are identical. Nothing to see here.
Projected Average P/E Ratio: Here’s where the disparate opinions kick in. Value Line is using 26×. Morningstar sees the stock as currently relatively fairly valued at a P/E of 39.5x or 47.9x … and Standard & Poor’s actually sees CELG with a price-to-fair value of 78%.
This is the crux. And it’s probably the basis for Celgene (CELG) being massacred and being the stock with the worst (avoid like the plague) rating over at Goldman Sachs. Goldman probably has a lower projected P/E ratio than Value Line for their long-term forecast. It’s clear by their 1-year outlook that they think P/E decay could even come “home to roost” during the next year.
I realize that most of us are loathe to go above 30x … perhaps 35x … for a long-term P/E expectation — and this is good policy. For my own study, I’d avoid using 39x — but, for now, that does represent the consensus. Who’s right? Time will tell, but this company is successfully navigating and delivering in a challenging but promising and desperately needed environment.
