LKQ (LKQ) provides replacement systems, components and parts needed to repair cars and light trucks, primarily in North America and Europe.
Think fender bender. That’s LKQ’s cue to spring into action.
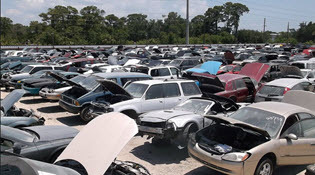
LKQ buys wrecked cars at auction and distributes the reusable parts to collision repair shops. It also provides aftermarket parts services. Customers include repair facilities and insurance companies.
The industry is hugely fragmented. LKQ deploys an aggressive acquisition strategy.
Equity Analysis (Business Model)
It’s easy to see why this company captures the attention of many investors in our community. The up, straight and parallel images suggest a great deal of consistency in an industry that is fairly challenging and very competitive.
The Value Line low total return forecast is 14%.
Focusing on recent history and expectations for our 5-year time horizon, a sales growth forecast of 12% seems feasible. This could be vulnerable to an industry shift from repair to replace. We’ll probably take a closer look at the Retail Automotive industry — and its massive recent performance — and check that against some longer term history from trade/industry data to condition and build growth and profitability forecasts.
The projected net margin is more likely at 6% but Value Line is using 8.1% for their 3-5 year forecast. Shareholders hope that the Value Line analyst (Iason Dalavagas) is right.
A projected average P/E ratio of approximately 20x seems to be in order for this consistent performer that is still a medium-sized workhorse slogging away quite well in an extremely fragmented industry. But they’re becoming the 800-lb gorilla or at least they’re on the way to the jungle.
The Morningstar price-to-fair value (P/FV) ratio is 98% making them a little less optimistic. The S&P P/FV is 78%. The analyst consensus estimate (ACE) for 52-week total return is 33.9%. It’d be interesting to see how that would be impacted by any shift in industry repair/replace trends.
LKQ has a 40% debt-to-capital ratio and the effective interest rate is 6.39% (lowest quartile) so it’s not a leisurely walk through the junkyard. There are some junkyard dogs lurking that bite. Morningstar reduced the financial health to “B” and this will lower our financial strength composite to 72%. The overall quality ranking will still be 95 (Excellent).
Our projected annual return (PAR) is 15% based on 12.2% growth, 6.3% net margins and a projected P/E of 20×.

Mark, didn’t you just write quite extensively about some of Value Line’s metrics? I’d like to learn about VL in more detail since I use it so much. Suggestions?
Thanks!
We often write about Value Line — most recently sharing thoughts on the role of quality from the perspective of some quality companies earmarked by Arnold Bernhard back in 1958. What did you have in mind?
If you are ever able to apply your magic to Australian companies I will subscribe in a heartbeat.
Our recent experience with Canada suggests we may be able to do something. Do you have a favorite Aussie company we could use for a test drive?