Profitability Forecasting

 We collectively owe all Value Line analysts an apology. We’ll use this household products leader — and walking, talking and breathing Up, Straight & Parallel business analysis — to take a closer look at profitability forecasting.

Church & Dwight (CHD)

Church & Dwight Co., Inc. engages in the development, manufacture, and market of household, personal care and specialty products. It sells consumer products under a variety of brands through a broad distribution platform that includes supermarkets, mass merchandisers, wholesale clubs, drugstores, convenience stores, dollar, pet and other specialty stores and websites all of which sell the products to consumers. The firm focuses its marketing efforts on its brands, which includes ARM & HAMMER, TROJAN Condoms, XTRA laundry detergent, OXICLEAN pre-wash laundry additive, NAIR depilatories, FIRST RESPONSE home pregnancy and ovulation test kits, ORAJEL oral analgesics and SPINBRUSH battery-operated toothbrushes. It operates through the following segments: Consumer Domestic, Consumer International and Specialty Products. The Consumer Domestic segment includes the eight power brands and other household and personal care products such as SCRUB FREE, KABOOM and ORANGE GLO cleaning products, ANSWER home pregnancy and ovulation test kits, ARRID antiperspirant, CLOSE-UP and AIM toothpastes. The Consumer International segment primarily sells a variety of personal care products, some of which use the same brands as its domestic product lines in international markets. The Specialty Products segment produces sodium bicarbonate, which it sells together with other specialty inorganic chemicals for a variety of industrial, institutional, medical and food applications in U.S. The company was founded by Dwight John and Austin Church in 1846 and is headquartered in Ewing, NJ. [Source: Wall Street Journal]


I think we might owe the Value Line analysts an apology.

This might be one of those moments when we realize that something we’ve believed, shared and taught just doesn’t work out the way we expected.

I hate when moments like these happen.

The culprit is usually a Value Line company report. You know the ones I’m talking about. The companies that have been running close to a 5.0% net margin for the last few years and the Value Line analyst has a 3-5 year forecast of 7.5% for the projected net margin. We snicker. Some of us guffaw. Almost all of us discount the forecast.

It’s probably time for a deep breath. A few more moments with curved shower rod curtains while we tack the ends of the ham and restore it to Grandma’s oven. (See Cutting Off The Ends for more on this subject)

The Management Report Card: Profitability

The second part of an SSG-based stock analysis includes a look at profitability trends.

Faced with slide rules and abacus beads, George Nicholson resorted to a moving average for “instant trend analysis.” It’s very straightforward. A comparison of current conditions (higher or lower) versus the trailing 5-year average tells us whether recent results are above (good) or below (bad?) the longer term trend. There is nothing wrong with this convention.

But we use the Preferred Procedure — a business model analysis — to build the long term return forecast for the companies we study and analyze. And we’ve generally used the trailing 5-year average net margin as the projected profitability.

(1) This will build in some conservatism, and (2) we lean on the “excuse” that we’re doing the analysis for each and every company the same — so it’s all “relative.” This too is a decent, but flawed, convention. Even if it’s WRONG.

The problem is that we’re striving for better absolute forecasts.

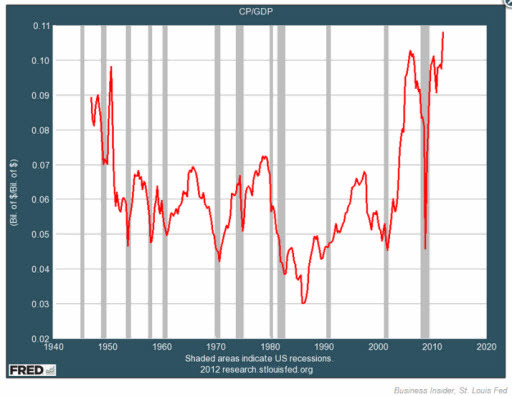
“The moving average forecast is based on the assumption of a constant model.” — University of Texas, Statistics


Does anything about that accompanying chart of long-term aggregate net margin (1940-Present) look CONSTANT???

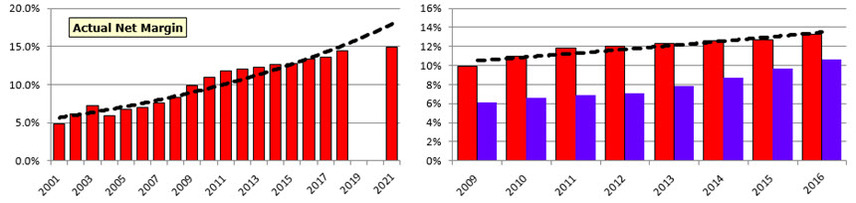
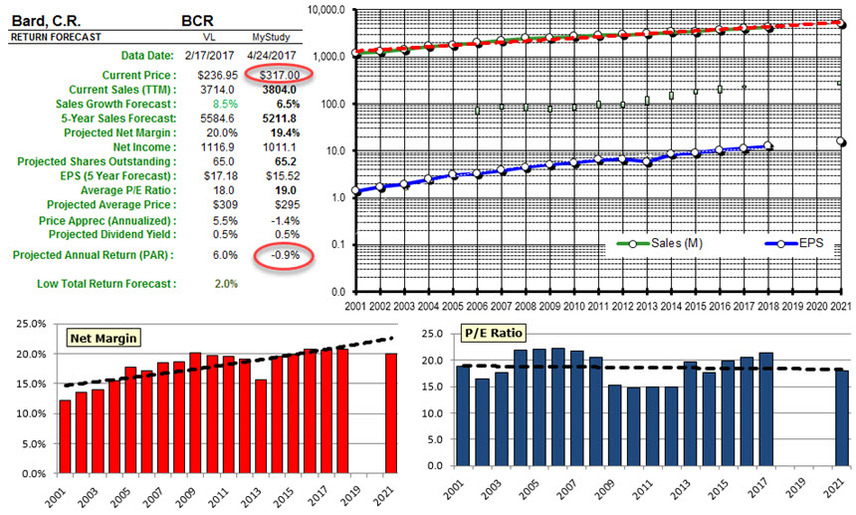
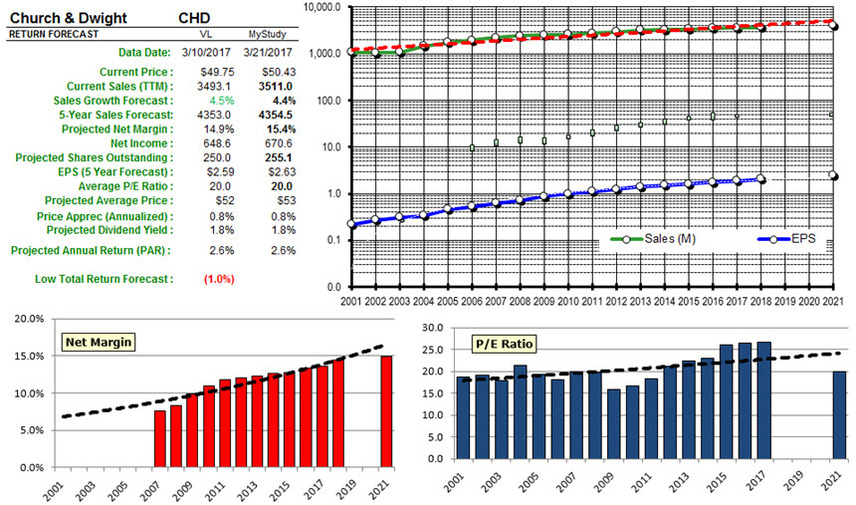
Church & Dwight (CHD): Profitability Trends. The actual and forecast net margins for CHD are shown in the profitability graphic on the left. The graphic on the right supports a comparison of actuals (red bars, 2009-2016) versus the forecasts (purple bars) based on 5-year trailing averages back at the time the forecasts were formed.

The fact that we have embedded analyst estimates for profitability for this year, next year and 3-5 years out (when available) for our long-term forecasts means that we are less impacted by this condition than what is depicted on the right.

Bottom Line

I think it’s clear that we’d want a forecast for CHD that is essentially between the VL 3-5 year forecast and the exponential regression shown on the left image. It’s probably also clear that for a profitability profile like the one on the left, the trailing average forecast is going to consistently produce a lagging forecast.

Remember the example of margin expansion by Coca-Cola over the years cited by Steve Sanborn. It’s simply a reality that profitability characteristics shape and evolve over the life cycle of all companies.

The moving average forecast method really only works (accurately) for mature stocks with relatively constant profit margins.

The problem is that there aren’t very many companies that fit this description. Our database includes a forecast algorithm that essentially smoothes and weights the more recent years. When we use this method for Church & Dwight, our 5 year net margin forecast aligns very closely with Value Line’s 3-5 year construct. We checked about (50) more companies — and those forecasts that we snickered and guffawed about — all checked out very closely.

We may owe the Value Line analysts an apology.

We will begin infusing this method with updates going forward until the entire database (at Manifest Investing) is converted.

Fave Five (5/12/2017)

Fave Five (5/12/2017)

Our Fave Five essentially represents a listing of stocks with favorable short term total return forecasts (1 year, according to Analyst Consensus Estimates, or ACE) combined with strong long-term return forecasts and good/excellent quality rankings. The average 1-year ACE total return forecast is 9.1%.

This week we return to the triple play screening method for our five favorites. The triple play possibility occurs when you find a stock that is very depressed in price and also appears to be on the verge of substantially boosting its profit margins. The triple play effect is possible in that:

(1) The depressed price of the stock can return to normal levels;

(2) increased profit margins can produce increased EPS and a higher price;

(3) may also cause higher P/E ratios, or P/E expansion.

The Fave Five This Week

  • Air Lease (AL)
  • Akamai Technologies (AKAM)
  • FleetCor (FLT)
  • Skechers (SKX)
  • Tractor Supply (TSCO)

The Long and Short of This Week’s Fave Five

The Long & Short. (May 12, 2017) Projected Annual Return (PAR): Long term return forecast based on fundamental analysis and five year time horizon. Quality Ranking: Percentile ranking of composite that includes financial strength, earnings stability and relative growth & profitability. VL Low Total Return (VLLTR): Low total return forecast based on 3-5 year price targets via Value Line Investment Survey. Morningstar P/FV: Ratio of current price to fundamentally-based fair value via www.morningstar.com S&P P/FV: Current price-to-fair value ratio via Standard & Poor’s. 1-Year ACE Outlook: Total return forecast based on analyst consensus estimates for 1-year target price combined with current yield. The data is ranked (descending order) based on this criterion. 1-Year S&P Outlook: 1-year total return forecast based on S&P 1-year price target. 1-Yr GS: 1-year total return forecast based on most recent price target issued by Goldman Sachs.

Fave Five Legacy (Tracking Portfolio)

The relative/excess return for the Fave Five tracking portfolio is +2.0% since inception. 46.9% of selections have outperformed the Wilshire 5000 since original selection.

Tracking Dashboard: https://www.manifestinvesting.com/dashboards/public/fave-five

Fave Five (4/28/2017)

Fave Five (4/28/2017)

Our Fave Five essentially represents a listing of stocks with favorable short term total return forecasts (1 year, according to Analyst Consensus Estimates, or ACE) combined with strong long-term return forecasts and good/excellent quality rankings. The average 1-year ACE total return forecast is 8.6%.

The Fave Five This Week

  • Air Lease (AL)
  • Fleet Cor (FLT)
  • Monster Beverages (MNST)
  • Royal Dutch Shell (RDS.A)
  • Tractor Supply (TSCO)

The Long and Short of This Week’s Fave Five

The Long & Short. (April 28, 2017) Projected Annual Return (PAR): Long term return forecast based on fundamental analysis and five year time horizon. Quality Ranking: Percentile ranking of composite that includes financial strength, earnings stability and relative growth & profitability. VL Low Total Return (VLLTR): Low total return forecast based on 3-5 year price targets via Value Line Investment Survey. Morningstar P/FV: Ratio of current price to fundamentally-based fair value via www.morningstar.com S&P P/FV: Current price-to-fair value ratio via Standard & Poor’s. 1-Year ACE Outlook: Total return forecast based on analyst consensus estimates for 1-year target price combined with current yield. The data is ranked (descending order) based on this criterion. 1-Year S&P Outlook: 1-year total return forecast based on S&P 1-year price target. 1-Yr GS: 1-year total return forecast based on most recent price target issued by Goldman Sachs.

Fave Five Legacy (Tracking Portfolio)

The relative/excess return for the Fave Five tracking portfolio is +2.3% since inception. (The absolute rate of return is 17.1%.) 47.7% of selections have outperformed the Wilshire 5000 since original selection.

Tracking Dashboard: https://www.manifestinvesting.com/dashboards/public/fave-five

Bard, C.R. (BCR) Acquired

Becton Dickinson (BDX) to Acquire Bard (BCR) for $317 (cash & stock) …

No, NOT that Bard!

Becton Dickinson (BDX), a leading global medical technology company, and C. R. Bard (BCR), a medical technology leader in the fields of vascular, urology, oncology and surgical specialty products, announced today a definitive agreement under which BD will acquire Bard for $317.00 per Bard common share in cash and stock, for a total consideration of $24 billion. The agreement has been unanimously approved by the Boards of Directors of both companies.

The combination will create a highly differentiated medical technology company uniquely positioned to improve both the process of care and the treatment of disease for patients and healthcare providers. The transaction will build on BD’s leadership position in medication management and infection prevention with an expanded offering of solutions across the care continuum. Additionally, Bard’s strong product portfolio and innovation pipeline will increase BD’s opportunities in fast-growing clinical areas, and the combination will enhance growth opportunities for the combined company in non-U.S. markets.

http://finance.yahoo.com/news/bd-acquire-bard-24-billion-210400916.html

  • Textbook “Up, Straight and Parallel”
  • Easy to make a case for 6-8% growth, a projected net margin of 20% and a P/E in the high teens. Remarkably consistent.
  • Is $317 (cash + stock) a good price for the faithful shareholders in our community? Most companies are acquired at a premium — the acquirer will generally pay a price that delivers a ZERO or SUBZERO projected annual return (PAR) according to an updated analysis. (Unless you’re Warren Buffett) In this case, the $317 is a “sell” according to our analysis.

Bcr analysis 20170424

Fave Five: Triple Play (4/14/2017)

Fave Five (4/14/2017)

Our Fave Five essentially represents a listing of stocks with favorable short term total return forecasts (1 year, according to Analyst Consensus Estimates, or ACE) combined with strong long-term return forecasts and good/excellent quality rankings. The average 1-year ACE total return forecast is 8.8%.

This week we return to the triple play screening method for our five favorites. The triple play possibility occurs when you find a stock that is very depressed in price and also appears to be on the verge of substantially boosting its profit margins. The triple play effect is possible in that:

(1) The depressed price of the stock can return to normal levels;

(2) increased profit margins can produce increased EPS and a higher price;

(3) may also cause higher P/E ratios, or P/E expansion.

The Fave Five This Week

  • Air Lease (AL)
  • FleetCor (FLT)
  • LKQ (LKQ)
  • Synaptics (SYNA)
  • Synchronoss Tech (SNCR)

The Long and Short of This Week’s Fave Five

The Long & Short. (April 14, 2017) Projected Annual Return (PAR): Long term return forecast based on fundamental analysis and five year time horizon. Quality Ranking: Percentile ranking of composite that includes financial strength, earnings stability and relative growth & profitability. VL Low Total Return (VLLTR): Low total return forecast based on 3-5 year price targets via Value Line Investment Survey. Morningstar P/FV: Ratio of current price to fundamentally-based fair value via www.morningstar.com S&P P/FV: Current price-to-fair value ratio via Standard & Poor’s. 1-Year ACE Outlook: Total return forecast based on analyst consensus estimates for 1-year target price combined with current yield. The data is ranked (descending order) based on this criterion. 1-Year S&P Outlook: 1-year total return forecast based on S&P 1-year price target. 1-Yr GS: 1-year total return forecast based on most recent price target issued by Goldman Sachs.

Fave Five Legacy (Tracking Portfolio)

The relative/excess return for the Fave Five tracking portfolio is +1.0% since inception. 49.5% of selections have outperformed the Wilshire 5000 since original selection.

Tracking Dashboard: https://www.manifestinvesting.com/dashboards/public/fave-five

Fave Five (4/7/2017)

Fave Five (4/7/2017)

Our Fave Five essentially represents a listing of stocks with favorable short term total return forecasts (1 year, according to Analyst Consensus Estimates, or ACE) combined with strong long-term return forecasts and good/excellent quality rankings. The average 1-year ACE total return forecast is 8.4%.

The stocks from the Finviz Week (3/24/2017) have been doing exceptionally well (relative return = +7.5% already) and we’ll make sure to visit that screening method again — and likely at least once/month.

The Fave Five This Week

  • AmTrust Financial Services (AFSI)
  • LKQ (LKQ)
  • LuLuLemon (LULU)
  • Synaptics (SYNA)
  • Under Armour (UA)

The Long and Short of This Week’s Fave Five

The Long & Short. (April, 2017) Projected Annual Return (PAR): Long term return forecast based on fundamental analysis and five year time horizon. Quality Ranking: Percentile ranking of composite that includes financial strength, earnings stability and relative growth & profitability. VL Low Total Return (VLLTR): Low total return forecast based on 3-5 year price targets via Value Line Investment Survey. Morningstar P/FV: Ratio of current price to fundamentally-based fair value via www.morningstar.com S&P P/FV: Current price-to-fair value ratio via Standard & Poor’s. 1-Year ACE Outlook: Total return forecast based on analyst consensus estimates for 1-year target price combined with current yield. The data is ranked (descending order) based on this criterion. 1-Year S&P Outlook: 1-year total return forecast based on S&P 1-year price target. 1-Yr GS: 1-year total return forecast based on most recent price target issued by Goldman Sachs.

Fave Five Legacy (Tracking Portfolio)

The relative/excess return for the Fave Five tracking portfolio is +1.3% since inception. (The absolute rate of return is 17.0%.) 50.2% of selections have outperformed the Wilshire 5000 since original selection.

Tracking Dashboard: https://www.manifestinvesting.com/dashboards/public/fave-five

Round Table (March 2017)

Round Table (March 2017)

The March Round Table included some reminders about the virtues of a 8-year bull market — and the significant potential of using the Triple Play screening criteria. Take a look back at our features from March-April 2009 and a number of case studies (and smiles for many of us) erupt.

Archive: https://www.manifestinvesting.com/events/211-round-table-march-2017 (Will be added ASAP)

Stocks Presented

  • CVS Health (CVS)
  • EPAM Systems (EPAM)
  • Microchip Technology (MCHP)

The audience selected CVS Health (CVS).

Rt poll 20170328

Fave Five w/ Finviz (3/24/2017)

Attics, Launch Pads & Minefields? It’s Finviz time as we use the free online resource to discover some companies with elevated 1-year total return forecasts and end up with a bolstering update on AmTrust Financial (AFSI) and newcomers ConnectOne (CNOB) and Horizon Pharma (HZNP). Synchronoss Tech (SNCR) is a repeat selection.

Fave Five (3/24/2017)

Our Fave Five essentially represents a listing of stocks with favorable short term total return forecasts (1 year, according to Analyst Consensus Estimates, or ACE) combined with strong long-term return forecasts and good/excellent quality rankings. The average 1-year ACE total return forecast is 7.8%.

This week we went shopping for study opportunities using Finviz.com. Using the target price function, the hunt was on for companies with huge 52-week total return expectations. It’s part Matt Spielman rummaging in the speculative attic, part Broad Assets investment club scouring the launch pad and part minefield.

The Fave Five This Week

  • AmTrust Financial (AFSI)
  • ConnectOne Bancorp (CNOB)
  • Gulfport Energy (GPOR)
  • Horizon Pharma (HZNP)
  • Synchronoss Technology (SNCR)

The Long and Short of This Week’s Fave Five

The Long & Short. (March 24, 2017) Projected Annual Return (PAR): Long term return forecast based on fundamental analysis and five year time horizon. Quality Ranking: Percentile ranking of composite that includes financial strength, earnings stability and relative growth & profitability. VL Low Total Return (VLLTR): Low total return forecast based on 3-5 year price targets via Value Line Investment Survey. Morningstar P/FV: Ratio of current price to fundamentally-based fair value via www.morningstar.com S&P P/FV: Current price-to-fair value ratio via Standard & Poor’s. 1-Year ACE Outlook: Total return forecast based on analyst consensus estimates for 1-year target price combined with current yield. The data is ranked (descending order) based on this criterion. 1-Year S&P Outlook: 1-year total return forecast based on S&P 1-year price target. 1-Yr GS: 1-year total return forecast based on most recent price target issued by Goldman Sachs.

Fave Five Legacy (Tracking Portfolio)

The relative/excess return for the Fave Five tracking portfolio is +0.6% since inception. (The absolute rate of return is 15.9%.) 47.5% of selections have outperformed the Wilshire 5000 since original selection.

Tracking Dashboard: https://www.manifestinvesting.com/dashboards/public/fave-five

Fave Five: Gone Irish (3/17/2017)

Fave Five (3/14/2017)

Our Fave Five essentially represents a listing of stocks with favorable short term total return forecasts (1 year, according to Analyst Consensus Estimates, or ACE) combined with strong long-term return forecasts and good/excellent quality rankings. The average 1-year ACE total return forecast is 7.1%.

The Fave Five This Week

  • Boston Beer (SAM)
  • Exxon Mobil (XOM)
  • LKQ Corp (LKQ)
  • Perrigo (PRGO)
  • Target (TGT)

Gone Shopping With Walter (Schloss) and Hugh

“When buying a stock, I find it helpful to buy near the low of the past few years. A stock may go as high as 125 and then decline to 60 and you think it attractive. 3 years before the stock sold at 20 which shows that there is some vulnerability in it.” — Walter Schloss

“…the analyst interested in value is likely to place only minor emphasis upon the short term earnings outlook; whereas the analyst who endeavors to anticipate the price movements of the near future will make such outlook his major concern.” —
Ben Graham, Security Analysis

Hugh McManus has been a regular — and very successful stock selector — as a participant in our monthly Round Table series over the last eight years or so. Even in the months when he’s globe trotting and unable to join us, we’ll generally take a quick look for opportunities with a quick stock screen for high quality companies priced near their 52-week (or multi-year) lows. For more on this subject, see: Gone Fishing — Patiently and Disciplined Fishing

If a company is primed for long-term growth, buying it when the price is depressed is better than buying it when it’s at a 52-week high. If the stock price drops to a new low, there’s always bad news to explain the fall, which is one of those obvious truths. I had to learn whether I wanted to fixate on the bad news or focus on the low price of a good company. Most people seem to be transfixed by the news. I take it one step further and hope the bad news persists for a while — it’s where the psychiatrist would step in — as it allows me to buy more.

In 1997, or thereabouts, Ken “Mr. NAIC” Janke, commented that members of the organization were masterful at identifying quality companies, but not nearly as good at picking a low price. I had already adopted the practice of buying companies when they reached or were close to a 52-week low. It’s a rule not a law: for an idealized growth company, today’s close is the new 52-week low.

Ken Janke often spoke of the reality between the high and low prices during a given year for virtually all companies. The range is bigger than most people realize, as underscored by the accompanying chart via Saber Capital Management and John Huber.

Patience is genius in disguise.

The Discipline of Time Arbitrage. Time arbitrage is being willing to maintain a 3-5 year time horizon when most investors
and analysts are thinking about the next quarter. [This represents] a willingness to buy stocks that others are selling for short-term reasons. Many market participants want/need short-term results and so focus is on things like: Catalysts, short-term expectations, quarterly results …

Why Does This Work? Focusing on the long-term is difficult because:

  • Takes patience — There can be periods of under performance.
  • Most investors (clients) want results quarterly, or at least yearly, and so most money managers try to accommodate these short-term demands. (i.e. who cares what Apple looks like in 3 years, how many iphones are they going to sell this quarter??)
  • Short-term thinking (among investors, fund managers, and corporate management teams) is pervasive now, and the speed of technology and information probably intensifies this view.

All of these decisions being made for short-term reasons creates opportunity (and the biggest market inefficiency in my opinion) for those who can look out 2-3 years. Source: Saber Capital Management

StockSearch Results: Hugh’s Hunt For 52 Week Lows. Hugh maintains a short list of vetted stocks, most of which he has been a long term shareholder. He monitors for accumulation opportunities when one of his favorites approaches a 52-week low. For the screening results shown, we’ve limited the field to high-quality (excellent) stocks that are within 5% of their 52-week low, while demanding above average financial strength. [Source: www.manifestinvesting.com StockSearch, 3/17/2017.]

The Long and Short of This Week’s Fave Five

The Long & Short. (March 17, 2017) Projected Annual Return (PAR): Long term return forecast based on fundamental analysis and five year time horizon. Quality Ranking: Percentile ranking of composite that includes financial strength, earnings stability and relative growth & profitability. VL Low Total Return (VLLTR): Low total return forecast based on 3-5 year price targets via Value Line Investment Survey. Morningstar P/FV: Ratio of current price to fundamentally-based fair value via www.morningstar.com S&P P/FV: Current price-to-fair value ratio via Standard & Poor’s. 1-Year ACE Outlook: Total return forecast based on analyst consensus estimates for 1-year target price combined with current yield. The data is ranked (descending order) based on this criterion. 1-Year S&P Outlook: 1-year total return forecast based on S&P 1-year price target. 1-Yr GS: 1-year total return forecast based on most recent price target issued by Goldman Sachs.

Fave Five Legacy (Tracking Portfolio)

The relative/excess return for the Fave Five tracking portfolio is +0.8% since inception. (The absolute rate of return is 19.0%.) 48.5% of selections have outperformed the Wilshire 5000 since original selection.

Tracking Dashboard: https://www.manifestinvesting.com/dashboards/public/fave-five

Trucking In Tulsa (3/10/2017)

This Week at MANIFEST (3/10/2017)

Common Sense, Care Of Catoosa

“If you want to be successful, it’s just this simple. Know what you are doing. Love what you are doing. And believe in what you are doing.” — Will Rogers

No, I haven’t forgotten that the trucking and logistics stocks are in Issue 2 and that this week’s update centers on Issue 4 — home to many healthcare and aerospace/defense stocks.

It’s just that a significant number of hours sharing lanes with Knight Transportation, Swift, Old Dominion and a number of CVS Health semis provides some time for pondering while en route on Route 66 to the Port of Catoosa. (Tulsa)

Ken Kavula and I were met in Catoosa by a throng of committed long term investors and we greatly enjoyed spending the weekend with them. Ken did his travel research on the Issue 1 airlines and perhaps he can explain Buffett’s sudden interest in the group, but that’s a topic for another day. Probably.

We took a stroll through 70 years of investing better — together. Some rules and guidelines were reinforced. Others were disturbingly challenged. We were reminded how the Tin Cup model portfolio handled the 2007-2008 market challenge and wondered why we spend so much time worrying about asset allocation (shifting to cash equivalents when the market seems overpriced.) Our subscribers fondly remember our 2008 open letter to the Presidential candidates: An Open Letter To The President.

Is the market over priced? What if it’s not? Recall those surging estimates for S&P 500 earnings from the analysts a few weeks ago. If they’re right about 2018, 2019 and beyond …

If the accompanying chart isn’t “haunting” or reinforcing — it probably ought to be.

And in that spirit, we think it probably makes sense to keep doing what we always do … INVEST IN THE BEST, but only when they’re on sale. We’ve never seen a moment where we couldn’t find several worthy stocks. If we ever do, we’ll start worrying about electric fences.

“With a sufficiently long term perspective, bear markets become blips.” — Cy Lynch

Thanks, Catoosa.

MANIFEST 40 Updates

Round Table Stocks

Best Small Companies

(None)

Results, Remarks & References

Companies of Interest: Value Line (3/10/2017)

The average Value Line low total return forecast for the companies in this week’s update batch is 1.9% vs. 2.9% for the Value Line 1700 ($VLE).

Materially Stronger: Community Health (CYH), Regeneron Pharma (REGN), Illinois Tool Works (ITW), Anthem (ANTM), Envision Health (EVHC)

Materially Weaker: Tenet Healthcare (THC), Quality Systems (QSII)

Discontinued: Clarcor (CLC), Tessera Tech (TSRA)

Market Barometers

Value Line Low Total Return (VLLTR) Forecast. The long-term low total return forecast for the 1700 companies featured in the Value Line Investment Survey is 2.9%, down from 3.0% last week. For context, this indicator has ranged from low single digits (when stocks are generally overvalued) to approximately 20% when stocks are in the teeth of bear markets like 2008-2009.

Stocks to Study (3/10/2017)

There continues to be evidence of strengthening fundamentals and 1-year price targets are getting adjusted upward, on balance. Many of the biotech and pharma companies are showing the damage — and resultant higher return forecasts — as a result of “bashing” and criticism from inside the Beltway.

Based on the near term expectations for Round Table selection MEDNAX (MD), it will be interesting to see if we’re truly “early” and/or if we catch a wave as the S&P and Morningstar and Goldman Sachs analysts catch up with us. [Grin] […and Hope]

The Long & Short. (March 10, 2017) Projected Annual Return (PAR): Long term return forecast based on fundamental analysis and five year time horizon. Quality Ranking: Percentile ranking of composite that includes financial strength, earnings stability and relative growth & profitability. VL Low Total Return (VLLTR): Low total return forecast based on 3-5 year price targets via Value Line Investment Survey. Morningstar P/FV: Ratio of current price to fundamentally-based fair value via www.morningstar.com S&P P/FV: Current price-to-fair value ratio via Standard & Poor’s. 1-Year ACE Outlook: Total return forecast based on analyst consensus estimates for 1-year target price combined with current yield. 1-Year S&P Outlook: 1-year total return forecast based on S&P 1-year price target. 1-Yr “GS” Outlook: 1-year total return forecast based on most recent price target issued by Goldman Sachs.