On Pitching Better

Dance Until Everybody’s Watching

 Mark  Robertson   “Work like you don’t need the money. Love like you’ve never been    hurt. Dance like nobody’s watching.” — Satchel Paige (1906-82)
. . . and sing like you do when you’re alone and behind the wheel of your car. I’m not sure what happens to that amazing rock star or would-be opera sensation when I leave the car, but my serenades just aren’t the same as between Point A and Point B. Anybody else encounter that mystery?

Satchel Paige is part of the magical lore of baseball legend. He springs to mind almost every year as dreams develop in the hearts and minds of Americans with the start of yet another baseball season. Yes, I believe the Chicago Cubs and Boston Red Sox will win it all someday.

If we could ask him, Paige would agree.

But Satchel transcends the sporting world. His words are about life itself. He’s often quoted, and you’ll recognize many of his gems.

“Age is a question of mind over matter. If you don’t mind, it doesn’t matter.”

Every time I see that one I smile and think of people like Tom O’Hara and Ralph Seger and countless NAIC chapter volunteers who are so willing to share their investing experience with anybody who will listen. Many of them have a lot of years, but their spirit prevents them from having a lot of “age.”

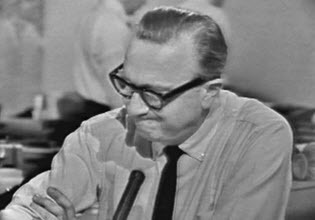
Paige was timeless. We’re not even sure when he was born — it’s estimated that he was born on July 7, 1906. In 1965 he took the pitching mound for the last time, throwing three shutout innings for the Kansas City Athletics. Fifty-nine years old. Wow.

“You win a few, you lose a few. Some get rained out. But you got to dress for them all.”

“Don’t pray when it rains if you don’t pray when the sun shines.”

“I never threw an illegal pitch. The trouble is, once in a while I would toss one that ain’t never been seen by this generation.”

Pitching Better

This is part of where the challenge that faces us resides. NAIC investing ain’t all that easy to see by this or the next generation. At least not yet.

And we simply have to find effective means of making this so.

During a recent strategy session, a group of us spent considerable time discussing the attributes of NAIC and investing better. One of the participants chimed in with: “These characteristics are all part of the better investing experience. However, what we do ‘here’ is really more about enabling individuals to access a lifetime of successful investing. We can point to case after case where an individual or group of people have experienced a favorable impact on their lives as a result of what we think of as investing better. Perhaps we ought to focus a little more on this notion of better.”

“I never had a job. I always played baseball.”

“Ain’t no man can avoid being average, but there ain’t no man got to be common.”

NAIC holds a solution to many of the perplexing mysteries of investing. As Satchel suggests, this carries a responsibility, and it doesn’t have to be “work.” It’s part of our purpose.

Some recent surveys show that the average investor is generally miserable. We also know that NAIC investors are a bold exception. In exit surveys (from former members) conducted in February 2004, we asked them if NAIC made them better investors during the time they spent with us. Result: Yes — 73. No — 0.

Better — According to Webster

The definitions for the word better include: being positive or desirable in nature, a good experience; having qualities that distinguish, serving a desired purpose; superior to the average, of high quality; complete, thorough, reliable, beneficial to health; and a condition of excellence.

All of this reconciles pretty well with my view of what investing better is all about. It’s a time-honored approach that’s ageless. “How old would you be if you didn’t know how old you are?” It’s an interesting question and challenge.

Investing better. Enabling better futures. NAIC investors do not sing or dance alone.

Mark Robertson is the founder and managing partner of Manifest Investing, an investment research firm focused on strategic long-term principles. He served as senior contributing editor for NAIC/BetterInvesting from 1997 to 2004.  This article was originally published in Better Investing in 2004.

Fave Five: What Works Best? (So Far)

This Week’s Fave Five is brought to you by Pittsburgh’s own Pat Donnelly. Pat stopped me in the hall at the National Association of Investors annual conference and said, “You know what — among many things — I wonder about? Which Fave Five selection mode has delivered the best performance?” That’s a really, really good question. Pat is the chair of the NAIC volunteer advisory board.

Fave Five (5/24/2019)

We started the Fave Five as something of a whim. It was sort of the answer to the question, “Is it possible to highlight 3-5 companies a month, let alone a week?” After a few years, the results are becoming compelling and provocative. If you’ve been around here for more than a little while … you know that we treasure skepticism and critical thinking about the challenges and potential of investing.

It’s time to refine our characterization of the “Fave Five.”

Our Fave Five essentially represents a listing of stocks with favorable long term total return forecasts and good/excellent quality rankings. We basically screen on Manifest Ranking (equally-weighted PAR and Quality). This is the primary screening criteria every single week. The only variation is how “deep” we go into the percentile rankings. Sometimes we stop at 99.44% … other times sticking to the top 2% … or 5% … and when in a bottom fishing mode as low as top 50% or even “deeper.”

Selections

Keep in mind that a repeat appearance among the Fave Five for a given DOES NOT result in “accumulation.” Once a stock is “in”, it’s in until it’s “out.” So the accompanying image of results is measuring the performance of the tracking portfolio.

And speaking of “out”, we’ve been using this demonstration portfolio to deploy (1) Rule-of-5 “time outs” for companies that lag the market by more than 20 percentage points, (2) celebrate success as measured by a stock price soaring to the extent that the return forecast (PAR) approaches low single digits. These are fun. (3) We’ll be adding a quality degradation algorithm. Stay tuned.

Second Screens

So the real difference is the secondary screening criteria each week. The default setting is the highest 1-year total return forecast by analyst consensus. Hence the 112 selections. We’re elated to see a premise hold as the relative return for this most frequent criterion is beating the market.

But the most compelling results come from three secondary screening criteria: (1) High Growth, (2) Irish Spring and (3) Triple Play. High Growth is just what you think it is. It’s compliant with our search for excellent smaller and faster-growing companies. The elevator speech is GREAT companies growing in double digits — with top line growth of 10% or 12% or more.

Irish Spring resonates with real “risk” reduction as our resident Irishman, Hugh McManus, has guided us to find GREAT companies available near their 52-week lows.

And Triple Play is a powerful nod to the legacy of the modern investment club movement and George Nicholson’s nudge to seek companies with (1) depressed stock prices, that (2) have the potential for margin enhancement and (3) P/E ratio expansion.

“Most Oversold” is simply the qualifiers with the lowest Relative Strength Index (RSI) courtesy of StockCharts.com. Yes, Virginia, it’s a technical indicator. But it could prove to be something that heeds Ralph Acampora’s advice in Chicago last weekend to “Go ahead and do all the wonderful things you do to study companies but before you press the BUY button, do Ralphie a favor and check the price trends. Is your discovery gaining or falling in stock price?” There’s only two selections in this category so far. That will change. Soon.

We’re also optimistic about Owner ROC. (More to follow on this) Anecdotally, we think it will remain faithful to virtually all of the foundational concepts while raising the awareness and emphasis on debt capital. Stay tuned here, too.

The Long and Short of This Week’s Fave Five

Long & Short Term Perspectives. (May 24, 2019) Projected Annual Return (PAR): Long term return forecast based on fundamental analysis and five year time horizon. Quality Ranking: Percentile ranking of composite that includes financial strength, earnings stability and relative growth & profitability. MANIFEST Ranking: Equally weighted ranking of Return Forecast (PAR) and Quality. 52-Week Position: Position on scale between 52-week low price and 52-week target price. VL Low Total Return (VLLTR): Low total return forecast based on 3-5 year price targets via Value Line Investment Survey. Morningstar P/FV: Ratio of current price to fundamentally-based fair value via www.morningstar.com ACE P/FV: based on analyst consensus for fair value. Owner’s Return On Capital: Return (Profitability, long term estimate) vs. Total Capital (equity + debt). S&P P/FV: Current price-to-fair value ratio via Standard & Poor’s. 1-Year ACE Outlook: Total return forecast based on analyst consensus estimates for 1-year target price combined with current yield. The data is ranked (descending order) based on this criterion. 1-Year S&P Outlook: 1-year total return forecast based on S&P 1-year price target.

Fave Five Legacy (Tracking Portfolio)

The relative/excess return for the Fave Five tracking portfolio is +2.4% since inception.

The absolute annualized rate of return is 11.8%.

Tracking Dashboard: https://www.manifestinvesting.com/dashboards/public/fave-five

Fave Five (5/17/2019): Prohibition Edition

Fave Five (5/17/2019)

Our Fave Five essentially represents a listing of stocks with favorable short term total return forecasts (1 year, according to Analyst Consensus Estimates, or ACE) combined with strong long-term return forecasts and good/excellent quality rankings. The median 1-year ACE total return forecast is 14.1%.

The City of Big Shoulders … and a Speak Easy, Or Two …

The National Association of Investors held their annual conference in Chicago this past weekend and I was honored/privileged/grateful to attend and to support the efforts of a gifted gypsy band of awesome volunteers. You know who you are. Thank you. Even better, the educational slate included our dear knights (and a damsel) as Kim Butcher, Ken Kavula and Cy Lynch provided several sessions and discussions. Hugh McManus would have joined us if his company hadn’t jobnapped him somewhere between Singapore and San Francisco and diverted him to Barcelona for the weekend.

  • You know you might be in Chicago when the banquet menu includes hot dogs smothered in onions, mustard, pickle spears with a side of deep dish pizza.
  • You know you might be in Chicago when the LIVE Round Table audience in true crowd rebellion decides that they can vote more than once for stock nominations. (And they’re right)
  • You know you might be in Chicago when all of the wait-until-next-year attire has morphed into World Series Champion paraphernalia.
  • You know you might be in Chicago when people are imitating the voices of Sean Connery and Kevin Costner in the hallways lined with pictures of beer being “distributed” from barrels on to the streets. (This sort of behavior is likely frowned upon by our resident Irishman Hugh AND his partner in crime, Pat Donnelly.)
  • You know you might be in Chicago when an audience of investors wants to talk about cannabis, prohibition and the companies that prospered when Elliott Ness stopped foaming up State Street back in the 1930s. When the audience assumes control of the discussion (which we encourage) and starts talking about specific investment characteristics of Anheuser-Busch, fields of opportunity, distribution infrastructure and doing stock studies on companies from 1933 … I’m pretty sure that, yes, you’re in Chicago.

Yes, you’re among friends who like to share ideas, devastate the mysteries of investing … and they’re BETTER when they do it together.

Three of this week’s Fave Five figured prominently in panel discussions and sessions. Cantel Medical (CMD) was selected by Ken Kavula during the opening session stock panel and Cy Lynch selected II-VI (IIVI) for the Round Table. Kim Butcher selected Air Lease (AL) for the Round Table and the audience seconded her motion while pondering just how many hands and appendages they could vote with for the various nominations. (Except for my pick, REGN, which received an insignificant number of appendages and at least one guffaw. I’m hurt but unswayed.)

Spirit Air Lines (SAVE) did not come up but probably should have. It was on my short list. (But it’s moot. You probably wouldn’t have voted for it anyway.)

The Long and Short of This Week’s Fave Five

Long & Short Term Perspectives. (May 17, 2019) Projected Annual Return (PAR): Long term return forecast based on fundamental analysis and five year time horizon. Quality Ranking: Percentile ranking of composite that includes financial strength, earnings stability and relative growth & profitability. MANIFEST Ranking: Equally weighted ranking of Return Forecast (PAR) and Quality. 52-Week Position: Position on scale between 52-week low price and 52-week target price. VL Low Total Return (VLLTR): Low total return forecast based on 3-5 year price targets via Value Line Investment Survey. Morningstar P/FV: Ratio of current price to fundamentally-based fair value via www.morningstar.com ACE P/FV: based on analyst consensus for fair value. Owner’s Return On Capital: Return (Profitability, long term estimate) vs. Total Capital (equity + debt). S&P P/FV: Current price-to-fair value ratio via Standard & Poor’s. 1-Year ACE Outlook: Total return forecast based on analyst consensus estimates for 1-year target price combined with current yield. The data is ranked (descending order) based on this criterion. 1-Year S&P Outlook: 1-year total return forecast based on S&P 1-year price target.

Fave Five Legacy (Tracking Portfolio)

The relative/excess return for the Fave Five tracking portfolio is +2.4% since inception.

The absolute annualized rate of return is 11.8%.

Tracking Dashboard: https://www.manifestinvesting.com/dashboards/public/fave-five

Ten Years … Gone “Hog Wild”

This started with the top trailing 10-year performers from the S&P 500, which is cool — and at least they got that going for them. But we know the virtues of All-of-the-Above investing, which means the Value Line 1700 list is even cooler. Look what Groundhog Nation did with them.

Carl Quintanilla (CNBC) provided this list of the best performing stocks in the S&P 500 since the market low ten years ago.

It’s been fun and rewarding for many. Take note how many of these have been covered and/or resident in our model portfolios, etc. since then.

Who did we miss? Why?

Spy top 50 performers since 2009 20190308

So what were you doing when the “Great” Recession bottomed on March 9, 2009? CNBC got this whole this started with the S&P 500 but we know that even better opportunity manifests in the Value Line 1700 — and we weren’t disappointed.

There are 1200 stocks with stock price data for 3/9/2009 and 3/8/2019, ten years later. Investing $100 into each of these 1200 ($120,000) would worth $1,012,892 this past weekend — an annualized total return of 23.8%. Sorry, Carl Quintanilla, but the S&P 500 checks in at 17.3%.

  • The annualized total return (10 years) on the Wilshire 5000 (VTSMX) is 17.5%. 655 of the 1200 stocks (54.6%) beat the market. This collective of gainers have an average quality ranking of 69.
  • 1138-of-1200 (94.8%) gained and a have a current value greater than $100. The stocks that lost ground have an average quality ranking of 27.
  • The top performing decile has a sales growth forecast of 9.2%. The bottom decile stands with a 5.3% growth forecast.
  • If the Value Line Arithmetic Average were “investable,” the annualized total return was 19.7% as 999.30 advanced to 6046.07 during the time period. All-of-the-Above Investing works.

Gone Hog Wild (March 2009)

Every year we run a stock picking contest that starts on Groundhog Day and continues until the next Groundhog Day. Back in March 2009, we featured the most-frequently selected stocks as something of a screening exercise. As the accompanying image shows, yes, Virginia, the average return forecast was “north” of 20% at the time.

The Sweet 16 stocks featured back in March 2009 generated a return of 21.2%.

The top performer was the swing-for-the-fences selection of Sigma Designs (SIGM) and every once in a while, Casey does not always strike out. 36.6% can be a wonderful thing. But the rest of the field was also formidable and include a number of community favorites (Manifest Investing 40 residents).

Sweet 16 (3/1/2009) Results — Ten Years Later. As shown the collective performance of the (16) selections known as “Heavy Hogs” delivered a 21.2% annualized total return. Dividends are included. We can’t help but note the strong performance from the companies at the top of the 10-year-old screening results vs. the achievements of some nearer the bottom. Quality Systems (QSII) morphed into NextGen Healthcare (NXGN). [Editor’s Note: If we’d only listened to Cy Lynch and WellCare Health Plans (WCG) at the time, +44.1%.] Buffalo Wild Wings (BWLD) was acquired by Arby’s after a considerable gain. Navellier Fundamental (NFMAX) evolved into a private wrap offering, results shown are from Navellier fact sheet (https://navellier.com/files/3815/4964/8534/fundamental-a-factsheet.pdf).


Invest With Your Friends.  The journey can be a most informative, rewarding and entertaining adventure.


Start a test drive (trial subscription) at http://www.manifestinvesting.com ($79/year, group discounts for club partners and educators) and participate in the next ten years of going “Hog Wild.”

Questions?

Contact Mark Robertson via markr@manifestinvesting.com or via Twitter by reaching out to @manifestinvest.  Manifest Investing also maintains a “slipstream blog” at Facebook: https://www.facebook.com/manifestinvesting/  Comments and inquiries welcome.


The NEW CVS Health (CVS)

This article is a current example of the type of company analysis Manifest Investing (and our friends) performs on stocks following the time-honored (since 1941) methods of the modern investment club movement.  CVS is the 10th most widely-followed stock by our community of investors and is the 2nd most frequently-selected stock during our monthly FREE webcasts known as our Investing Round Table.  Note: The 9-year annualized rate of return for the stocks featured is 15.5%.  Start a test drive (trial subscription) at http://www.manifestinvesting.com ($79/year, group discounts for club partners and educators) and see the answers to some natural “next” questions including: (1) What about store growth? and (2) How much did Warren Buffett overpay for Heinz and did CVS pay too much for Aetna?

At CVS Health, we share a clear purpose: helping people on their path to better health. Through our health services, plans and community pharmacists, we’re pioneering a bold new approach to total health. Making quality care more affordable, accessible, simple and seamless, to not only help people get well, but help them stay well in body, mind and spirit.

Cy Lynch warned all of us as he selected CVS Health (CVS) again for the February Round Table. CVS now ranks as the 2nd most frequently selected company for the tracking portfolio. Cy’s warnings? (1) You can’t lean on the rear view mirror for this one. The historical data doesn’t include Aetna. (2) The fear and herd-following among the Rhinos has delivered some painful price action. [Note: The Rhinos just could be right.] (3) CVS is undergoing a high risk (general perception) transformation from the current business model to one that seeks to optimize wellness, decrease dependency on pharmaceutical band-aids (!!!) and fight to establish an effective go-to solution that serves customers with a cost effective path to health.

The Wind Is Blowing

Reference: Looking Ahead: 2019 Health Care Trends

Business Model Analysis (Sales)

CVS Health. Pro Forma Sales Projections. As Cy suggested, the company has shifted. The step change in sales due to the addition of Aetna can be seen in 2018. The growth rate (slope of the trend line) from 2010-2017 is visually different from the slope seen for 2018-2023. The former trend (10-12%) no longer applies to a stock study of the new CVS. It’s supporting information for what may be possible — but the growth rate suggested in the SEC filings is 6-7%. (Value Line has a much more pessimistic outlook for the 3-5 year forecast — resulting in a growth forecast of 4.5%)

The profitability forecast (according to CVS and the legions of Rhinos who chimed and rhymed with opinions about the Aetna deal) is available here also. Dividing the net income in 2022 into the the sales forecast, we see (11.6/333.4) = 0.035 = 3.5%

… And Now, The Rest Of The Story

My personal opinion is that it boils down to remembering and realizing that CVS is the company that discontinued the sale of cigarettes a few years ago to a chorus of whining and Armageddon commentary from the Rhinos.

This is massively challenging but a mission with merit. This core holding — at least temporarily — has shifted from blue chip stalwart to execution-based speculation. But it’s a good speculation based on the promises delivered by excellent management over the past several years. The investing jungle is full of doubting Rhinos and the stock price has been mightily challenged, accordingly. That said, the expectations (4% growth, 3.5% profitability, 11.5x average P/E) are the types of low bars that investors like Graham and Buffett have vision cast as stepping over them while others assail the assortment of 7-foot high jump bars with other opportunities.

Imagine them ripping out the chips and candy and recapturing the space with cost-effective access to doctors, physician’s assistants, nurse practitioners and various flavors of therapists and nutritional campaigns. Imagine America taking a few less pills and feeling comprehensively better. CVS ripped out the smoking products. How challenging is it to believe that they just might be serious about the rest of this?

References

Questions?

Contact Mark Robertson via markr@manifestinvesting.com or via Twitter by reaching out to @manifestinvest.  Manifest Investing also maintains a “slipstream blog” at Facebook: https://www.facebook.com/manifestinvesting/  Comments and inquiries welcome.

A Harangue of Hoopla

This column appeared in Better Investing magazine nearly 20 years ago. The only time I now trim my eyebrows is when my wife threatens me.

1998. Paraphrasing a great statesman, “It was a year like all years, filled with events that shape and illuminate our times.” It’s so true. In some ways this one was different, but in many others, the same.

One difference was thanks to the recent space mission, our 12-year-old daughter has now seen Mr. Cronkite, and she now knows who he is. Our 8-year-old observed that he seems to be a “nice, smart man, but he needs to trim his eyebrows.” We gently reminded him to be polite and offered some photos of Albert Einstein. During an afternoon at the Ford Automotive Museum, we discovered that the more “famous” of the Fords was Henry, not the Harrison variety that the kids seem to know better. The kids (and adults) were treated to stories of innovation about the real Mr. Ford and his relationship with Thomas Edison. Alex, in noticing Mr. Edison’s “bad hair day” in a photo, combined with the Einstein photo, and Walter’s eyebrows, decided to muss his hair to see if it stirred his imagination. I’d submit that it already had.

As this issue went to press, we appeared to be headed for another strong annual performance result. 1998 had its moments, including the July-August sell-off which quickly reminded many that these things do happen. Interestingly enough, the September-to-November rebound may have inhibited the message a little. Although far from a market call, we might observe that third and fourth quarter earnings results continue to weaken. If this trend continues, it would be easy to build a case for some tough days ahead.

There are risks associated with investing in stocks. Recent exuberance sometimes makes this message a little hard to deliver. But in 1998, as in every year, one of our core messages is to encourage investors to stay the course, no matter what tomorrow brings. The greater risk, to us, is that of NOT being involved.

The Wall Street Journal caused a bad hair day for the NAIC last week, followed by legions of syndicated translations nationwide in the days that followed. The Chicago Tribune decided that their own interpretation was “Join an Investment Club? No Thanks!”

We might suggest two themes for your consideration. The first is that it’s possible that, once again, the message delivered misses the point. See “Our Editor’s Reaction” below.

The second is that it’s time to extinguish some of the mystery. NAIC investors are extremely successful, so much so that we’ll continually be challenged by those untouched by our community and experience. It’s time for a factual debate and apples vs. apples comparisons. In the months ahead, we’ll look to explore the facts and share them with you.

The annual performance of growth mutual fund managers is commonly cited. We read that 5, 10, 20 and in rare cases, 30 or 40 percent of funds exceed the S&P 500 in a given year. The NAIC has conducted surveys, going back decades, that measure performance, using lifetime statistics and a more stringent comparison, as we assess performance. Placing mutual funds under a multiyear microscope, here’s a chilling statistic. From a sample of 3,637 funds, regardless of type, 18 or 0.5 percent (that’s 1-in-200, folks) outperformed the S&RP 500 over the last five years.

It’s time to explore our fascinating track record and Great Expectations going forward. As for our eight year old, Alex, I doubt that he’ll ever trim his eyebrows.

The NAIC wishes a most jubilant and safe holiday season, to you and your family.

Happy President’s Day!

This Week at MANIFEST (2/22/2019)

“Investment in knowledge pays the best interest.” — Abraham Lincoln

“I am a firm believer in the people. If given the truth, they can be depended on to meet any national crisis. The great point is to bring them the real facts — and some beer.” — Abraham Lincoln

Raise A Glass

Lincoln was a voracious reader. And legend has it — a pretty good listener, too. Reading the Lincoln-Douglas debate transcripts, he was self-effacing, quick on his feet and the exchanges were actually pretty enjoyable (most of the time.)

Holders of the nation’s highest office have often had a close relationship with booze, as George Washington established the nation’s largest whiskey distillery in 1797 and Thomas Jefferson brewed his own beer. Andrew Jackson’s inaugural party in 1829 was so legendary that we still drink the orange punch party goers consumed. But Lincoln was the only president who was also a licensed bartender.

While they sold booze, it was far from a watering hole. The Chicagoist states that “Stores could sell alcohol in quantities greater than a pint for off-premises consumption, but it was illegal to sell single drinks to consume at the store without a license.

In March 1833, Berry and Lincoln were issued a tavern, or liquor, license, which cost them $7 and was taken out in Berry’s name. Stores that sold liquor to consume on the premises were called groceries.

So … it’s more appropriate to think of Lincoln as a grocer than a bartender.

I still think the Spielberg movie, Lincoln is a must see in these interesting times in which we live.

Why In The World Would A Long Term Investor Live In Fear Of Recessions?

MANIFEST 40 Updates

Round Table Stocks

  • Alliance Data Systems (ADS)
  • CBRE Group (CBRE)
  • C.H. Robinson (CHRW)
  • Forward Air (FWRD)
  • Health Care Services (HCSG)
  • Illumina (ILMN)
  • Maximus (MMS)
  • S&P Global (SPGI)
  • Starbucks (SBUX)

Best Small Companies (2019 Dashboard)

The status of the 2019 Best Small Companies can be tracked at: https://www.manifestinvesting.com/dashboards/public/best-small-2019

Investing Round Table Sessions (Video Archives)

Investing Topics with Ken, Mark & Friends

Results, Remarks & References

Companies of Interest: Value Line (2/22/2019)


The median Value Line low total return forecast for the companies in this week’s update batch is 7.3% vs. 6.5% for the Value Line 1700 ($VLE).

Materially Stronger: Golar LNG (GLNG), Allegiant Travel (ALGT), United Continental (UAL), Spirit Airlines (SAVE)

Materially Weaker: Bristow Group (BRS), Papa John’s Pizza (PZZA)

Discontinued: Dun & Bradstreet (DNB), American Railcar (ARII)

Market Barometers

The thing very few people tell you about “overvalued” markets is that, occasionally, the fundamentals arrive to justify them. — Joshua Brown

Value Line Low Total Return (VLLTR) Forecast. The long-term low total return forecast for the 1700 companies featured in the Value Line Investment Survey is 6.5%, decreasing from 7.7% last week. For context, this indicator has ranged from low single digits (when stocks are generally overvalued) to approximately 20% when stocks are in the teeth of bear markets like 2008-2009.

Update Batch: Stocks to Study (2/22/2019)

Long & Short Term Perspectives. (February 22, 2019) Projected Annual Return (PAR): Long term return forecast based on fundamental analysis and five year time horizon. Quality Ranking: Percentile ranking of composite that includes financial strength, earnings stability and relative growth & profitability. VL Low Total Return (VLLTR): Low total return forecast based on 3-5 year price targets via Value Line Investment Survey. Morningstar P/FV: Ratio of current price to fundamentally-based fair value via www.morningstar.com S&P P/FV: Current price-to-fair value ratio via Standard & Poor’s. 1-Year ACE Outlook: Total return forecast based on analyst consensus estimates for 1-year target price combined with current yield. 1-Year S&P Outlook: 1-year total return forecast based on S&P 1-year price target.

The average return forecast (PAR) for this week’s update batch is 8.7%. (MIPAR = 8.2%)

The 52-week total return forecast for the group is 18.7% versus 14.9% for stocks overall. S&P has a 1-year outlook for this week’s batch at 10.4%.

Morningstar sees them as fairly valued (P/FV = 101%) and S&P “dissents” at a P/FV of 107%.

Discovery Club

““I think I could make you 50% a year on $1 million. No, I know I could. I guarantee that.” — Warren Buffett, 1999 BusinessWeek Interview

This is a reference to portfolio design and balance — specifically achieving a blend of blue chip stalwarts combined with a suitable mix of faster growing promising smaller companies. We generally aim for an overall sales growth forecast of 10-12% with suitable adjustments for time horizon and/or risk tolerance. Based on some recent soul searching, we’re now pondering how much “relatively undiscovered company content” is enough. Or too much? In any event, we’ll be dedicating a larger slice of our weekly updates to DISCOVERY.

This Week’s Sources and Suggestions

  • Value Line Investment Survey Updates
  • Groundhog Challenge XIII (2019) Entries
  • Barron’s 100 Sustainable Companies
  • Kim Butcher’s S&P 600 Initiations

Coverage Initiated/Restored: Northstar Realty Europe (NRE), RingCentral (RNG), Roku (ROKU), Invitae (NVTA), Baozun ADR (BZUN), DXC Technology (DXC)

On Recessions (State of Investing)

The thing very few people tell you about “overvalued” markets is that, occasionally, the fundamentals arrive to justify them. — Joshua Brown

If there’s one image that captures the State of the Investing “Union”, this is one of the more important flavors. Recessions massacre profitability and explode Stock Selection Guides (2008-2009). Companies with weak profitability dip below zero and EPS “disappear.”

Value Line Arithmetic Average Companies ($VLE) ex-Financials. This statistic covers the industrials and excludes the asset-based companies where we focus on ROE.

One of the biggest reasons that the 2016-2017 period for the bull market was so “empty” for most investors is because of the recessionary conditions that materialized in some segments, rolling corrections. With the tax law revisions for 2018 and beyond, we’ll be carefully monitoring the additions of 2020 and 2024 estimates to our studies as Value Line ratchets their data arrays one year during upcoming Issue updates.

Crowning Groundhogs (2018)

This Week at MANIFEST (2/8/2019)

“A group of investors heeding the lessons of Graham, Babson and Nicholson has at least one leg up on the crowd and a better than average opportunity to generate exceptional returns.” — Our Groundhog Creed.

Super Performances

The Super Bowl is on Sunday.

Sorry Patriots fans, but if you care about the 2019 stock market, the only thing standing between you and the oblivion of an “old AFL team” winning the Super Bowl and poking the restless bear, the accompanying image of a focused Ram is it. Go Rams!

And that’s the second most important thing going down this weekend.

Our courageous band of Groundhogs have finished another revolution around the sun, the twelfth such rendition — and we’ll be crowning another repeat champion, Anna Gombar of Holly, Michigan.

Inviting Anna Gombar (and her husband Rod) to a stock selection contest is like inviting Tom Brady to a football tournament.

The results are in and the accounting team is crunching numbers, munching pizza and chugging adult beverages in the conference to compile the final results. Spoiler alert: They’re outstanding. Again. (I hope) No, we expect.

Back To The Super Bowl And All Things Commercial

What have been your favorites over the years? The Coca-Cola ad ranks as one of the best of all time. The Apple commercial is epic. And Budweiser consistently hits it out of the park with the gorgeous Clydesdales. But the E*Trade babies and the CareerBuilder Monkeys are legendary.

But — to us (particularly in Michigan) — the Eminem commercial by Chrysler stands out among the best. Ever.

The S&P’s 7.9% Advance Marked Its Best Start To The Year Since 1987

Sharp Rebound. The S&P 500 had it’s best month in three years following December’s slump. Hard to think of the market gyrations over the last four months as anything but a YoYo “Walk-The-Dog” market.

MANIFEST 40 Updates

  • 2. Cognizant Technology (CTSH)
  • 4. Microsoft (MSFT)
  • 12. Alphabet/Google (GOOG)
  • 19. Visa (V)
  • 27. Oracle (ORCL)
  • 28. Wells Fargo (WFC)
  • 36. T. Rowe Price (TROW)

Round Table Stocks

  • Amazon (AMZN)
  • Baidu (BIDU)
  • Booking.com (BKNG)
  • Cognizant Technology (CTSH)
  • eBay (EBAY)
  • EPAM Systems (EPAM)
  • FleetCor (FLT)
  • Global Payments (GPN)
  • Infosys Tech (INFY)
  • Microsoft (MSFT)
  • PayPal (PYPL)
  • SEI Investments (SEIC)
  • T. Rowe Price (TROW)
  • Western Union (WU)

Best Small Companies (2019 Dashboard)

The status of the 2019 Best Small Companies can be tracked at: https://www.manifestinvesting.com/dashboards/public/best-small-2019

Investing Round Table Sessions (Video Archives)

Turnout Tuesday Educational Sessions

Results, Remarks & References

Companies of Interest: Value Line (2/8/2019)

The median Value Line low total return forecast for the companies in this week’s update batch is 5.7% vs. 7.7% for the Value Line 1700 ($VLE).

Materially Stronger: Fiserv (FISV)

Materially Weaker: Sohu.com (SOHU), Ameriprise (AMP), SEI Investments (SEIC), BlackRock (BLK), Ctrip.com (CTRP), GroupOn (GRPN), Capital One (COF), Ansys (ANSS)

Discontinued:

Market Barometers

The thing very few people tell you about “overvalued” markets is that, occasionally, the fundamentals arrive to justify them. — Joshua Brown

Value Line Low Total Return (VLLTR) Forecast. The long-term low total return forecast for the 1700 companies featured in the Value Line Investment Survey is 7.7%, decreasing from 7.7% last week. For context, this indicator has ranged from low single digits (when stocks are generally overvalued) to approximately 20% when stocks are in the teeth of bear markets like 2008-2009.

Groundhog Challenge 2019

Gh invite 20190130

Get Me Through December … & Beyond

This Week at MANIFEST (12/28/2018)

“Patience is genius in disguise.” — Various, including Hugh McManus

“A 10% decline in the market is fairly common—it happens about once a year. Investors who realize this are less likely to sell in a panic, and more likely to remain invested, benefiting from the wealth building power of stocks.” — Christopher Davis

“You make most of your money in a bear market, you just don’t realize it at the time.” — Shelby Cullom Davis

“A market downturn doesn’t bother us. It is an opportunity to increase our ownership of great companies with great management at good prices.” — Warren Buffett

““Is value investing dead? I don’t know. I don’t care. I don’t know when we will know. What I do know is that Warren Buffett says that growth investing and value investing are actually joined at the hip. (Tom O’Hara said this, too.) Valuation Investing is the blend of growth and value investing.” — Joel Greenblatt

Get Me Through December?

Eddy Elfenbein shared the unpleasantness update in this week’s Market Review at crossingwallstreet.com:

The numbers are remarkable. On Thursday, the S&P 500 closed at its lowest level in 15 months. In the last 12 trading sessions, the S&P 500 has lost 11.6%. The details are even uglier. Within the index, 423 stocks are now trading below their 200-day moving average. On Thursday, new lows beat new highs 175-0.

20 Years With The Value Line Arithmetic Average ($VLE). Some context. We’ve seen similar moments like this before. But there’s no denying that the December “candlestick” is in a league of its own … rare company. We’re approaching long-term “Oversold” conditions as suggested by the relative strength index (RSI) nearing 30 and relative long-term lows. We’re reminded that the trailing 52-week returns have dipped sub-zero a few times in the last few years — so this should not be regarded as something new or unusual.

Manifest Investing Median Return Forecast (MIPAR). It’s clear that the median (basically average) return forecast for the 2300-2400 companies in our coverage universe have SUDDENLY shifted to new levels due to the price drop. This could also happen from a breach of fundamentals — but that is NOT the case, here … at least not yet. Return forecasts are now at levels we haven’t seen since 2008-2009.

Source: https://www.morningstar.com/tools/market-fair-value-graph.html

Beyond December — A Hope For Fewer Potholes …

My take on all of this carnage? It’s different this time.

Yes, I said the words.

Bear markets and corrections are pretty unique despite all of our attempts to slap historical price chart overlays and compare factors, etc. The simple truth is that (1) the sample size will never be statistically sufficient for any material conclusions to be reached. [Yet the Rhinos will continue to try. Smile and nod at them.] (2) Markets are not rational.

Current conditions definitely qualify for a sedative or something stronger.

Look no further than the accompanying weekly chart of the Value Line Low Total Return Forecast to see how sudden the current price correction has been. We’ve not seen a change with this velocity or ferocity since 2008. You remember, right? With Christmas carols humming in the background, recall the names Bear Stearns, Lehman, Merrill Lynch and things like credit default swaps and neighbor’s houses in foreclosure.

Yes, there’s a mountain of uncertainty and an abyss of incivility inside the Beltway and a President who’s certainly disruptive. But the core problem with the status is virtually unchanged — ALL of the political posers persist in patching or ignoring potholes (healthcare, immigration, infrastructure, federal capital structure, failed nation building, sloped international trade playing fields, the ostriches and lobbyists related to real capital markets reform, etc.). The hypocrisy is gut wrenchingly prevalent.

I think the stock market is legitimately tired of the perpetual motion of Congressional Kick The Can Down The Road — and corporations are suddenly much more guarded about faith in consistency and less optimistic that the moving targets have abated. As the foot comes off the accelerator and taps the brakes (again) we might return to the recessionary conditions of 2015-2016. Much of the globe is already headed there.

Unattended potholes become sinkholes.

Like snowflakes, it’s different this time. It’s always different. Trying to allocate assets or imagine outcomes based on historical models (even when powered by artificial intelligence) is a neural niblick.

So we turn to a constant. A constant that survived and thrived through the 1970s, 1987, 1994, Y2K and the gasping throes of 2008-2009. That constant is to eschew the chaos. Focus on what matters. Simply put, INVEST BETTER.

We accept that markets are not rational. We refuse to be surprised when they convulse.

We take the words of Warren Buffett quite seriously when he longs for corrective opportunities “a few more times during his investing lifetime” and speaks unflinchingly of tracking excellent companies and waiting for them to be available at attractive prices.

I believe one of those moments may have arrived. We don’t often make “market calls” but we did write about back-up-the-truck moments back in November 2008 (a wee bit early) and March 2009 (squarely in the bullseye). This could be another Buffett Bonanza.

So … we think it’s prudent to do what we’ve done for DECADES. Discover excellent companies, BETTER COMPANIES. Buy those that are priced well. BETTER PRICES FOR BETTER RETURNS.

Hugh McManus likes patience and its genius-making potential. He also likes excellent companies trading near their 52-week or multi-year lows. We’re thinking Hugh must be beside his Irish self these days and hope to hear from him during next weekend’s Round Table. Ken Kavula is sure to be swimming in the pool of sudden small company opportunity. Cy Lynch is likely to admire the latest bear market which will become a future blip. Rest assured that we’ll be more focused on the long term perspective than any pusillanimous politicians and their potholes, meandering Rhinos or any of those annoying talking heads who focus on “how much your 401(k) LOST since breakfast today.”

We promise to remain focused on the discovery and sharing of the best ideas — the opportunities we’ve known for decades as BETTER COMPANIES at BETTER PRICES.

Merry Christmas to our favorite nation of focused and compassionate investors!

Best Small Companies (2019 Dashboard)

The status of the 2019 Best Small Companies can be tracked at: https://www.manifestinvesting.com/dashboards/public/best-small-2019

MANIFEST 40 Updates

  • 1. Apple (AAPL)
  • 23. Skyworks Solutions (SWKS)
  • 26. Intel (INTC)

Round Table Stocks

  • Apple (AAPL)
  • IPG Photonics (IPGP)
  • MKS Instruments (MKSI)
  • Skyworks Solutions (SWKS)
  • Universal Display (OLED)

Round Table Sessions (Video Archives)

Turnout Tuesday Educational Sessions

Results, Remarks & References

Companies of Interest: Value Line (12/28/2018)

The median Value Line low total return forecast for the companies in this week’s update batch is 12.3% vs. 10.8% for the Value Line 1700 ($VLE).

Materially Stronger: Vishay Intertechnology (VSH), Office Depot (ODP), Kemet (KEM)

Materially Weaker: TTM Technologies (TTMI), Diebold Nixdorf (DBD), Western Digital (WDC), Plantronics (PLT), STMicroelectronics (STM), Micron Technology (MU), Cirrus Logic (CRUS), Lattice Semiconductor (LSCC), Celestica (CLS), 3D Systems (DDD)

Discontinued: Spectra Energy Partners (SEP)

Market Barometers

The thing very few people tell you about “overvalued” markets is that, occasionally, the fundamentals arrive to justify them. — Joshua Brown

Value Line Low Total Return (VLLTR) Forecast. The long-term low total return forecast for the 1700 companies featured in the Value Line Investment Survey is 10.8%, increasing from 8.5% last week. For context, this indicator has ranged from low single digits (when stocks are generally overvalued) to approximately 20% when stocks are in the teeth of bear markets like 2008-2009.