This Week at MANIFEST (6/24/2016)

This Week at MANIFEST (6/24/2016)

“… it took me about 11 years to get a record deal, and I just had to work around and come to terms with the fact that what I was doing was going to be different, and I just had to wait until somebody was ready to jump on the bandwagon.” — Lee Ann Womack

What we do is different.

The modern investment club movement was a big tent … and a considerable bandwagon. Unfortunately, people’s capitalism and the stewardship of common stock OWNERSHIP has hit a bit of a speed bump, or worse. It’s pretty clear that some WD-40 is needed. The results achieved by the persistent are compelling. But too quiet.

What we do is different. We have no problem with things like discounted cash flow analysis — we believe that we’re chasing fewer variables and that SIMPLER is usually better when it comes to the realm of investing.

“Mathematics is ordinarily considered as producing precise and dependable results; but in the stock market the more elaborate and abstruse the mathematics the more uncertain and speculative are the conclusions we draw therefrom. In forty-four years of Wall Street experience and study I have never seen dependable calculations made about common-stock values, or related investment policies, that went beyond simple arithmetic or the most elementary algebra. Whenever calculus is brought in, or higher algebra, you could take it as a warning signal that the operator was trying to substitute theory for experience, and usually also to give to speculation the deceptive guise of investment.” — Benjamin Graham, The Intelligent Investor

Amidst the chaos, turbulence and avalanche of information, we find it rewarding and seemingly more reliable to focus on growth, profitability and valuation in a different kind of model. As is often the case, an event like last week’s Morningstar Investment Conference serves to remind about the value of being simple … and different.

The audience gasped when Keith Lee of Brown Capital Management confessed that in 25 years of successful investing that he’s never owned a financial sector stock. In his own words, Brown is “sector benchmark agnostic.” Brown Small Company (BCSIX) has a 10-year relative return of +5.7%.

Keith Lee and Brown Capital Management are different.

MANIFEST 40 Updates

  • 4. Fastenal (FAST)
  • 15. Procter & Gamble (PG)
  • 29. Home Depot (HD)
  • 33. Lowe’s (LOW)

Round Table Stocks: Chicago Bridge & Iron (CBI), Fastenal (FAST)

Results, Remarks & References

Companies of Interest: Value Line (6/24/2016)

The average Value Line low total return forecast for the companies in this week’s update batch is 4.8% vs. 5.6% for the Value Line 1700 ($VLE).

Normally we exclude (filter out) those companies with quality rankings less than 60. We left them in to make a point. When a bull market has been running for a while — and is perceived to be in jeopardy — investors and traders will flock to defensive stocks. The companies with high EPS stability and high quality will see their return forecasts driven down as they’re overbought if seen as sanctuaries. This week’s list and update batch is evidence of that.

There are a number of companies in the update batch that would be most welcome as core holdings in many of our portfolios including the likes of Bemis (BMS), Kimberly Clark (KMB), Sonoco (SON) … but the average MANIFEST Ranking for the Issue 6 companies is 44. In other words, the average company in this update is outranked by 56% of the companies in our database. The reason behind this is related to the flight to quality in many cases.

In most cases, it makes sense to wait for a Better Bandwagon.

Materially Stronger: Lumber Liquidators (LL), Martin Marietta (MLM), Tempur Sealy (TPX), Tile Shop (TTS) [Reminder: These step change upgrades do not necessarily imply a “buy” condition … in some cases, it’s a switch from “sell” to “weak hold.”]

Materially Weaker: Beazer Homes (BZH), Restoration Hardware (RH), Aegion (AEGN)

Discontinued: Jarden (JAH), Sun Edison (SUNE)

Coverage Initiated/Restored:

Market Barometers

Value Line Low Total Return (VLLTR) Forecast. The long-term low total return forecast for the 1700 companies featured in the Value Line Investment Survey is 5.6%, unchanged from 5.6% last week. For context, this indicator has ranged from low single digits (when stocks are generally overvalued) to approximately 20% when stocks are in the teeth of bear markets like 2008-2009.

Stocks to Study (6/24/2016)

  • Tractor Supply (TSCO) — Highest MANIFEST Rank
  • Sunpower (SPWR) — Highest Low Return Forecast (VL)
  • Restoration Hardware (RH) — Lowest P/FV (Morningstar)
  • Beazer Homes (BZH) —Lowest P/FV (S&P)
  • Sunpower (SPWR) — Best 1-Yr Outlook (ACE)
  • First Solar (FLSR) — Best 1-Yr Outlook (S&P)
  • Sunpower (SPWR) — Best 1-Yr Outlook (GS)

The Long & Short of This Week’s Update Batch

The Long & Short. (June 24, 2016) Projected Annual Return (PAR): Long term return forecast based on fundamental analysis and five year time horizon. Quality Ranking: Percentile ranking of composite that includes financial strength, earnings stability and relative growth & profitability. VL Low Total Return (VLLTR): Low total return forecast based on 3-5 year price targets via Value Line Investment Survey. Morningstar P/FV: Ratio of current price to fundamentally-based fair value via www.morningstar.com S&P P/FV: Current price-to-fair value ratio via Standard & Poor’s. 1-Year ACE Outlook: Total return forecast based on analyst consensus estimates for 1-year target price combined with current yield. The data is ranked (descending order) based on this criterion. 1-Year S&P Outlook: 1-year total return forecast based on S&P 1-year price target. 1-Yr “GS” Outlook: 1-year total return forecast based on most recent price target issued by Goldman Sachs.

Fastenal (FAST)

This profile displays how we build return forecasts and aggregate “opinions” for Fastenal, our 4th most widely-followed company by Manifest Investing subscribers.  For most portfolios (because most buy/hold/sell decisions should be influenced by impact on total portfolio) would perceive Fastenal as a “solid hold” under the present conditions and set of assumptions.  Start your FREE TEST DRIVE at http://www.manifestinvesting.com today.

There’s a reason that Fastenal (FAST) is the 4th most widely-followed stock by our community of investors. And as the time series graphic that we refer to as a “Chronicle” suggests — we noted some accumulation back when the stock price approached $35 and the long-term return forecast neared 15%. In case you’re wondering, “Yes, we liked Fastenal a lot nine months ago.” See: This Week at MANIFEST (9/25/2015) [Test drive or subscription required]

The accompanying banner (above) provides a parade of long-term and short-term opinions on FAST, sort of like a panel of Olympic judges. No, Virginia, the judges do not always agree and there’s usually a Simon Cowell in the mix.

  • MANIFEST PAR: PAR stands for Projected Annual Return, our 5-year time horizon total return (annualized price appreciation and average dividend yield) forecast. At 9.6%, it’s fairly solid, should be considered by most to be a “strong hold” and provides context. The average stock checks in at about 6.4% right now — so Fastenal is slightly better than average.
  • Quality Ranking: Scored index based on financial strength, earnings stability/consistency, relative growth and relative profitability versus competitors/peers. All companies are scored and ranked. Fastenal ranks in the top quintile (>80) and we consider the top quintile to be EXCELLENT.
  • MANIFEST Ranking: We believe that return forecast and quality are the two most important characteristics of any investment. This “score” or index is an equally rated percentile ranking of both factors. At 92, we believe that 8% of the companies in our coverage universe (approximately 190 companies) are more compelling right now than Fastenal.
  • Value Line (VL) Low Total Return Forecast (VLLTR): Based on the 3-5 year forecast published by the Value Line Investment Survey (9% at the time of publication for Fastenal), the figure shown here (7.4%) is adjusted for change in stock price and time horizon. The median VLLTR for the Value Line 1700 Standard Edition is currently 5.6%.
  • Morningstar P/FV: The price-to-fair value, based on analysis by Morningstar. A fairly valued stock = 100%. A P/FV less than 100% is potentially “on sale.” The average Morningstar P/FV right now is 99%.
  • S&P P/FV: The P/FV, based on analysis by Standard & Poor’s. The average S&P P/FV is 100%. S&P is the “least impressed” of our “Olympic judges” when it comes to Fastenal, at the present.
  • 1-Yr ACE Outlook: The first of our one year horizon forecasts — used for an indication of “real sentiment.” ACE stands for Analyst Consensus Estimate. This 1-year total return forecast is based on an aggregate of covering analysts for the various companies. The average 1-Yr ACE forecast is currently 14.3%.
  • 1-Yr S&P Outlook: The one year total return forecast from S&P. The average S&P 1-year forecast is currently 7.0%.
  • 1-Yr GS Outlook: GS = Goldman Sachs, singled out as one of the most influential opinions (and sentiment drivers) in the world of investing. The average Goldman Sachs 1-year total return forecast is currently 7.3%. I’m surprised that Goldman does not cover Fastenal, hence the blank entry.

Business Model Analysis: 9-12% Return Forecast

Morningstar Conference (2016)

Morningstar Investment Conference (2016)

“I see investing as the responsible act of the broad middle class, yet there’s still so many people we don’t touch today.” — Don Phillips, Morningstar

The annual shareholder meeting of Berkshire Hathaway has been called the Woodstock of capitalism, drawing tens of thousands of investors from all over the world.

I think the Morningstar Investment Conference might be “bigger” than the annual pilgrimage to Omaha.

Really? Yes, really. On a per capita basis, comparing the number of investors in Omaha versus the over 2000 advisors and practitioners in Chicago, the Morningstar Investment Conference, or #MICUS, might be a bigger “show.” Before you scoff, consider the population of registered advisors and representatives vs. how many attend. Morningstar puts on an effective event and while you’re scratching your head over the per capita comparison, don’t forget there’s an admission price for the Chicago program.

Make no mistake. Don Phillips and the Morningstar gang throw one heckuva party. We’re reminded about rampant fallacies with respect to passive vs. active investing, a growing discovery and emphasis on sustainability, the mistaken generalizations about advisors vs. registered reps, the new DOL fiduciary regulations and a litany of topics worthy of consideration and discussion.

  • “Supporting responsible investing is actually more closely related to behavior modification.” — Don Phillips
  • We’ve been fans of the Morningstar MOAT Fund for some time. Microsoft’s acquisition of LinkedIn (LNKD) provides quite a boost to the fund’s value in recent days. The merits of LinkedIn — and investment thesis — were covered by Morningstar’s Elizabeth Collins during an early panel session.
  • Best Ideas: Biogen (BIIB) and Williams-Sonoma (WSM). (Elizabeth Collins)
  • “Global growth over last four years has been slower … but it’s actually closer to long-term norms.” Prevalent themes: persistent strong U.S. dollar, U.S. treasury yields not justified and some scattered opportunities in emerging markets. (Michael Hasenstab, Franklin Templeton)
  • “Investors should not use a shot gun approach with respect to emerging markets. Use a rifle instead.” (Hasenstab)
  • Reminiscent of a couple of previous Morningstar conferences, Bill Bernstein served as this year’s “Grumpy Old Man” but he seems to agree with many of us on many issues. But he’s a delightful curmudgeon.
  • “The case for index and passive investing has been dramatically overstated.” (Phillips)
  • “Alternative funds are not an investment. They are a compensation scheme.” (Bernstein) [Told you …]
  • What hasn’t been overstated? The cleavage between high-cost and low-cost. (Phillips, Bernstein)
  • “I pride myself on not knowing what stocks are in my portfolios. I’m a Quant.” (Cliff Asness, AQR)
  • I respect and enjoy the work of Rob Arnott (Research Affiliates) and Cliff Asness (AQR). But watching them debate like sumo wrestlers trying to give each other a wedgie in a cage match on the head of a pin is not my favorite post-breakfast activity. I’m glad they believe in “Tin Cup”, grant permission for us to “sin a little” with asset allocation and speculation and I now have a greater appreciation for Smart/Strategic Beta and I’m thankful that at it’s core — we have been doing a lot of the factor-based opportunity stuff for a long time. But most of all, I’m grateful for the elegant simplicity of our methods. It’s a powerful reminder about Occam’s Razor.

(Continuing with our regularly scheduled programming and weekly update …)

MANIFEST 40 Updates

  • 9. Cisco Systems (CSCO)
  • 10. Qualcomm (QCOM)
  • 12. Walgreen Boots (WBA)
  • 37. CVS Health (CVS)
  • 40. LKQ Corp (LKQ)

Round Table Stocks: Cisco Systems (CSCO), CVS Health (CVS), Gentex (GNTX), Inteliquent (IQNT), ITC Holdings (ITC), LKQ Corp (LKQ), Neustar (NSR), Qualcomm (QCOM), Synaptics (SYNA)

Results, Remarks & References

Companies of Interest: Value Line (6/17/2016)

The average Value Line low total return forecast for the companies in this week’s update batch is 5.6% vs. 5.5% for the Value Line 1700 ($VLE).

Materially Stronger: Infinera (INFN), Drew Industries (DW)

Materially Weaker: American Movil (AMX), Synaptics (SYNA), Titan (TWI), Dish Network (DISH)

Discontinued: Time Warner Cable (TWC), Cleco (CNL), Fuel Systems Solutions (FSYS)

Coverage Initiated/Restored:

Market Barometers

Value Line Low Total Return (VLLTR) Forecast. The long-term low total return forecast for the 1700 companies featured in the Value Line Investment Survey is 5.6%, unchanged from 5.6% last week. For context, this indicator has ranged from low single digits (when stocks are generally overvalued) to approximately 20% when stocks are in the teeth of bear markets like 2008-2009.

Breaking.

Guggenheim has reinstated the S&P Small- and Mid-Cap equally-weighted funds: EWSC and EWMC

For a complete list of Guggenheim ETFs, see:

http://gi.guggenheiminvestments.com/products

Market Barometers (Continued)

In honor of this week’s Morningstar Investment Conference in Chicago, their weekly determination of stock prices in general vs. the “fair value” for the overall stock market.

Mstar market fair value 20160615

Stocks to Study (6/17/2016)

  • LKQ Corp (LKQ) — Highest MANIFEST Rank
  • Neustar (NSR) — Highest Low Return Forecast (VL)
  • Borg Warner (BWA) — Lowest P/FV (Morningstar)
  • Arris Group (ARRS) —Lowest P/FV (S&P)
  • China Auto Systems (CAAS) — Best 1-Yr Outlook (ACE)
  • Juniper Networks (JNPR) — Best 1-Yr Outlook (S&P)
  • Verifone Systems (PAY) — Best 1-Yr Outlook (GS)

The Long & Short of This Week’s Update Batch

The Long & Short. (June 17, 2016) Projected Annual Return (PAR): Long term return forecast based on fundamental analysis and five year time horizon. Quality Ranking: Percentile ranking of composite that includes financial strength, earnings stability and relative growth & profitability. VL Low Total Return (VLLTR): Low total return forecast based on 3-5 year price targets via Value Line Investment Survey. Morningstar P/FV: Ratio of current price to fundamentally-based fair value via www.morningstar.com S&P P/FV: Current price-to-fair value ratio via Standard & Poor’s. 1-Year ACE Outlook: Total return forecast based on analyst consensus estimates for 1-year target price combined with current yield. The data is ranked (descending order) based on this criterion. 1-Year S&P Outlook: 1-year total return forecast based on S&P 1-year price target. 1-Yr “GS” Outlook: 1-year total return forecast based on most recent price target issued by Goldman Sachs.

Fave Five (6/17/2016)

Fave Five (6/17/2016)

Our Fave Five essentially represents a listing of stocks with favorable short term total return forecasts (1 year, according to Analyst Consensus Estimates, or ACE) combined with strong long-term return forecasts and good/excellent quality rankings.

The Fave Five This Week

  • Aaron’s (AAN)
  • Shire plc (SHPG)
  • Simulations Plus (SLP)
  • Synaptics (SYNA)
  • Under Armour (UA)

Context: The median 1-year total return forecast (via ACE) for the Value Line 1700 is 10.5%. The median 5-year return forecast for $VLE is 5.5% (annualized).

The Long and Short of This Week’s Fave Five

The Long & Short. (June 17, 2016) Projected Annual Return (PAR): Long term return forecast based on fundamental analysis and five year time horizon. Quality Ranking: Percentile ranking of composite that includes financial strength, earnings stability and relative growth & profitability. VL Low Total Return (VLLTR): Low total return forecast based on 3-5 year price targets via Value Line Investment Survey. Morningstar P/FV: Ratio of current price to fundamentally-based fair value via www.morningstar.com S&P P/FV: Current price-to-fair value ratio via Standard & Poor’s. 1-Year ACE Outlook: Total return forecast based on analyst consensus estimates for 1-year target price combined with current yield. The data is ranked (descending order) based on this criterion. 1-Year S&P Outlook: 1-year total return forecast based on S&P 1-year price target. 1-Yr GS: 1-year total return forecast based on most recent price target issued by Goldman Sachs.

Weekend Warriors

The relative return for the Weekend Warrior tracking portfolio is -0.3% since inception. 48.9% of selections have outperformed the Wilshire 5000 since original selection.

Tracking Dashboard: https://www.manifestinvesting.com/dashboards/public/weekend-warriors

The position in Comtech Telecommunications (CMTL) was closed on a drop to -20% relative return this week.

Cmtl warriors transaction 20160613

We do have a few companies nearing the “hot seat” for the right reasons — prices up, return forecast approaching the average forecast (MIPAR).

Warrior dash 20160617

Fave Five (6/10/2016)

Fave Five (6/10/2016)

Our Fave Five essentially represents a listing of stocks with favorable short term total return forecasts (1 year, according to Analyst Consensus Estimates, or ACE) combined with strong long-term return forecasts and good/excellent quality rankings.

The Fave Five This Week

  • Aaron’s (AAN)
  • Biogen (BIIB)
  • Inteliquent (IQNT)
  • Simulations Plus (SLP)
  • Under Armour (UA)

Context: The median 1-year total return forecast (via ACE) for the Value Line 1700 is 10.4%. The median 5-year return forecast for $VLE is 6.4% (annualized).

The Long and Short of This Week’s Fave Five

The Long & Short. (June 10, 2016) Projected Annual Return (PAR): Long term return forecast based on fundamental analysis and five year time horizon. Quality Ranking: Percentile ranking of composite that includes financial strength, earnings stability and relative growth & profitability. VL Low Total Return (VLLTR): Low total return forecast based on 3-5 year price targets via Value Line Investment Survey. Morningstar P/FV: Ratio of current price to fundamentally-based fair value via www.morningstar.com S&P P/FV: Current price-to-fair value ratio via Standard & Poor’s. 1-Year ACE Outlook: Total return forecast based on analyst consensus estimates for 1-year target price combined with current yield. The data is ranked (descending order) based on this criterion. 1-Year S&P Outlook: 1-year total return forecast based on S&P 1-year price target. 1-Yr GS: 1-year total return forecast based on most recent price target issued by Goldman Sachs.

Weekend Warriors

The relative return for the Weekend Warrior tracking portfolio is +6.7% since inception. 66.0% of selections have outperformed the Wilshire 5000 since original selection.

Tracking Dashboard: https://www.manifestinvesting.com/dashboards/public/weekend-warriors

Morningstar Fair Value Screen

Screening Results (June 2016)

Best Prices Vs. Fair Value: Morningstar

by Mark Robertson

Is the market cheap or expensive? We don’t really pay much attention to this, instead rendering that same opinion on a stock-by-stock basis as we hunt for quality companies at bargain prices. This month, we display a baker’s dozen of good/excellent quality companies with the lowest price-to-fair value ratios in the Morningstar coverage universe.

Good or Excellent — At A Discount

The only exception is Fiat Chrysler (FCAU) because this one is very close to home. The low quality may be off set by a continuing strong vehicle market where the sale of Jeeps and minivans continues to persist. The other potential is a buyout by Volkswagen or some other multi-national entrant and Morningstar’s red tag sale (46%) on Chrysler is echoed by the likes of ACE, S&P and Goldman Sachs.

There are a number of retailers that have hammered into red tag status by stock shoppers over the last few months. Swatch (SWGAY) is relatively uncovered and worth a closer look for many of the same reasons. Recent selections Allergan (AGN), Gilead (GILD), Polaris (PII) and Skyworks (SWKS) continue to be worthy study. Take a Bayer (BAYRY) and call your broker in the morning.

Morningstar P/FV Study Candidates. (June 6, 2016) The companies displayed are ranked by Price/Fair Value (Ascending). Projected Annual Return (PAR): Consensus based return forecast based on 5-year time horizon. Quality Ranking: Percentile ranking of composite that includes financial strength, earnings stability and relative growth & profitability. Value Line Low Total Return (VLLTR) Forecast: Total Return based on low price forecast for 3-5 year time horizon. Morningstar Fair Value: Estimated price of stock, based on discounted cash flow, that would fully reflect all assumptions about enterprise value. Morning Stars: Based predominantly on return forecast, stocks are rated from 1-to-5 Stars (high returns). S&P P/V: Standard & Poor’s price-to-fair value. ACE: Analyst consensus estimates. GS: Goldman Sachs, 1-year price targets based on most recent research. Sources: Value Line Investment Survey, Morningstar, S&P Capital IQ, finance.yahoo.com, Manifest Investing

Fave Five (6/3/2016)

Fave Five (6/3/2016)

Our Fave Five essentially represents a listing of stocks with favorable short term total return forecasts (1 year, according to Analyst Consensus Estimates, or ACE) combined with strong long-term return forecasts and good/excellent quality rankings.

The Fave Five This Week

  • Aaron’s (AAN)
  • Ensign Group (ENSG)
  • Gentherm (THRM)
  • Simulations Plus (SLP)
  • Under Armour (UA)

Context: The median 1-year total return forecast (via ACE) for the Value Line 1700 is 10.4%. The median 5-year return forecast for $VLE is 6.4% (annualized).

The Long and Short of This Week’s Fave Five

The Long & Short. (June 3, 2016) Projected Annual Return (PAR): Long term return forecast based on fundamental analysis and five year time horizon. Quality Ranking: Percentile ranking of composite that includes financial strength, earnings stability and relative growth & profitability. VL Low Total Return (VLLTR): Low total return forecast based on 3-5 year price targets via Value Line Investment Survey. Morningstar P/FV: Ratio of current price to fundamentally-based fair value via www.morningstar.com S&P P/FV: Current price-to-fair value ratio via Standard & Poor’s. 1-Year ACE Outlook: Total return forecast based on analyst consensus estimates for 1-year target price combined with current yield. The data is ranked (descending order) based on this criterion. 1-Year S&P Outlook: 1-year total return forecast based on S&P 1-year price target. 1-Yr GS: 1-year total return forecast based on most recent price target issued by Goldman Sachs.

Weekend Warriors

The relative return for the Weekend Warrior tracking portfolio is +6.7% since inception. 66.0% of selections have outperformed the Wilshire 5000 since original selection.

Tracking Dashboard: https://www.manifestinvesting.com/dashboards/public/weekend-warriors

Fave Five (5/27/2016)

Our five Stocks to Study include four repeat appearances and one newcomer: Computer Programs & Systems (CPSI)

Fave Five (5/27/2016)

Our Fave Five essentially represents a listing of stocks with favorable short term total return forecasts (1 year, according to Analyst Consensus Estimates, or ACE) combined with strong long-term return forecasts and good/excellent quality rankings.

The Fave Five This Week

  • Aaron’s (AAN)
  • Computer Programs (CPSI)
  • Ensign Group (ENSG)
  • Simulations Plus (SLP)
  • Under Armour “C” (UA-C)

Context: The median 1-year total return forecast (via ACE) for the Value Line 1700 is 10.4%. The median 5-year return forecast (MIPAR) is 6.5% (annualized).

The Long and Short of This Week’s Fave Five

The Long & Short.(May 27, 2016)Projected Annual Return (PAR): Long term return forecast based on fundamental analysis and five year time horizon. Quality Ranking: Percentile ranking of composite that includes financial strength, earnings stability and relative growth & profitability. VL Low Total Return (VLLTR): Low total return forecast based on 3-5 year price targets via Value Line Investment Survey.Morningstar P/FV: Ratio of current price to fundamentally-based fair value via www.morningstar.comS&P P/FV: Current price-to-fair value ratio via Standard & Poor’s. 1-Year ACE Outlook: Total return forecast based on analyst consensus estimates for 1-year target price combined with current yield. The data is ranked (descending order) based on this criterion. 1-Year S&P Outlook: 1-year total return forecast based on S&P 1-year price target. 1-Yr GS: 1-year total return forecast based on most recent price target issued by Goldman Sachs.

Weekend Warriors

The relative return for the Weekend Warrior tracking portfolio is +8.3% since inception. 63.8% of selections have outperformed the Wilshire 5000 since original selection.

Tracking Dashboard: https://www.manifestinvesting.com/dashboards/public/weekend-warriors

Closed Position

The position in Nordstrom (JWN) was closed as the relative return dipped to -20%. (I was cheering for a recovery here)

Jwn fave 5 close 20160512

Gone RuleBreaker Shopping!


This month’s tracking portfolio, David Gardner’s Stock Advisors Rule Breakers, monitors the progress made over the last 14 years.

It’s a dashboard that the Plungers Investment Club would love. (At least for the non-core and adventure component of their holdings.) This month’s tracking portfolio, David Gardner’s Stock Advisors Rule Breakers, monitors the progress made over the last 14 years. We place $100 into each selection/decision and track the progress of that $100 investment over time.

Paths to Super Investor Returns?

The active positions in the RuleBreaker with the highest return forecasts are featured in the accompanying dashboard excerpt. Rule Breakers focuses primarily on underappreciated growth stocks with solid management and a sustainable business strategy. This time-tested approach works. In fact, the Motley Fool Rule Breakers have consistently been among the leaders of Hulbert Financial’s rankings of 5-year performance. The media has taken notice as well with the Wall Street Journal previously calling Rule Breakers manager David Gardner one of the best stock pickers on Earth.

Our cover story review this month documented a 15.1% absolute return over the trailing 14 years — excess relative return of +7.2% over the Wilshire 5000. These results were achieved with a few roller coaster stocks like Amazon, Apple, Priceline.com, Activision Blizzard and Netflix. All of these stocks will have their speed bump moments.

The consensus forecasts in the dashboards may or may not resemble the expectations built by David and the Rulebreaker team of analysts. Tracking portfolio companies that David would deem worthy of study right now include: Illumina (ILMN), Texas Roadhouse (TXRH), Activision Blizzard (ATVI), McCormick & Co. (MKC), Amazon.com (AMZN), Apple (AAPL), Gilead Sciences (GILD) and Disney (Walt) (DIS).

Restoration Hardware (RH) is down 59.4% since selection back on 3/20/15. Do the fundamentals support a closer look? A strengthening economy could provide some bolstering as home repairs mend. The generic pharmaceuticals have been solid and Mylan Labs (MYL) has been on the radar for years. We featured Boston Beer (SAM) recently in the Fave Five and long-time Rulebreaker favorites like Apple, Gilead Sciences, Priceline.com and Amazon have returned to the sweet spot with return forecasts likely to place them in the buy zone. PayPal (PYPL) was recently featured by Kim Butcher during a Round Table session and Starbucks (SBUX) can be a jolt. There’s much to study here. Break at will.

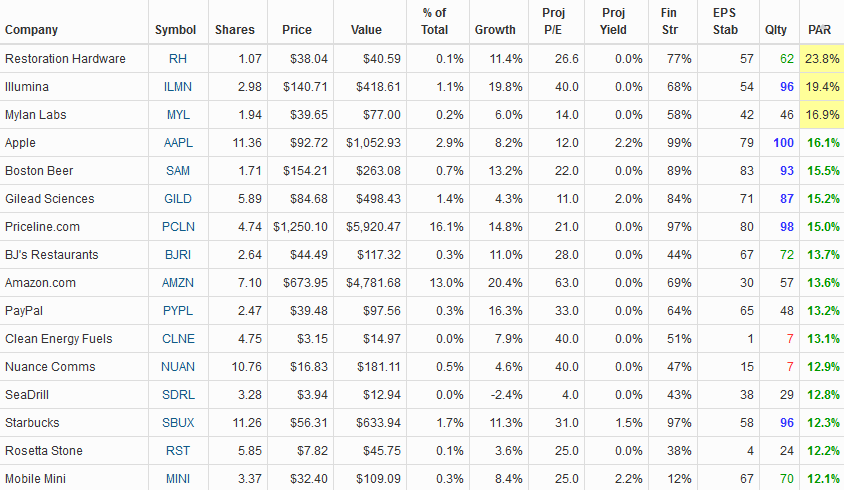
Stock Advisor Rule Breakers. Based on the flagship Motley Fool newsletter, $100 is invested into mentioned companies. The top 16 (by PAR) is shown here. The 14-year annualized rate of return is 15.1%. Source: http://www.fool.com, Stock Advisor


Mark Robertson is founder and managing partner of Manifest Investing, a source for research and portfolio management for long term investors. Fool on!

Decidedly Older Stocks to Study

This Week at MANIFEST (5/27/2016)

“Decidedly older.” (Women)

The scene was the Better Investing national convention last weekend in Chantilly, Virginia. It was the last session of the conference. The words rang out during Ken Kavula’s presentation of Ulta Salons (ULTA) as his shared stock idea for the May Round Table. He was — of course — talking about the differential between his teenage granddaughters and some of the “more experienced” clientele that may linger longer in the salon portion of the establishment. Sitting directly on Ken’s right (and within elbowing distance) frequent guest damsel Kim Butcher reacted immediately. “Decidedly older??? I’m fairly certain, Ken, that NONE of us ever want to be referred to as ‘decidedly older’ [Ken was probably grateful that his spouse, Natalie, was not in the room, too.]” The audience roared a second.

“Women, traditionally, become the subjects and objects of other people’s lives.” — Jane Fonda

And for that, we’re infinitely thankful.

Those words are from a TedX speech by Jane Fonda, delivered back in 2011 on the subject of “Life’s Third Act.” It features a perspective on longevity, aging and the shift to living longer and contributing more substantially during our last 30 years on the planet. If you liked Jane in her role on The Newsroom, you’ll probably like these 10-12 minutes via TedX.

The audience at the BI national convention is still not getting younger from a demographics perspective. That said, I’d argue that the shift described by Fonda has been a work in progress for some time and that investment clubs and individual investors have indeed been transforming for a few years. We’re witnessing the transformation of rote methods into deeper understanding and in so many cases, pervasive market beating performance over decades. The Super Investor session that I delivered in Chantilly (Beltway Super Investors) featuring Eddy Elfenbein, David Gardner and a slipstream sample of investment club leaders was very well received and we’ll do more.

Ken and I (and many of you) make “coaching club visits” to a fairly large number of clubs. We’ve witnessed an evolutionary shift. Few clubs make some of the traditional mistakes and the portfolios we see are better designed, better positioned and better maintained. So many clubs embrace our efforts at interpretation, innovation and implementation of the delightfully few things that really matter and we’re grateful for this evolving simplicity … and the results we observe.

During a few moments with some decidedly experienced investors in Chantilly, we were encouraged to keep seeking the foundations of Nicholson’s vision. Some observed that the Nicholson moments we reinforced back at the national convention in Chicago a few years were landmark. And most welcome. We were encouraged to do more. A dear friend who knew Nicholson well urged us to continue to re-discover and reinforce … Press on.

The modern investment club movement is less obvious at a time when it’s probably needed the most. Diebold is back to 98% institutional ownership from the 54% it achieved less than ten years ago. It’s enormously challenging to engage the interest of most people, most young people, and even most decidedly older people in ownership of individual common stocks. (By the way, RPM presented at the conference and appears to be stronger than ever)

I think Jane Fonda is right, an opportunity lies ahead. In her words (with a dash of paraphrasing) …

“Circle back to where we started — and know it for the first time. We could be a necessary cultural shift in the world.”

Inspire younger generations to optimize and maximize their investing experience.

Be decidedly older. Do it well.

MANIFEST 40 Updates

  • 11. FactSet Research (FDS)
  • 30. Starbucks (SBUX)
  • 32. Buffalo Wild Wings (BWLD)

Round Table Stocks: Buffalo Wild Wings (BWLD), C.H. Robinson (CHRW), Copa Holdings (CPA), Forward Air (FWRD), Knight Transportation (KNX), Maximus (MMS), McDonald’s (MCD), Panera Bread (PNRA), S&P Global (SPGI), Stericycle (SRCL), Waste Connections (WCN)

Results, Remarks & References

Companies of Interest: Value Line (5/27/2016)

The average Value Line low total return forecast for the companies in this week’s update batch is 6.3% vs. 5.6% for the Value Line 1700 ($VLE).

Materially Stronger: Iron Mountain (IRM), Texas Roadhouse (TXRH), Sonic (SONC), Forrester Research (FORR), Equifax (EFX), Darden Restaurants (DRI), Domino’s Pizza (DPZ)

Materially Weaker: Teekay (TK), Frontline (FRO), Calgon Carbon (CCC), American Railcar (ARII)

Discontinued:

Coverage Initiated/Restored:

Market Barometers

Value Line Low Total Return (VLLTR) Forecast. The long-term low total return forecast for the 1700 companies featured in the Value Line Investment Survey is 5.6%, unchanged from last week. For context, this indicator has ranged from low single digits (when stocks are generally overvalued) to approximately 20% when stocks are in the teeth of bear markets like 2008-2009.

Stocks to Study (5/27/2016)

  • Maximus (MMS) — Highest MANIFEST Rank
  • Ruby Tuesday (RT) — Highest Low Return Forecast (VL)
  • Stericycle (SRCL) — Lowest P/FV (Morningstar)
  • Delta Airlines (DAL) —Lowest P/FV (S&P)
  • Golar LNG (GLNG) — Best 1-Yr Outlook (ACE)
  • Delta Airlines (DAL) — Best 1-Yr Outlook (S&P)
  • Buffalo Wild Wings (BWLD) — Best 1-Yr Outlook (GS)

The Long & Short of This Week’s Update Batch

The Long & Short. (May 27, 2016) Projected Annual Return (PAR): Long term return forecast based on fundamental analysis and five year time horizon. Quality Ranking: Percentile ranking of composite that includes financial strength, earnings stability and relative growth & profitability. VL Low Total Return (VLLTR): Low total return forecast based on 3-5 year price targets via Value Line Investment Survey. Morningstar P/FV: Ratio of current price to fundamentally-based fair value via www.morningstar.com S&P P/FV: Current price-to-fair value ratio via Standard & Poor’s. 1-Year ACE Outlook: Total return forecast based on analyst consensus estimates for 1-year target price combined with current yield. The data is ranked (descending order) based on this criterion. 1-Year S&P Outlook: 1-year total return forecast based on S&P 1-year price target. 1-Yr “GS” Outlook: 1-year total return forecast based on most recent price target issued by Goldman Sachs.