![]()
Fave Five (3/3/2017)
Our Fave Five essentially represents a listing of stocks with favorable short term total return forecasts (1 year, according to Analyst Consensus Estimates, or ACE) combined with strong long-term return forecasts and good/excellent quality rankings. The average 1-year ACE total return forecast is 6.9%.
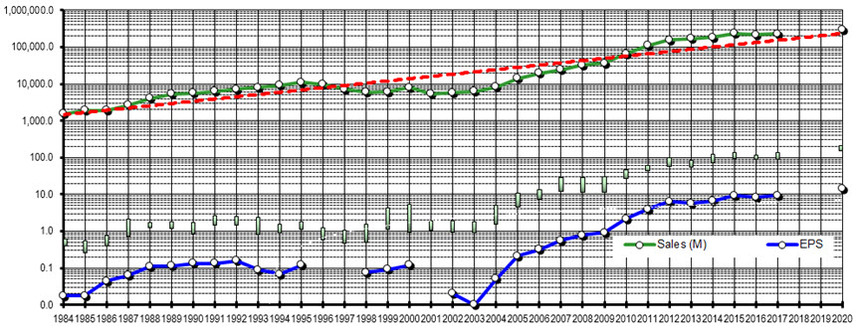
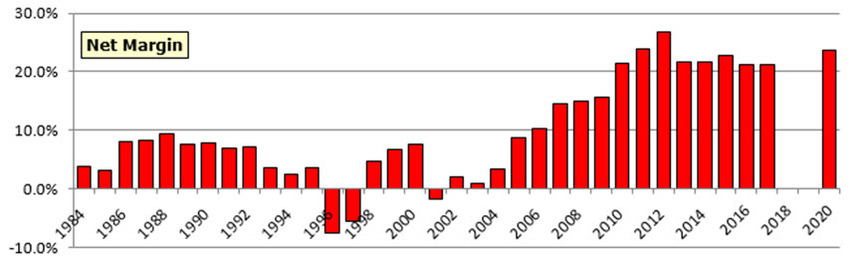
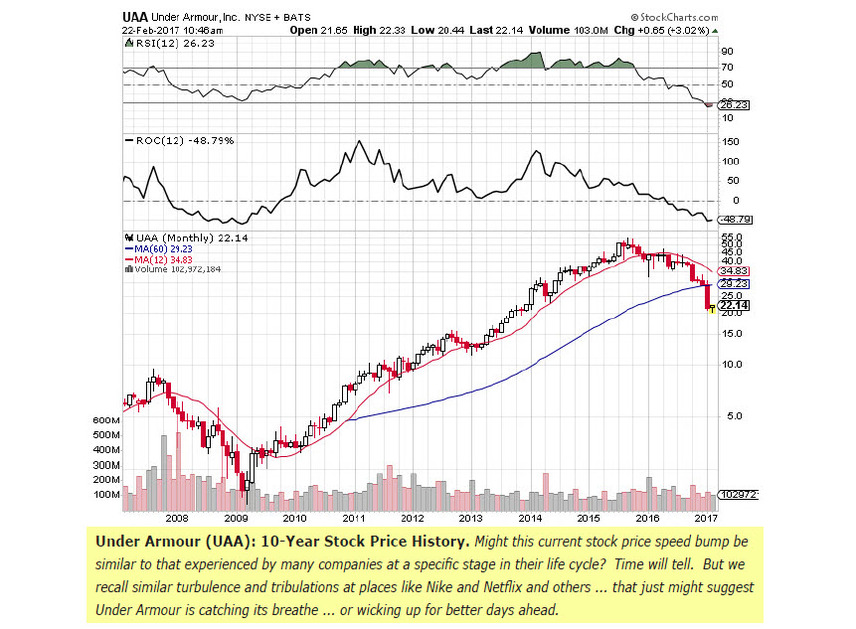
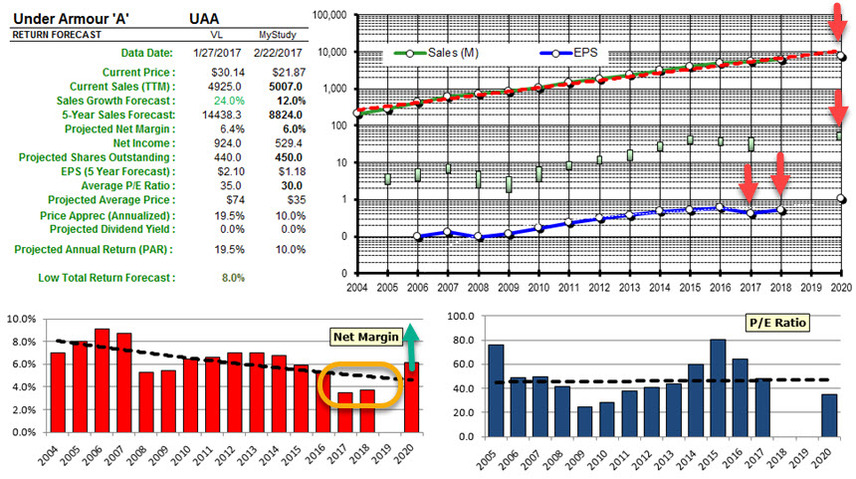
This week we return to the triple play screening method for our five favorites. The triple play possibility occurs when you find a stock that is very depressed in price and also appears to be on the verge of substantially boosting its profit margins. The triple play effect is possible in that:
(1) The depressed price of the stock can return to normal levels;
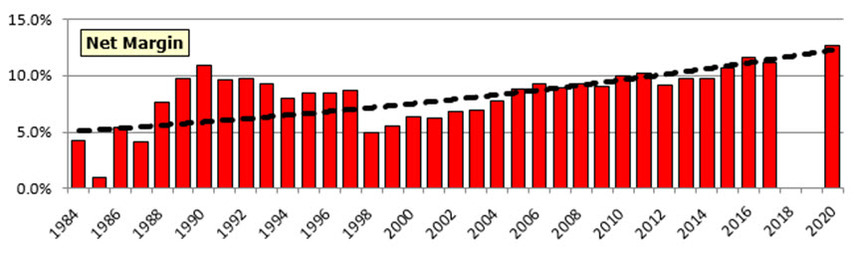
(2) increased profit margins can produce increased EPS and a higher price;
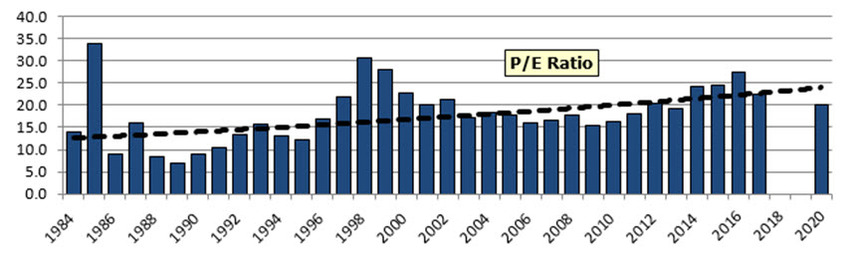
(3) may also cause higher P/E ratios, or P/E expansion.
The Fave Five This Week
- Abbvie (ABBV)
- CVS Health (CVS)
- Infosys Tech (INFY)
- Polaris (PII)
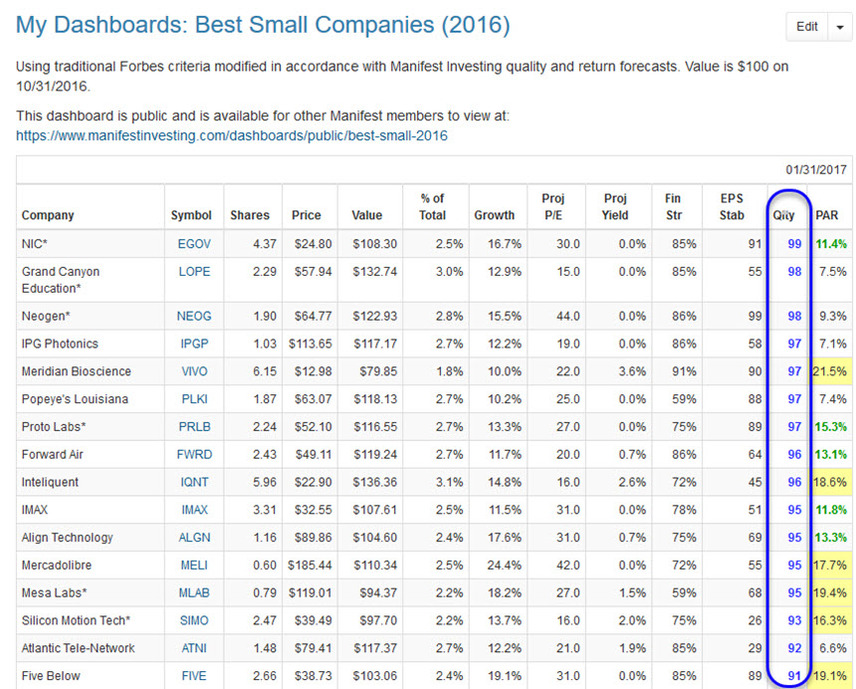
- Proto Labs (PRLB)
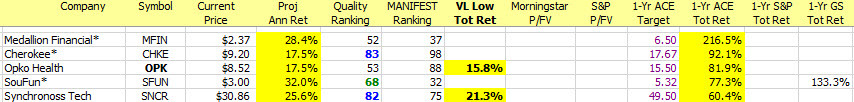
The Long and Short of This Week’s Fave Five
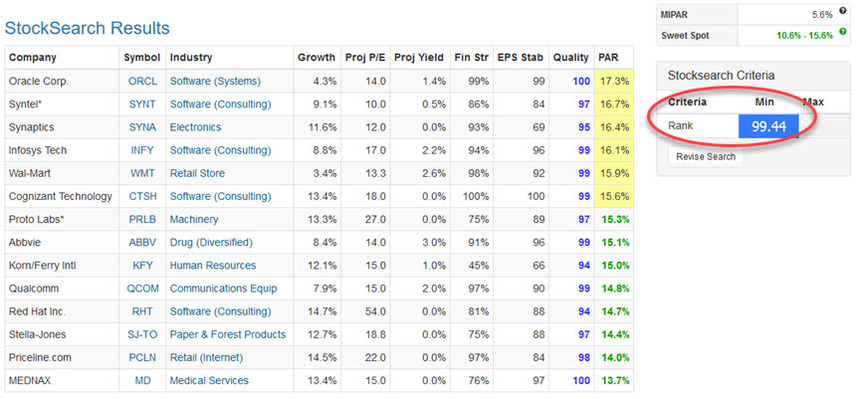
The Long & Short. (March 3, 2017) Projected Annual Return (PAR): Long term return forecast based on fundamental analysis and five year time horizon. Quality Ranking: Percentile ranking of composite that includes financial strength, earnings stability and relative growth & profitability. VL Low Total Return (VLLTR): Low total return forecast based on 3-5 year price targets via Value Line Investment Survey. Morningstar P/FV: Ratio of current price to fundamentally-based fair value via www.morningstar.com S&P P/FV: Current price-to-fair value ratio via Standard & Poor’s. 1-Year ACE Outlook: Total return forecast based on analyst consensus estimates for 1-year target price combined with current yield. The data is ranked (descending order) based on this criterion. 1-Year S&P Outlook: 1-year total return forecast based on S&P 1-year price target. 1-Yr GS: 1-year total return forecast based on most recent price target issued by Goldman Sachs.
Fave Five Legacy (Tracking Portfolio)
The relative/excess return for the Fave Five tracking portfolio is +0.3% since inception. 53.1% of selections have outperformed the Wilshire 5000 since original selection.
Tracking Dashboard: https://www.manifestinvesting.com/dashboards/public/fave-five