This Week at MANIFEST (3/10/2017)
Common Sense, Care Of Catoosa
“If you want to be successful, it’s just this simple. Know what you are doing. Love what you are doing. And believe in what you are doing.” — Will Rogers
No, I haven’t forgotten that the trucking and logistics stocks are in Issue 2 and that this week’s update centers on Issue 4 — home to many healthcare and aerospace/defense stocks.
It’s just that a significant number of hours sharing lanes with Knight Transportation, Swift, Old Dominion and a number of CVS Health semis provides some time for pondering while en route on Route 66 to the Port of Catoosa. (Tulsa)
Ken Kavula and I were met in Catoosa by a throng of committed long term investors and we greatly enjoyed spending the weekend with them. Ken did his travel research on the Issue 1 airlines and perhaps he can explain Buffett’s sudden interest in the group, but that’s a topic for another day. Probably.

We took a stroll through 70 years of investing better — together. Some rules and guidelines were reinforced. Others were disturbingly challenged. We were reminded how the Tin Cup model portfolio handled the 2007-2008 market challenge and wondered why we spend so much time worrying about asset allocation (shifting to cash equivalents when the market seems overpriced.) Our subscribers fondly remember our 2008 open letter to the Presidential candidates: An Open Letter To The President.
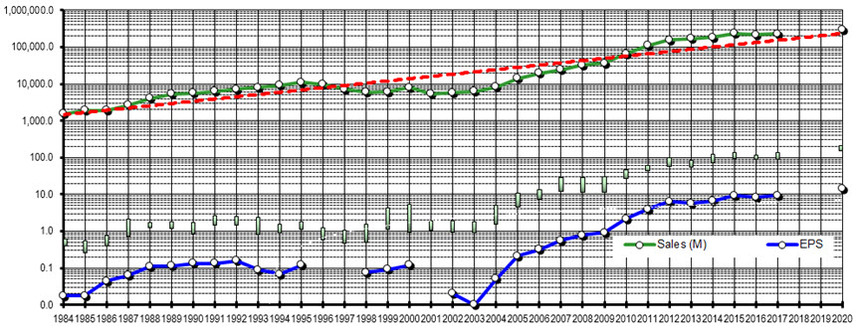
Is the market over priced? What if it’s not? Recall those surging estimates for S&P 500 earnings from the analysts a few weeks ago. If they’re right about 2018, 2019 and beyond …
If the accompanying chart isn’t “haunting” or reinforcing — it probably ought to be.
And in that spirit, we think it probably makes sense to keep doing what we always do … INVEST IN THE BEST, but only when they’re on sale. We’ve never seen a moment where we couldn’t find several worthy stocks. If we ever do, we’ll start worrying about electric fences.
“With a sufficiently long term perspective, bear markets become blips.” — Cy Lynch
Thanks, Catoosa.

MANIFEST 40 Updates
- Amgen (AMGN)
- Cerner (CERN)
- Computer Programs (CPSI)
- MEDNAX (MD)
- Quality Systems (QSII)
- Techne (TECH)
- United Therapeutics (UTHR)
(None)
Results, Remarks & References
- The Best of Charlie Munger (Morgan Housel via ValuePlays)
- Berkshire Hathaway: Annual Report and Shareholder Letter (Warren Buffett)
- Berkshire Tidbits on Buybacks, Bank of America & Expense Ratios (Seeking Alpha)
- Eight Years Ago Today (Josh Brown, 3/6/2017)
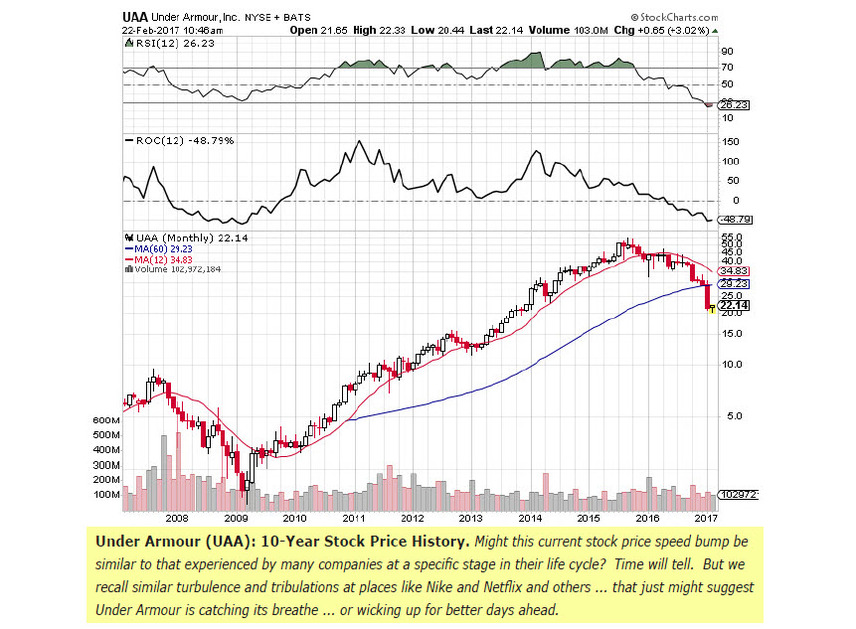
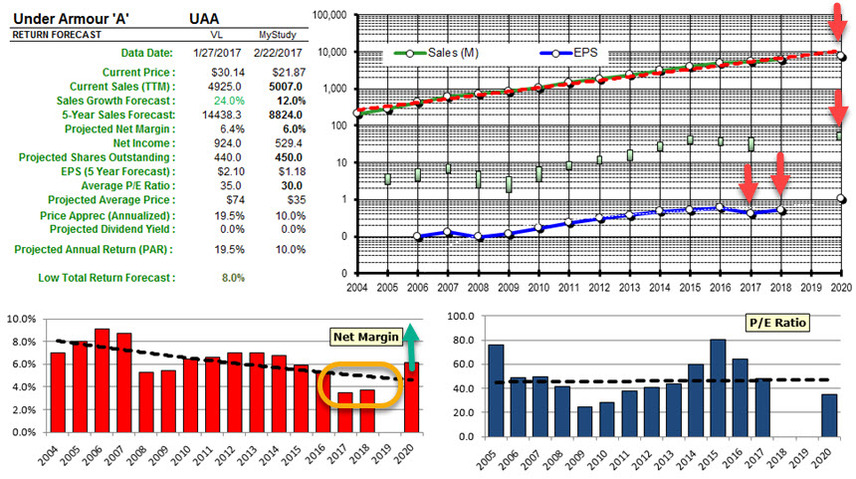
- Three Reasons Nike Is Hot And Under Armour Is Not (Brian Sozzi)
Companies of Interest: Value Line (3/10/2017)
The average Value Line low total return forecast for the companies in this week’s update batch is 1.9% vs. 2.9% for the Value Line 1700 ($VLE).

Materially Stronger: Community Health (CYH), Regeneron Pharma (REGN), Illinois Tool Works (ITW), Anthem (ANTM), Envision Health (EVHC)
Materially Weaker: Tenet Healthcare (THC), Quality Systems (QSII)
Discontinued: Clarcor (CLC), Tessera Tech (TSRA)
Market Barometers
Value Line Low Total Return (VLLTR) Forecast. The long-term low total return forecast for the 1700 companies featured in the Value Line Investment Survey is 2.9%, down from 3.0% last week. For context, this indicator has ranged from low single digits (when stocks are generally overvalued) to approximately 20% when stocks are in the teeth of bear markets like 2008-2009.
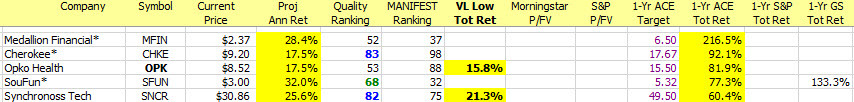
Stocks to Study (3/10/2017)
There continues to be evidence of strengthening fundamentals and 1-year price targets are getting adjusted upward, on balance. Many of the biotech and pharma companies are showing the damage — and resultant higher return forecasts — as a result of “bashing” and criticism from inside the Beltway.
Based on the near term expectations for Round Table selection MEDNAX (MD), it will be interesting to see if we’re truly “early” and/or if we catch a wave as the S&P and Morningstar and Goldman Sachs analysts catch up with us. [Grin] […and Hope]

The Long & Short. (March 10, 2017) Projected Annual Return (PAR): Long term return forecast based on fundamental analysis and five year time horizon. Quality Ranking: Percentile ranking of composite that includes financial strength, earnings stability and relative growth & profitability. VL Low Total Return (VLLTR): Low total return forecast based on 3-5 year price targets via Value Line Investment Survey. Morningstar P/FV: Ratio of current price to fundamentally-based fair value via www.morningstar.com S&P P/FV: Current price-to-fair value ratio via Standard & Poor’s. 1-Year ACE Outlook: Total return forecast based on analyst consensus estimates for 1-year target price combined with current yield. 1-Year S&P Outlook: 1-year total return forecast based on S&P 1-year price target. 1-Yr “GS” Outlook: 1-year total return forecast based on most recent price target issued by Goldman Sachs.