Of Lost Decades …

This Week at MANIFEST (8/7/2015)

“Stock market corrections, although painful at the time, are actually a very healthy part of the whole mechanism, because there are always speculative excesses that develop, particularly during the long bull market.” — Ron Chernow

“You get recessions, you have stock market declines. If you don’t understand that’s going to happen, then you’re not ready, you won’t do well in the markets.” — Peter Lynch

“After 1929, so many people had been traumatized by the stock market crash that there was a lost generation.” — Ron Chernow

The first ten years of this century are referred to as a Lost Decade.

For those who were concentrated in investments in the S&P 500, it clearly was a “lost decade” as the combined stock prices of the S&P 500 actually ended the 10-year period in nearly the same place they started. There were exceptions, but the carnage was deep. We’ve reminisced before about the October 2001 warnings from Ralph Acampora that index fund investors were “about to get killed.”

There are days when I wonder if we aren’t on the verge of another “lost generation.” Interest in common stock investing has waned to long-term lows and the long-term damage/cost/lost opportunity is likely to be palpable.

I like William Devane. A lot. But as a paid spokesperson for one of those gold companies he’s a disservice. “How many of you were compensated or bailed out by the government after the last crash?”

Answer: None. (1) We didn’t expect to be. No one should. (2) We didn’t need it. Check out the image of Tin Cup and the getting-back-to-even moment that happened for many of us before Jim Cramer started talking and writing about it.

Lost Generation? Think about 1941 and the 12 years of aftermath. It was into this void of investing and the schrapnel of rampant speculation that George Nicholson helped to launch the modern investment club movement in Detroit. Because it’s about EDUCATION … and deployed understanding as a real key to the stock market — as suggested by Peter Lynch — is discovered patience and discipline.

This Week at MANIFEST (7/31/2015)

A Wooden Anniversary!

It’s “one of those weeks” as we celebrate five years of monthly Round Table webcasts during our July session on Tuesday night, July 28th at 8:30 PM ET. Anyone and everyone is invited as we’ll take a look back at five years of selections and celebrate a tracking portfolio that is beating the overall stock market. Our intent is to share a few actionable ideas every month — and keep track while demonstrating a time-honored approach to stock analysis (discovery and selection) that has served our community of investors for more than 70 years.

Round Table Tracking Portfolio: https://www.manifestinvesting.com/dashboards/public/round-table

Event Registration: https://www.manifestinvesting.com/events/174-round-table-july-2015

Companies of Interest: Value Line

The average Value Line low total return forecast for the companies in this week’s update batch is 5.3% — slightly higher than the 4.5% for the Value Line 1700.

Long term forecasts were relatively stable with very few material changes in outlook. Please be reminded that some “upgrades” move stocks from “consider selling” classifications to a “weak hold.” This is likely the case with Foot Locker, Ulta, American Eagle and Zoetis. Fundamentals strengthened but still remain potentially overvalued, just not as much.

Materially Stronger: Dollar Tree (DLTR), Sempra Energy (SRE), Foot Locker (FL), Ulta Salon (ULTA), American Eagle (AEO), Zoetis (ZTS)

Materially Weaker: Weight Watchers (WTW), Francesca’s (FRAN), Sears Holdings (SHLD)

Standard Coverage Initiated:

Discontinued: Mead Westvaco (MWV), Babcock & Wilcox (BWC), Family Dollar (FDO)

Market Barometers

Value Line Low Total Return (VLLTR) Forecast. The long-term low total return forecast for the 1700 companies featured in the Value Line Investment Survey is 4.5%, up from 3.8% last week. For context, this indicator has ranged from low single digits (when stocks are generally overvalued) to approximately 20% when stocks are in the teeth of bear markets like 2008-2009.

Stocks to Study (7/31/2015)

  • Fossil (FOSL) — Highest MANIFEST Rank
  • Weight Watchers (WTW) — Highest Low Return Forecast (VL)
  • Coach (COH) — Lowest P/FV (Morningstar)
  • Iconix Brands (ICON) — Lowest P/FV (S&P)
  • Kate Spade (KATE) — Best 1-Yr Outlook (ACE)
  • Kate Spade (KATE) — Best 1-Yr Outlook (S&P)
  • Sempra Energy (SRE) — Best 1-Yr Outlook (GS)

Note: The price targets from Goldman Sachs are from public releases and represent a partial sample. The price target is logged as of the most recent public analyst report. Although every effort is made to keep this information as current as possible, some of the ratings may not reflect more recent research and updates.

End of an Era

This Week at MANIFEST (6/5/2015)

The End of an Era

For the last several years, I’ve shared the story about proper storage, layup and preparation and the joy it delivered as my annual tug-of-war with the grass cutting machine nearly killed me. And then some words of wisdom from my Dad, “Run it dry when you shut down in November” put an end to the agony.

2014 was the tenth year in a row.

Result? A first pull start for a decade or so. This is an amazing thing.

This year, that wonderful streak came to an end. The prep was sufficient and I even changed the oil, bought the best gas, etc. — but I may have primed one too many pumps of the bulb.

But it started on the second pull this year!!! We’ll take that as almost as good. There’s no comparison to the brutal wrestling matches of yore or trips to the repair shop of the past.

Companies of Interest: Value Line

The average Value Line low total return forecast for the companies in this week’s update batch is 5.7% — higher than the 3.7% for the Value Line 1700.

Materially Stronger: Balchem (BCPC)

Materially Weaker: Peabody Energy (BTU), Chesapeake Energy (CHK), Gulfmark Offshore (GLF), Encana (ECA), Ruckus Wireless (RKUS), Itron (ITRI), EOG Resources (EOG)

Standard Coverage Initiated:

Discontinued: Arch Coal (ACI), Alpha Natural Resources (ANR), Penford (PNX), Aruba Networks (ARUN)

Market Barometers

Value Line Low Total Return (VLLTR) Forecast. The long-term low total return forecast for the 1700 companies featured in the Value Line Investment Survey is 3.7%, unchanged from last week. For context, this indicator has ranged from low single digits (when stocks are generally overvalued) to approximately 20% when stocks are in the teeth of bear markets like 2008-2009.

Stocks to Study (6/5/2015)

  • Alliance Resource Partners (ARLP) — Highest MANIFEST Rank
  • Southwestern Energy (SWN) — Highest Low Return Forecast (VL)
  • Peabody Energy (BTU) — Lowest P/FV (Morningstar)
  • Consol Energy (CNX) — Lowest P/FV (S&P)
  • Alliance Resource Partners (ARLP) — Best 1-Yr Outlook (ACE)
  • Chesapeake Energy (CHK) — Best 1-Yr Outlook (S&P)
  • Phillips 66 (PSX) — Best 1-Yr Outlook (GS)

Market Barometers (Continued)

Is “Winter” Coming?

I don’t know. But the combination of a declining $USHL — remember, the number of 52-week highs crests well before a bear market, much like the first signs of falling leaves in Autumn — with the historical low overall return forecasts is cause for vigilance. I’ve started exploring some of the work of Harry Dent, the demographics-centered economist. Dent’s forecasts back in the 1990s certainly merit a closer look because he’s concerned about the outlook for 2015 and 2016. Stay tuned.

In the meantime, quality is your friend. When buying, demand high quality and leadership financial strength.

It’s Quiet. Too Quiet?

During an investment club visit this morning, one of the experienced investors made an observation about the relative lack of volatility in the market right now. My answer was framed around the reality that lower volatility generally leads to lighter paychecks on Wall Street (traders can make more money with more amplitude and frequency in both directions) and that if anything — being “too quiet” is actually disquieting for long-term investors because the rhinos can get restless and go on a misbehaving rampage. It’s the type of condition that fostered the leverage insanity of a few years ago and let’s face it, very little has actually been remodeled or remedied since those tumultuous days a few years ago. $VIX is a measure of general volatility and we see the quiet-too quiet days of 2007 which led up to the Great Recession and the current conditions.

Diligence (Weekly)

Diligence. This week’s update provides an up-close-and-personal look at our weekly process for seeking actionable investing opportunities to study.  Our subscribers benefit from this information starting every Monday morning with the roll call, the fundamental updates and the targeted opportunities for further study.  For more on Manifest Investing, go here.

“Diligence is the Mother of good luck.” — Benjamin Franklin

“The expectations of life depend upon diligence; the mechanic that would perfect his work must first sharpen his tools” — Confucius

This week we take a closer look at our weekly report — and specifically — how we think this information is best used by long-term investors.

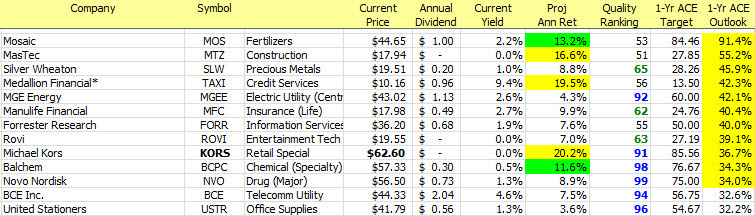
In a nutshell, we’re checking in on a few key areas. If you’re a shareholder or stockwatcher, we provide a synopsis of the best opportunities in the current (this week’s) update batch from Value Line. We update 1/13th of all companies every week and the best return forecasts for the week are on display in the Companies of Interest: Value Line section.

In the case of Tidewater (TDW), the Value Line low total return forecast (annualized for the next 3-5 years) is 25%.

This was based on the stock price shown ($25.57) on the date of analysis (4/28/2015).

The price is now $29.25 — part of the explanation for the 19.5% on our weekly report. The other source of a difference is that we’re constantly (every day) adjusting the time horizon in addition to the price. That $60 long term low price forecast is a fixed date. In any event, every Monday morning brings a roll call of best opportunities according to Value Line.

Why the Value Line Low Total Return (VLLTR) forecast? Because our research has found this to be the most reliable (actual results vs. forecasts) for the collective of companies covered by Value Line.

And about that $60 entry. This is where we flag opportunities and threats. Any material change (~20-25%) in this long term low price forecast (up or down) is flagged as Materially Stronger (up) or Materially Weaker (down) as we do our Monday morning roll call. If you’re a shareholder or stock watcher for a company that shows up in either roll call, consider it a nudge to see why Value Line seems to have adjusted their expectations — UP or DOWN.

We’ve begun to include direct links to snapshots or thumbnails for some of the flagged companies during these weekly updates. This week, we’ve started with Transocean (RIG) and recent Round Table selection Dril-Quip (DRQ).

When You’re Sailing … Do You Really Care About The Wind?

I think the answer is yes, but it depends. It depends on WHO you are and things like risk tolerance, life expectancy time horizons, opportunistic return maximizing, etc.

For a capital preservationist, we’d like to avoid turbulence like we saw during the Great Recession. This is the reason we track primary market barometers like the overall average return forecast. This characteristic doesn’t tell us when corrections, recessions or bear markets will happen — but it does help to gauge “vulnerability.” Higher quality stocks with higher return forecasts are more recession resistant. Period. On the opposite end, following a recession and significant correction, we “dial up” our interest in more speculative opportunities and increase our dosage of emerging, faster-growing companies.

Our barometers on parade are intended to give a few perspectives on “vulnerability.” The $USHL indicator that we display occasionally is a very broad — and seemingly fairly reliable indicator of rhino behavior. This was inspired by The Big Picture and Barry Ritholtz. You can dig a little deeper on this one at An Attempt to Identify Market Tops ($USHL).

Most of us do very, very little asset allocation — and frankly, it ain’t easy and it’s what most of the investors and asset managers foul up, contributing to overall negative relative returns on average for the average rhino.

That said, Nicholson counseled that when it gets extremely challenging to find stocks to buy or accumulate, it is acceptable (and potentially incrementally rewarding) to build a war chest of cash equivalents to go shopping after the recession and stock price correction has blasted stocks back to elevated return forecasts.

Our Consensus Perspective

While the Monday morning roll call is limited to the Value Line update batch and our efforts to flag threats and opportunities, we reach out and check forecasts and judgments at places like Morningstar, Standard & Poor’s, Analyst Consensus Estimates (finance.yahoo.com) and Goldman Sachs. We audit and update these various resources to generate the Stocks to Study. This list is always sorted by MANIFEST Rank, our combination ranking of return forecast and quality … and we generally limit the field to the top decile or top 5 percentiles of the stocks in the 1/13th update batch.

Polaris Industries (PII) provides this week’s example of deeper digging in the snow … and beyond the snowmobiles for the company. Did you know that snowmobiles account for less than 10% of annual revenues?

Companies of Interest: Value Line

The average Value Line low total return forecast for the companies in this week’s update batch is 5.6%.

Materially Stronger: Transocean (RIG), Air Products (APD), Hilton Worldwide (HLT), Penn Gaming (PENN), Scientific Games (SGMS), Cambrex (CMB)

Materially Weaker: Wynn Resorts (WYNN), Input Output (IO), National Oilwell Varco (NOV), Melco Crown (MPEL), Oasis Petroleum (OAS), Dril-Quip (DRQ), Oceaneering International (OII), FMC Techologies (FTI), Interpublic Group (IPG), Carbo Ceramics (CRR)

Standard Coverage Initiated: [G-III Apparel (GIII)]

Discontinued: Konami (KNM)

Market Barometers

Value Line Low Total Return (VLLTR) Forecast. The long-term low total return forecast for the 1700 companies featured in the Value Line Investment Survey is 3.6%, unchanged from 3.6% last week. For context, this indicator has ranged from low single digits (when stocks are generally overvalued) to approximately 20% when stocks are in the teeth of bear markets like 2008-2009.

$USHL: Watching Rhino Walk, Not Rhino Talk. If you believe supply-and-demand matters (and you should) then the collective actions of the herd have bearing. By monitoring the relationship of new highs vs. new lows, we get an early warning clarion that signaled as Halloween 2007 approached. Current $USHL is weakening as the Sell-In-May-And-Go-Away herd begins to hold sway. We’ll be vigilant for this broad sentiment indicator to break 100 on the long-term moving average and/or break into negative territory.

Stocks to Study (5/8/2015)

Seeing fairly significant increases in the 1-year analyst consensus estimate for companies like Baker Hughes (BHI) and Schlumberger (SLB).

  • Polaris (PII) — Highest MANIFEST Rank
  • Wynn Resorts (WYNN) — Highest Low Return Forecast (VL) with Quality Rank > 60
  • Wynn Resorts (WYNN) — Lowest P/FV (Morningstar)
  • SeaDrill (SDRL) — Lowest P/FV (S&P)
  • Harte Hanks (HHS) — Best 1-Yr Outlook (ACE)
  • FMC Technologies (FTI) — Best 1-Yr Outlook (S&P)
  • Wynn Resorts (WYNN) — Best 1-Yr Outlook (GS)

Stocks to study 20150508

Undervalued Stocks: Dirty Dozen

Many of you are familiar with the Stock to Study / Undervalued feature in every monthly issue of Better Investing.

During the years I served on the stock selection committee, there were times when we wondered about the basis for the undervalued selection — in some cases, it seemed like the runner up to the Stock to Study selection.

But the intent was to identify a stock with either (1) a near-term, 12-18 … perhaps even 24 month catalyst that could lead to outsized returns, or (2) a stock that had been beaten down so badly that the return forecast was elevated. In some cases, stocks that would struggle to qualify for the core constituents of our portfolio were included.

The Dirty Dozen will be a version of this. In this case, the field is limited to stocks with quality rankings above 50 (above average) and with the highest return potential based on the difference between current price and the analyst consensus target price. It should be obvious that the 1-year horizon is pretty squishy so we won’t be doing any calculations out to four decimal places. [Grin]

In this case, for this week, it’s fascinating and coincidental that a stock mentioned by the Manifest Investing door prize subscription at last weekend’s StockFest 2015 in Grand Blanc would be the featured stock, Rockwell Medical(RMTI). This promising and potentially emerging Wixom, Michigan company is possibly worthy of a spot on our speculative radars. Our prize winning investor holds a significant number of shares and is hoping the company emerges and makes like a roman candle — at least for a while.

The other important aspect of our Dirty Dozen is that it extends outside the update batch for the week. The universe is all companies (~2400) covered by Manifest Investing.

Polaris Industries (PII)

Did you know that snowmobiles account for less than 10% of annual revenues at Polaris?

This is a quick look at our canvassing of second opinions … and third opinions … and fourth opinions … in our quest to discover actionable stocks to study.

Polaris Industries (PII)

There it is at the top of this week’s Stocks to Study. The company is no stranger — and has been featured by Ken Kavula during our monthly Round Tables and most recently, at the StockFest 2015 stocks discussion this past weekend in Grand Blanc, Michigan.

For a great overview of this increasingly diverse company, check out Ken’s Round Table analysis from April 2013. The Polaris segment starts at 26:40

By the way, you can find Round Table sessions and specific stocks by going to YouTube.com and searching on terms like Manifest Investing and in this case: Kavula Polaris (PII).

Equity Analysis Guide (EAGLE)

Pii eagle 20150505

Value Line Low Total Return (VLLTR) Forecast

The Value Line low total return forecast for any company is simply a function of four things:

  • Current Price
  • Future Price (Low Forecast)
  • Projected Dividend Yield
  • Number of Years (4)

At MANIFEST, when we publish this forecast, we correct for change in stock price and forecast period (n).

Morningstar Price-to-Fair Value (P/FV)

Determining Fair Value (Source: Morningstar.com)

This philosophy of fundamental research is the foundation for our valuation model. We believe that:

  • How much capital a company invests and what it earns on that capital drive shareholder value.
  • Free cash flow—not reported earnings—is what counts.
  • As Warren Buffett has said, “Growth is always a component in the calculation of value—sometimes a positive, often a negative.” If a company can’t earn its cost of capital, growth destroys value instead of creating it.
  • Competitive advantages disappear over time.
  • It’s dangerous to assume that the future will be better than the past.

These core beliefs guide our stock analysts as they estimate future cash flow, using their in-depth knowledge of each company and its competitive position within its industry. Our analysts forecast revenue growth, profit margins, and capital investment (and all of the numbers that go into them) for each firm they cover.

Their forecasts for each company populate our discounted cash flow model, which calculates the present value of the company’s future discretionary cash flow based on its cost of capital, as determined by our analysts.

Pii mstar pfv chart 20150505

S&P Price-to-Fair Value (P/FV)

The calculation as it appears in the weekly summary is:

139.61/203 (2 days ago) = 69%

$140.41/195.40 = 71.9% (5/6/2015)

A P/FV = 100% is fairly valued. A P/FV < 100% is potentially “on sale.”

Pii sp pfv 20150505

One Year Outlooks

Analyst Consensus Estimates (ACE) (via finance.yahoo.com and/or www.analystratings.net)

  • Current Price = $139.65
  • 1-Year Price Target = $164.06
  • Dividend Yield = 1.5%

1-Year Outlook = Price Apprec. + Dividend Yield = (164.06/139.65) – 1 + 0.015 = +19.0%

There are no current one year price targets for either S&P or Goldman Sachs.

Pii arn 20150505

Best Long Term Forecasts

This Week at MANIFEST (4/24/2015)

One of the Best Long-Term Forecasting Methods

“If you have to forecast, forecast often.” — Edgar R. Fiedler in The Three Rs of Economic Forecasting-Irrational, Irrelevant and Irreverent , June 1977.

It was two years ago that Mark Hulbert featured some words about our approach to long-term forecasting in the context of some editorial on the efficacy of The Value Line Investment Survey.

We have noted — over the years — that actual returns tend to more closely resemble the low return forecasts on the company research pages for Value Line. Since 2001, the average Value Line low total return forecast has been 7.9%. The actual returns over that time frame have been 6.5%.

Here’s a quarter-by-quarter illustration of forecast vs. actual for the Value Line companies:

This was essentially what Mark Hulbert was sharing in the article, Finding The Best Four Year Market Forecaster.

To us, although the absolute math is important — what really matters is the “shape.” This would suggest that we’ve still got a few quarters of upward-sloped plateau ahead of us. But the “swoon vulnerability” is still pretty high and the reality is that no one knows when the next market break will hit or how “corrective” it will prove to be.

Companies of Interest: Value Line

The average Value Line low total return forecast for the companies in this week’s update batch is 3.0% — lower than the 3.7% for the Value Line 1700.

Less turbulence again this week in the updates although there were more companies dropped from coverage than we’ve seen in a very long time.

Materially Stronger: GEO Group (GEO), Daktronics (DAKT)

Materially Weaker: DeVry (DV), Philip Morris International (PM), Career Education (CECO), Zynga (ZNGA), Boulder Brands (BDBD)

Standard Coverage Initiated:

Discontinued: Safeway (SWY), Pantry (PTRY), Silicon Image (SIMG), Chiquita Brands (CQB), LeapFrog (LF)

Market Barometer

Value Line Low Total Return (VLLTR) Forecast. The long-term low total return forecast for the 1700 companies featured in the Value Line Investment Survey is 3.7%, a slight decrease from 3.8% last week. For context, this indicator has ranged from low single digits (when stocks are generally overvalued) to approximately 20% when stocks are in the teeth of bear markets like 2008-2009.

For more on this chart: Origins of the $USHL Indicator

Stocks to Study (4/24/2015)

  • Synchronoss Tech (SNCR) — Highest MANIFEST Rank
  • Daktronics (DAKT) — Highest Low Return Forecast (VL)
  • ROVI (ROVI) — Lowest P/FV (Morningstar)
  • Fresh Market (TFM) — Lowest P/FV (S&P)
  • Rosetta Stone (RST) — Best 1-Yr Outlook (ACE)
  • Tyson Foods (TSN) — Best 1-Yr Outlook (S&P)
  • Keurig Green Mountain (GMCR) — Best 1-Yr Outlook (GS)

I’ve been giving some thought to a database-wide screening summary of “deeper value” opportunities that we’d publish on Tuesdays. Keep in mind that the results of our Monday morning efforts are focused — as they should be — on 1/13th of the stocks we cover and on behalf of shareholders and stock watchers.

Proposing a “Dirty Dozen”

OK, it’s really a Baker’s Dozen — culled from the full database and it’s based on two things:

  • Better Than Average Quality
  • Highest Analyst Consensus Estimate-based (ACE) Expectations for the year ahead

I’m thinking that it could be meaningful when these opportunities converge with the longer term opportunities. The table provides the top (13) such companies on 4/21/2015 — and we’ll see how this behaves/performs over the next few months.

Stocks to Study (4/18/2015)

Screening Results (April 2015)

Shopping In Prairie Dog Mode

If you’ve been to Devil’s Tower, watched enough Animal Planet and/or visited your local zoo, you’ve seen vigilance. Think about the images or scenes of prairie dogs where a “town” or “clan” hears an unusual noise. Immediately, several of the critters will stand on their hind legs and they’ll generally look East, West, North and South as they collaborate to detect potential danger.

Vigilance in Context

Same thing here. Although we’re reluctant to refer to our community of investors as animals, we know that we’re well served when we remain vigilant.

In this case, we’re continually mindful of the parade of opinions from the rhinos that cover and exude/spew opinions on our companies. For this month’s screening results, we hit the ejector button on any qualifying companies that failed to exceed the averages of a number of forecasts.

“Ignore the words issued by analysts (buy/sell/hold) but heed their numbers and homework.” — Walter Kirchberger

The companies in the accompanying list are sorted by MANIFEST Rank Descending and therefore have strong return forecasts and quality rankings. Every week we check our update batch for drifts (downward and upward) in expectations — heeding their numbers. This is little different as we value consensus and elevated financial strength under these market conditions. For perspective, the average Value Line low total return forecast is 3.7%. The average P/FV at Morningstar is 104% and S&P checks in at 99%. The average 1-year total return expectation from ACE is 13.5%. S&P sees the year ahead at 9.5% and Goldman Sachs (GS) is a little more grumpy and pessimistic at 7.0%.

All of a sudden, this whole investing thing was no longer just a hobby. (grin)

Whiskey and Water

Whiskey’s For Drinking, Water’s For Fighting

by Walter Kirchberger, Sigma Investment Counselors

Generally attributed to Mark Twain, this is just as true to day as it was in the 1800s. Consider California and its increasingly onerous restrictions on water usage.

Water is an essential ingredient of life, and businesses require reliable and economic supplies of water in order to operate.

California’s apparent inability to effectively manage its water resources is likely to have far reaching implications for population and business activity.

Water shortages, in many parts of the world, including California, tend to be cyclical, with years of plenty followed by years of drought. The solutions are not complex. Technologies for producing potable water from sea water and other sources are well known, economic, and proven in arid areas around the world.

Water problems are almost always political. Consider the wrangling over the allocation of California’s limited supplies between environmental, agricultural, and general consumption, for example. Or, the not in my back yard approach to desalination projects.

Investors should stay tuned. The recent increase in California’s problems have yet to trigger major movements in population or capital investment, but the full impact of the current restrictions on water use have not been fully felt. Moreover, there does not appear to be any movement towards a comprehensive solution.

All comments and suggestions are welcome.

About The Author

Walter joined Sigma in 2003 and has more than 50 years of experience in security analysis, equity research and investment banking, including 12 years at National Bank of Detroit (now JPMorgan Chase) and 33 years at UBS AG/Paine Webber. Walter is a graduate of the University of Wisconsin with a degree in Economics. He earned the Chartered Financial Analyst (CFA®) designation in 1966 and has successfully completed the General Securities Representative Series 7 examination. Walter primarily serves as a research consultant and advisor to Sigma’s Investment Committee. Walter is a member of CFA® Institute, the CFA® Society of Detroit and serves on the Editorial Advisory and Securities Review Committees of the National Association of Investors Corp’s magazine, Better Investing.

Industry Study: Water Utilities
by Mark Robertson

I have fond memories of Walter Kirchberger and Bob Bilkie (CEO, Sigma Investment Counselors) and their considerable contributions to the Better Investing editorial advisory team. As many of you know, investment club champion George Nicholson, Jr. personally selected the stocks for the monthly features in the magazine from 1951 until the mid-1970s when he sought to bring some external perspectives and ideas to a nation of long-term investors. In my years on the stock selection committee, I was impressed by the ideas and performance results of both of these guys.

Walter is the classic independent analyst — serving in investment banking roles while operating out of Detroit. Some would say sheltered from the chaos and we’ve spent time talking about how “boondocks” can be an asset, an oasis from the noise. I recall that he had a few favorite themes. One was a general reluctance/avoidance of healthcare stocks. Walter didn’t like the vulnerability of the playing field to the whims of unbridled politics. A second theme was WATER and the reality that a vital resource will present actionable/investable opportunities if you remain vigilant.

Some of you “bristled” at our November 2009 selection of Aqua America (WTR) as a Solomon Select feature. We received an unusually high number of opinions that we’d drifted and that we really needed to pay more attention to growth stocks, etc. etc. etc. It was Walter Kirchberger who I thought of as I gritted my teeth and hoped for the best. As the accompanying graphic shows, Aqua America proceeded to significantly outperform the market over the next couple of years.

I don’t know whether opportunity will surface in this charging market of the last several years, but it’s time for a deeper dive into water-related industries and companies.

Water Utilities — Industry Characteristics

Growth

Revenue growth is a function of population and inflation — in general. Walter is right, there are some hiccups and bubbles along the way. Over the long term, the average sales growth for the industry is 4-5%.

In the absence of growth, for legitimate infrastructure reasons, the average current yield for the Water Utility industry is 3.0%.

Profitability

It’s here that we may see some of the pressures and turbulence (and perhaps even opportunity) mentioned by Walter. This trend has been in place for some time and shows no sign of slowing. Greater efficiencies combine with concerns about supply. Might this be a situation similar to the opportunistic purchase of railroads — citing the reality that no more railroads will be built. In that same line of thinking, industry consolidation and optimization appears to be well underway.

The long-term projected industry net margin by Value Line is 16.8%.

The EPS stability for the Water Utility industry is a relatively high 77.

This is a case where — supported by the trend in the accompanying graphic — the future estimates of net margins in specific stock studies could actually be boosted slightly.

Valuation

The industry average P/E is 20x with relatively small variations. There are gulps and hiccups along the way but the long-term characteristic is quite steady.

The average quality ranking is 78, ranging from a high of 95 for Connecticut Water Service (CTWS) to a low of 56 for American Water Works (AWK) — the gorilla in the group.

Goldman Sachs: Buy and Avoid

This was a tangential subject of discussion during the March Round Table. We’ve added Goldman Sachs price targets and will be monitoring them versus ACE and S&P.

Nutshell: Might this be a way to gauge sentiment? In this case, these differentials could deliver influence or impact, providing a potentially meaningful sentiment indicator.

http://www.bloomberg.com/news/articles/2015-04-02/goldman-here-s-where-u-s-investors-should-put-their-money-for-the-rest-of-the-year

Gs buy avoid list 20150331

As a quick reminder to be careful out there, this is what this morning held for Garmin (GRMN).

That’s a reduction from $63 to $54.

Source: Benzinga.com

Grmn gs opinion 20150402

More Fun With Goldman Sachs

When they’re not doing “God’s work” or referring to retail investors as Muppets, Goldman Sachs (GS) makes some calls — long and short — that can be influential in the market. In some Wall Street circles, the legions of Goldman Sachs are playfully known as Masters of the Universe.

In addition to the two lists shared above, here’s a list of nineteen stocks that Goldman Sachs believes are headed for price swoons — a list of stocks to sell short.

Goldman Sachs offers three criteria on how to pick stocks to short:

  • Look for individual stocks with high valuations that have a tendency to underperform;
  • take hints from mutual funds as they do a good job of selecting shorts;
  • and look for stocks that are likely to move on company-specific factors and are less prone to moving with general market and sector trends.

Among the overvalued stocks Goldman thinks could drop are Celgene (CELG), OReilly Automotive (ORLY) and Red Hat (RHT). Stocks underweight by mutual funds that could fall are HST, CTL and EQR; and likely to deviate from the broad market and their sectors are KLAC, JEC and COH.

Rounding out Goldman’s 19 stock recommendations that could reward short sellers: ARG, DO, DISCA, FLS, KSS, MOS, NDAQ, NVDA, TDC, WU.

Tracking Dashboard: http://www.manifestinvesting.com/dashboards/public/goldman-shorts-20140414

Here are the tracking dashboards for the Goldman MOST UPSIDE and MOST DOWNSIDE stocks as of 3/31/2015: