We’re thankful to Tom and David Gardner for their contributions to the arena of long-term investing.
Here’s the link to our April 2005 cover story, A Tribute To Foolish Investing
Happy April Fool’s Day to Fools everywhere!

We’re thankful to Tom and David Gardner for their contributions to the arena of long-term investing.
Here’s the link to our April 2005 cover story, A Tribute To Foolish Investing
Happy April Fool’s Day to Fools everywhere!
Take one down, pass it around …
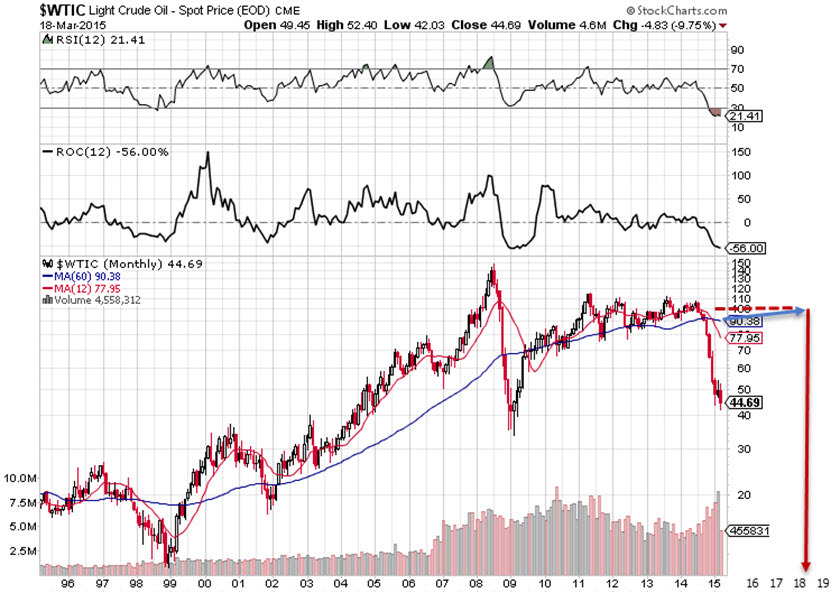
Here’s a 20-year look at the price of crude oil ($WTIC).
$100/barrel will be back before most people expect — perhaps in the 2018-2020 range. Unless somebody propagates a successful and sustained fusion reaction in their garage.
It is interesting that the slope of the long-term trend following the Great Recession resembles what we’re seeing for top-line growth from all companies, collectively.
“I would be a bum on the street corner with a tin cup if markets were efficient.” — Warren Buffett
This demonstration portfolio invests the maximum allowable 401(k) in stocks. Total assets reached $1,000,000 in 17 years. Tin Cup has outperformed the S&P 500 since inception (1995) and the annualized total return is now 18.6% vs. 9.9% for the S&P 500.
The total return for the trailing year for Tin Cup is 20.1% versus 13.9% for the Wilshire 5000 (VTSMX).

And not to “jinx” the free throw shooter during March Madness … but we can probably start thinking $2,000,000 count down fairly soon. The second million won’t take nearly as long as the first.
Tracking portfolio for Tin Cup: https://www.manifestinvesting.com/dashboards/public/tin-cup

March. “Madness … takes its toll.” — Riff Raff
The name “Hebron” traces back to a range of meanings from “colleague”, “unite” or “friend”. In the proper name Hebron, the original sense may have been alliance. Invest With Your Friends.
From 1908-1971, the Illinois boys high school basketball championship was a single tournament contested by nearly all high schools in Illinois. The Illinois High School Basketball Championship was the first tournament to be called ‘March Madness’. The term was first used about the Illinois tournament in 1939, decades before it was used about NCAA basketball tournament.
The movie Hoosiers was preceded by these real events from across the state line in Illinois. In 1952, the Hebron Green Giants (from a high school with a total enrollment of 98) defeated Quincy in a real David and Goliath story.
But that doesn’t stop us from fondly remembering the scene where Gene Hackman and his high school boys arrive at Butler Field House for the state championship game. Hackman has players measure the distance from the basket to the free throw line and the height of the basket, demonstrating to the players that everything is “the same as our gym back in Hickory.”
Our methodology is based on measuring and monitoring the sales growth forecast, profitability expectations and projections for a reasonable, considered average P/E ratio in the future for all companies that we analyze. This is how we do.
Equally important is to make sure that we’re prudent. This requires diversification across sectors and industries like everybody else out there building portfolios in the investing world. But we emphasize — on a higher level — the urgency of diversifying such that our blend of companies will produce an average sales growth forecast (plus or minus a percent or two) of 11-12%. So in our investing world, the “Hebrons” are as important as the Quincy entries.
And in the spirit of Gene Hackman’s Coach Norman Dale, measuring what matters is what really matters.
Our Periodic Reminder About “All-Of-The-Above” Investing
While the rest of the world hyperventilates over NASDAQ 5000, we’ll be watching for a different 5000 — that being the 5000 level for the Value Line Arithmetic Average. We think the overall performance of the Value Line 1700 stocks over time is a powerful reminder of the common sense wisdom to achieve and maintain diversification by average overall portfolio growth rate (company size).

The 10-year rate of return on the Value Line 1700 (Arithmetic Average) is (4806.57/1771.3) = 10.5%
The 10- year rate of return on the S&P 500 (VFINX) is (191.73/91.60)^(0.1)-1 = 7.7%
The average Value Line low total return forecast for the companies in this week’s update batch is 4.0% — slightly higher than the 3.6% for the Value Line 1700.
Materially Stronger: Seattle Genetics (SGEN), TCF Financial (TCB), U.S. Steel (X), Fifth Third Bancorp (FITB), ACE (ACE), Private Bancorp (PVTB), Biomarin Pharma (BMRN), Cerner (CERN)
Materially Weaker: Arcelor Mittal (MT), Schnitzer Steel (SCHN), Kennametal (KMT), Brookdale Senior (BKD)
Standard Coverage Initiated:
Discontinued: Alliant Techsystems (ATK), Orbital Sciences (ORB)

Value Line Low Total Return (VLLTR) Forecast. The long-term low total return forecast for the 1700 companies featured in the Value Line Investment Survey is 3.6%, up slightly from 3.5% last week. For context, this indicator has ranged from low single digits (when stocks are generally overvalued) to approximately 20% when stocks are in the teeth of bear markets like 2008-2009.

A quick throwback to our weekly update from four years ago …
We watched Apollo 13 this weekend. Do Tom Hanks or Ron Howard movies ever get old? The movie is packed with drama and splashed down on the Hollywood red carpet with a wonderfully deserved nine Oscars, including Best Picture.
Maybe it’s my engineering heritage, but my favorite sequence comes with about three days left in their return voyage when the discover that the cabin is becoming progressively poisonous as carbon dioxide levels are climbing in the lunar module. In a real life MacGyver moment, a team of engineers in Houston scramble and put together an air scrubber using a pile of junk including packing materials and a variety of … well, garbage. But the star of the moment is duct tape. “Aquarius, you need about three feet, Jim.” “Just tear off a strip about as long as your arm.”
As Kevin Bacon fights to avoid passing out, the duct tape kicks in and the air purification is underway.
Sometimes our portfolios need a little duct tape. As roman candles flame out and cruise missiles reach their destination, there are times when plain old ordinary (in some cases, non-growth) companies can be provide a significant booster stage for our portfolios. Our Tin Cup model portfolio owes a great deal to Wolverine Worldwide and AutoZone back in 2000-2002 while the booster rocket debris was landing all around us.
Watch for our online discussion, “Roman Candles, Cruise Missiles & Ejector Seats” which we’ll encore during March … and I’m going back to applying a little more duct tape to our portfolios.
“Houston, we don’t have a problem so long as we have enough duct tape.”
On Wednesday night, Ken Kavula, Nick Stratigos and I participated in a “book club” program delivered by NAIC/Better Investing featuring Jim Cramer’s Get Rich Carefully. We were joined by Eve Lewis and the panel unanimously felt the book is a worthy read for long-term investors.
Booyah. Jim Cramer surprised me.
I didn’t expect the book to be this good. The end result is a profile of a matured/maturing investor. Jim started with Goldman Sachs, learned a great deal from one of the most successful investors of all time, Michael Steinhardt … went on to manage his own hedge fund and ultimately become the influence that he is today.
The preface alone is worth the price of admission. Cramer covers the turbulent and challenging landscape facing should-be long-term investors today. The breach of trust, shenanigans and continuing nuisances of high frequency trading, dark pools and opportunists with too many brain cells and too much time on their hands persists today.
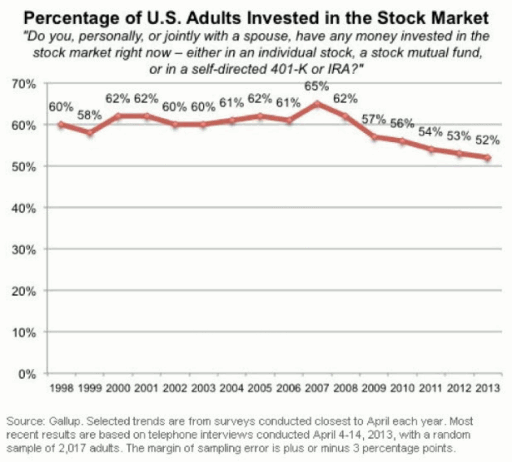
As George Nicholson, grandfather of the modern investment club movement, would most probably remind us: “It’s incumbent on us — all of us — to rise above this to champion better futures for the people we care about.” Buying excellent companies when they’re on sale — and holding them for as long as it makes sense to do so — is still relevant. Perhaps even urgent based on the accompanying illustration of recent trends.
In the July 2014 preface, Cramers “calls” the current level of the NASDAQ and its 16-year highs. He stipulates that the denizens of the NASDAQ are less likely to explode this time around. He puts HFT and the other nonsense into context. And …
Cramer closes the preface with … “I, on the other hand, prefer for you to get rich using stocks as your wealth builders, as long as you invest wisely and carefully when doing so.”
Ken Kavula speculated that Cramer is absolutely a closet investment clubber. He largely focuses on core stocks, seeking and owning leadership companies and remaining vigilant for opportunities in several general themes. He also suggests that it’s OK for investors with experience and risk tolerance to stretch and reach for opportunity. This is absolutely consistent with Nicholson’s admonition about seeking high-quality core holdings as the strategic foundation of our portfolios while allowing for speculation and “playfulness” with a suitable portion of our portfolios, for example 10% of total assets.
In that context, the Cramer on CNBC and in current publications often takes the persona of the higher flying risk taker. (Some of this is assuredly related to audience and appetite.) His entries in the current Groundhog Challenge, were compiled from his 20 stocks for 2015. Cramer is currently high on the leader board.
Cramer’s Groundhog Selections can be monitored here: Cramer’s Celebrity Groundhog 2015 Entry
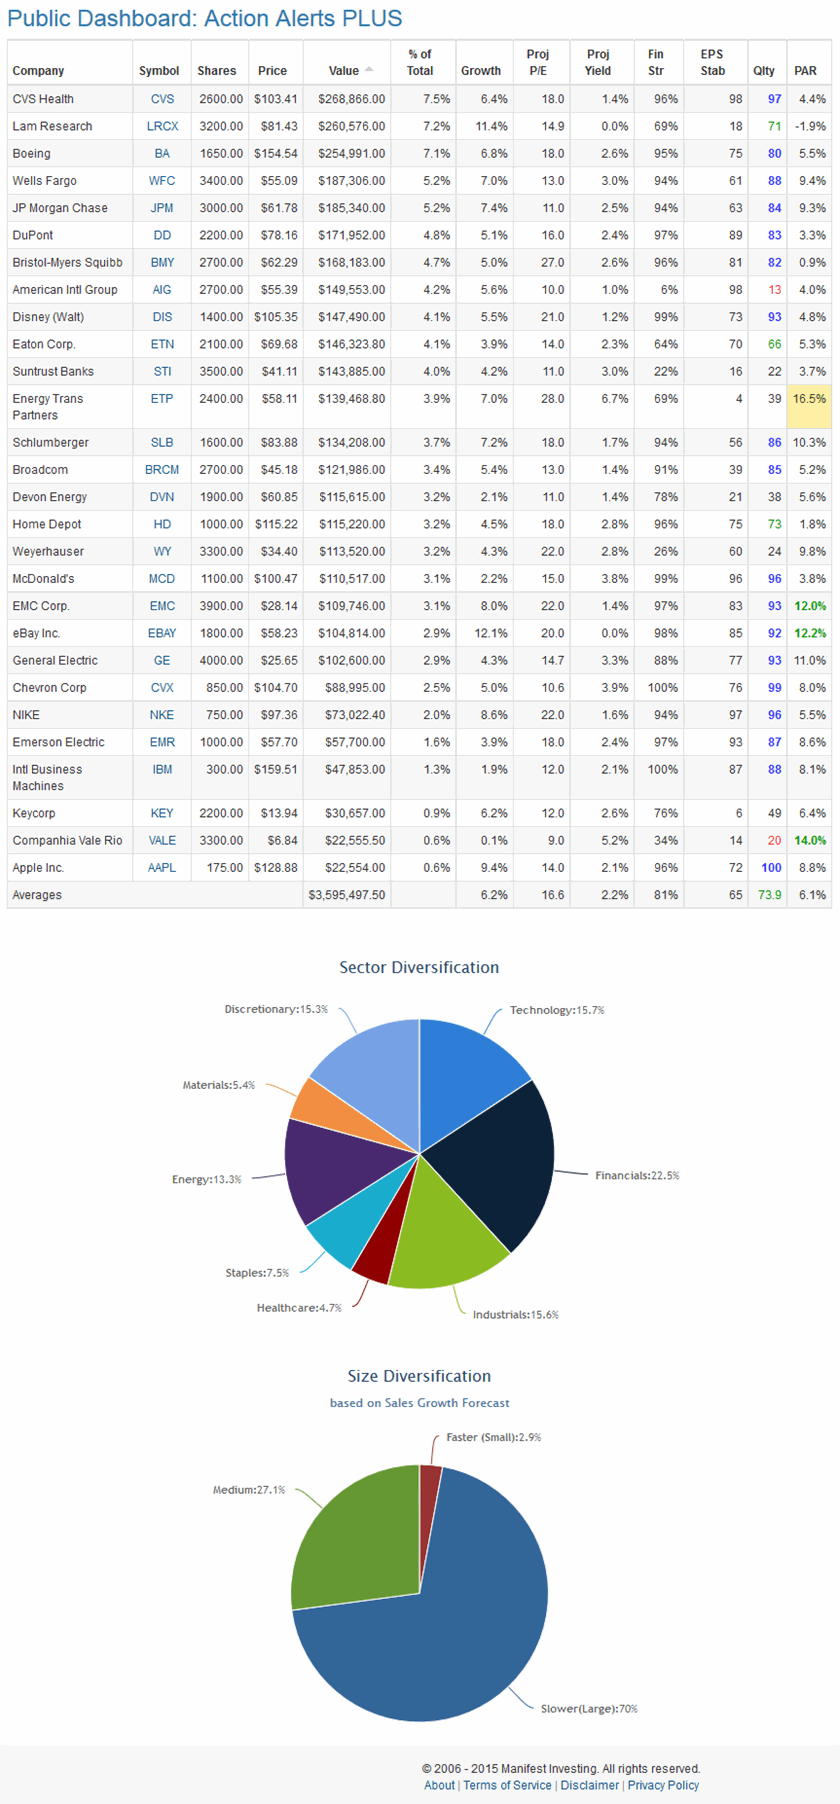
Contrast that list with the stocks in the ActionAlertsPlus charitable trust portfolio. I’m not sure exactly how current the portfolio is, but turnover is relatively low (certainly lower than the TV show lightning) but definitely a different breed of companies — virtually all of them leaders in their industries:
Cramer cites the non-farm payroll data as the report that he finds most influential. He keeps a close eye on this.
Again, I was skeptical.
Again, I was surprised.
Here’s a look at the 20-year track record of U.S. Non-Farm Payrolls ($$EMPLOY) courtesy of www.stockcharts.com:
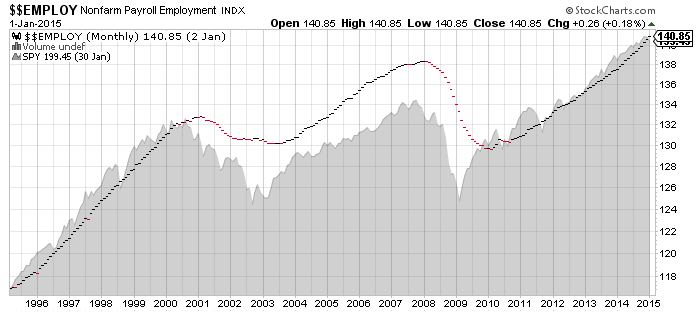
All the usual caveats apply. We don’t think of these charts as predictive. We never use them in isolation. But as “another arrow in the quiver” it simply makes sense that hiring trends and recessions go together. The disruptions in 2001-2002 and 2008-2009 are quite obvious … and we’d be concerned if the payroll trends flattened or declined at the same time as return forecasts bottomed and the $USHL deteriorated. Recessions and depressions can inflict significant damage. And harboring in high-quality, decreasing speculation and raising cash equivalents is logical for those seeking capital preservation or in the words of Nicholson, “to enable better shopping after the recovery is rolling.”
The power and potential of community investing is nothing new to us.
Cramer surprised me. I was reminded that his concern and hope is genuine. He really does want a nation of investors to do better. He’s meandered down several paths from Goldman to Steinhardt to Cramer Berkowitz to CNBC/MadMoney. …
Results matter too. I’d really like to see better long-term performance from the Action Alerts Plus portfolio — perhaps a little more of that Steinhardt magic/advantage or some of that portfolio design and management magic experienced over seven decades by many of us.
Cramer shares valuable lessons well and the maturation continues. Learn the lessons well. Share them. “We are now ready to triumph over the daily trauma of markets that we no longer fear. We have each other’s backs. We know there is no such thing as overnight wealth [for most.] That’s for fools who will never attain it. We’re busy taking our time, avoiding the pitfalls, trying to see around the curves and tiptoe past the endless land mines as we attempt, carefully, to get very rich and not to give it back when we get there.”
Booyah.

This editorial appeared in Better Investing magazine back in April 2000 in response to a widely-circulated “research paper” that assailed investment club performance. In my opinion, investment clubs unleash stewardship and deliver the potential for better futures to all who come to understand the philosophy and methods.
by Mark Robertson, Senior Contributing Editor, Better Investing
The coming of April showers means that, once again, March Madness has come and gone. March Madness. With each passing year, I find that I enjoy the mighty meetings of high school basketball teams, closely followed by their collegiate counterparts. By the time this magazine reaches your coffee table, there’s a pretty good chance that a number of magical moments will have happened. Gene Hackman and his Hoosiers were just one shining moment. There will be others. The goose bumps are “on ice” just waiting to be experienced. “Do you believe in miracles?”
We’ve acknowledged in past articles that George Nicholson always regarded NAIC and investment clubs as his “Grand Experiment.” Investment clubs are also human. The things that can be discovered are nothing short of miraculous.
Exploring the rewards of investing while stripping away the myth and mystery is something that brings a smile to our faces. Learning to smile together is a gift that we hope to share with as many people as humanly possible.
March Madness. It brings out the best. Unfortunately, it sometimes brings out the worst, too.
The January/February 2000 issue of the Financial Analysts Journal features an article by Brad Barber and Terrance Odean entitled, Too Many Cooks Spoil the Profits. This publication is received by Chartered Financial Analysts. Although fairly few people will ever see this report, we believe that exploring some of the conclusions is worthwhile. If nothing else, Barber and Odean have been regularly appearing in the media. We think they could gain much from a better understanding of investment clubs and strategic long-term investing.
Quoting their conclusion: “Unfortunately, [investment clubs] do not beat the market.”
We have “been here” before and it won’t be the last time. A year ago, a number of publications assailed our Beardstown Ladies. Too many cooks? Most of us rather like cooking with our friends. There is some impressive cookin’ going on. There will come a day that we’ll demonstrate that we not only achieve (in the words of Barber and Odean) “savings, education, friendship and entertainment . . .” but we also achieve very promising performance levels as well. Collectively, NAIC investors achieve high returns. Clearly, this does not happen for every single club or every individual, but we have scores of success stories. We think it’s valid to point to our Top 100, this issue’s main feature, as substantial evidence. With Intel, Lucent Technologies, Home Depot, Cisco Systems, Merck, PepsiCo and Microsoft among the most widely held companies, clearly somelevel of success has been attained by our practitioners.
Nearly 4,500 investment clubs (11.9 percent of registered clubs) responded to our latest Top 100 Survey with complete portfolio summaries and club accounting reports. Barber and Odean assail the “touting” of investment club performance in the media by citing sample bias. Barber and Odean base their findings on 166 investment club account statements from a single discount broker! Not only that, they cite turnover levels of 65 percent (nearly a complete overhaul of the stocks within a club portfolio every year-and-a-half.) Barber and Odean also share that these club accounts were concentrated in high beta, small-cap stocks. These characteristics lead us to a simple question, “Are you sure that you’re assessing NAIC club performance?” That doesn’t sound like what the long-term investors we know about are doing.
Most people are not statisticians, but I think that they can sense that 4,500 data points might be more representative than 166. Particularly when the “166” are “weak.”
The authors dwell on excessive turnover and poor returns due to commission costs. We ran a quick, biased, completely unscientific survey to investigate a hunch. Approximately 50 online investors responded. I think we can assume that these investors are “most likely” to be the most active. We asked them to provide their turnover figure for 1999. The highest turnover rate reported was 40 percent. The lowest, from several respondents, was 0 percent. (No sell transactions for the year.) The average was 8 percent. Unscientific, yes. And admittedly biased. But, in my opinion, closer to the truth about what long-term investors are really doing.
Here’s another aspect that the Barber and Odean study that raises questions. MANY investment clubs use dividend reinvesting. So, I went back and checked. In 1996, our investment club had 64 percent of our assets in DRPs. Our discount brokerage account would have been terribly UNinformative about the true performance of our club.
Barber and Odean include another rehash of the Beardstown Brouhaha of 1999 as “evidence” of poor performance. It bears repeating. Investment clubs, including our Beardstown Ladies, are human. A mistake was made. But, for the record, the Beardstown Ladies achieved a 15.3 percent annualized return for the 14 years ended in 1997. (This was part of the Price Waterhouse audit.) The annualized return for the S&P 500 for this same 14-year period was 16.9 percent.
If the ladies are guilty of under performance, consider this: In his book, Common Sense on Mutual Funds, John Bogle Sr. documents that only 14.1 percent of “growth and value” mutual funds beat the Wilshire 5000 (16.0 percent returns for the total market) for the 14 years ending in 1997. While committing their “crime,” our Beardstown Ladies “defeated” 5-out-of-6 mutual funds.
March Madness, indeed.
Is the point that the ladies would have been better off stuffing their recipes and cold cash into the corners of their mattresses? I certainly hope not, because if that’s the case, these two educators are not only failing to educate — they’re DE-educating.
A number of us recently gathered online to discuss James O’Shaughnessy’s book, What Works on Wall Street. What works on MAIN Street?
Patience. Discipline. Discovering the best companies, at the best prices, with our friends. Too many cooks? Not even close! It’s the best type of cooking capitalism has to offer.

For those of you who watched the Super Bowl (and those of you who watch the commercials and halftime show), recall that Katy Perry rode into the stadium for the halftime extravaganza on a huge lion, singing about roaring like a champion?
One of her hit songs is entitled, This Is How We Do.
This is how we do… yeah, chilling, laid back
Straight stuntin’ ya we do it like that
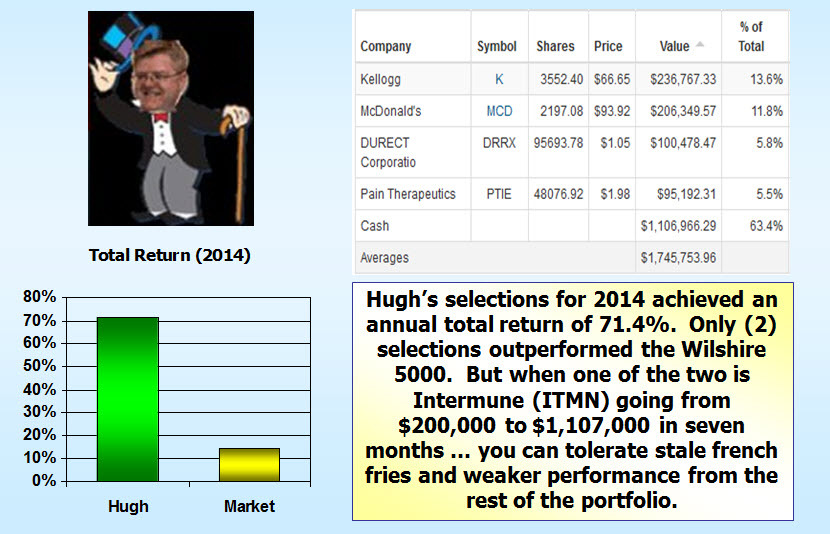
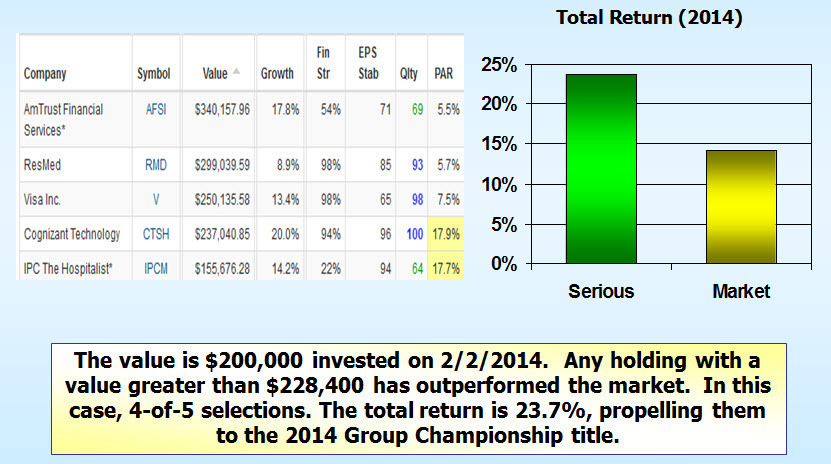
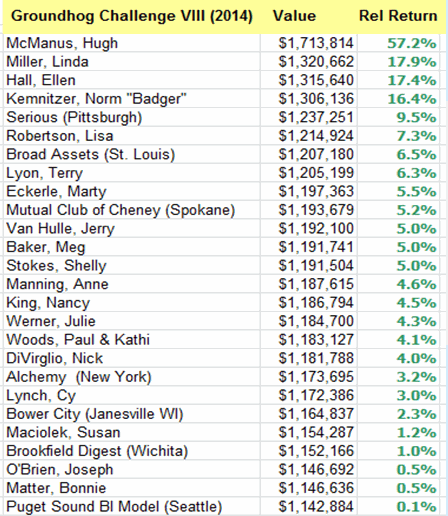
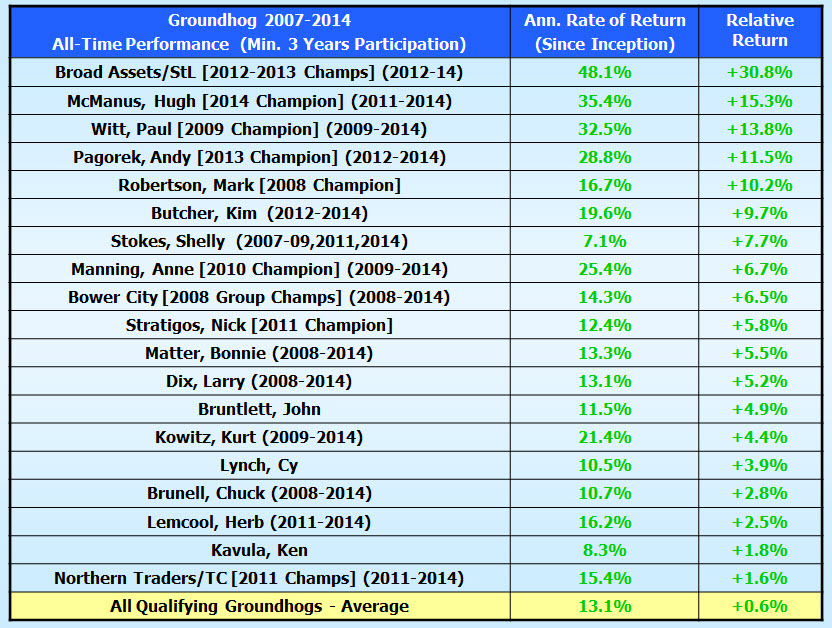
I didn’t know what “stuntin” actually referred to but based on this urban dictionary rendition, we think it applies to all things Groundhog. Hugh McManus of Pasadena and the Serious Investment Club of Pittsburgh are the latest in a long line of stuntin legacy — taking home top honors for Groundhog Challenge VIII in the individual and group categories.
Collectively, we “chill, lay back” and select a basket of 5-20 stocks that will go unchanged over the course of the Groundhog Calendar. Over the years, we’ve noticed very little swinging for the fences. A few participants will try to isolate a promising deep value situation with a potential catalyst that could deliver over the course of a year. But for the most part, the participants select high-quality stocks that would be suitable for the long term, a time horizon measured in years, if not decades.
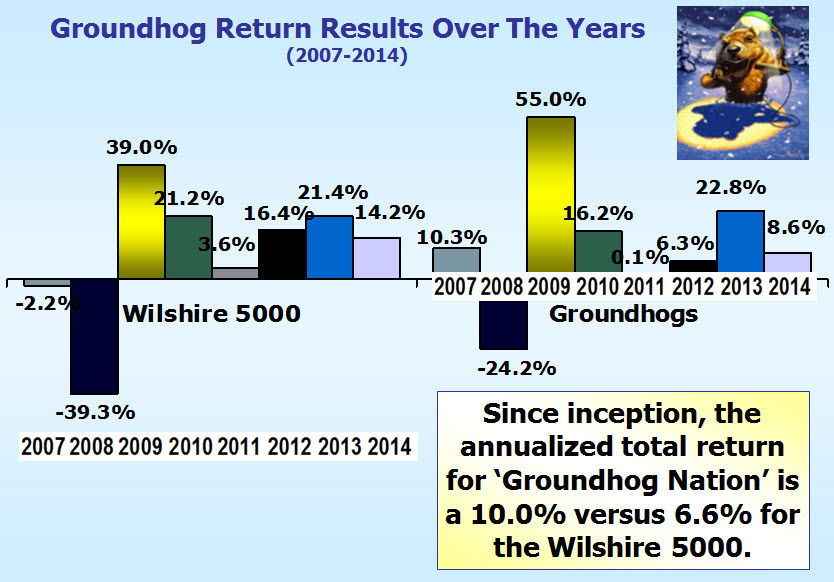

The Groundhog Challenge is our 9-year running stock picking contest that runs from Groundhog Day to Groundhog Day. The results over the years have been pretty special and we’ll be back soon with the 2014 finish line results. The “Heavy Hogs” is the annual tracking portfolio for the consensus favorites.
The overall results for Groundhog VIII (2014) were … for lack of a better word, a little stinky. (I have high expectations and you’ll see why when we report the comprehensive results)
Collectively, we stumbled to multi-year lows for relative return and accuracy.
Not all of us were blessed with the luck of the Irish like Mr. McManus, so it probably makes sense to remind ourselves that there seems to be better performance in “numbers.”
As of 2/1/2015, 10-of-the-20 (50%) most frequently chosen stocks by 2014 Groundhoggers had outperformed the general stock market over the annual contest – racking up an average return of 18.1% (+3.9% RR) led by Apple (69.4%)
When nobody else is selecting that hidden gem you’ve identified, be careful. Confirm your assumptions. And when legions of our your friends hold their nose at your selection (think BODY) — you might be right, but ignore them at your peril. It’s also worth noting that there’s no escape hatch in this contest version. You’re stuck with the selections made in early February for 52 weeks until Punxsy Phil stirs again.
Don’t get me wrong. This lack of an escape hatch is often a virtue. We generally believe that hyperactivity in “investing” is erosive and history rhymes with us.
But when the consensus selections outperform the vast majority of hundreds of participants, it’s probably worth heeding the group. Investing with your friends can be a very good idea.

These Are a Few of our Favorite Screens
For the January Round Table, we spent some time with a few screening resources in the quest for some good ideas for further study. We’ll collect them here and tabulate the overall results, using a version of the coach’s poll for collegiate sports (20-16-12-8-6-4-2-1 for votes) and see what percolates to the top of the charts.
Screens Featured
The Top 25

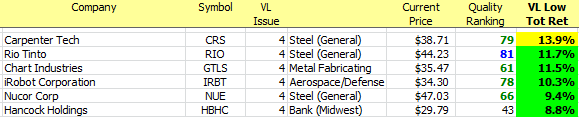
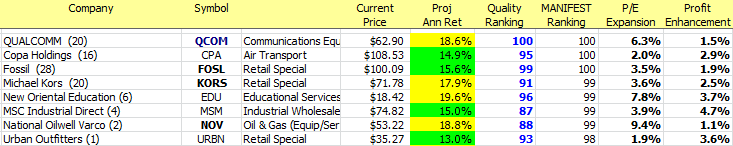
This screen is based on a recognition that the two most important characteristics of any investment are (1) the return forecast and (2) the quality of the company. The MANIFEST Rank is an index that combines the two characteristics with essentially equal weighting. Here are the top eight results of a current screen based solely on MANIFEST Rank > 99.44

This is one of the more popular screens that we’ve covered over the years. It generally works best after a bear market has raged for a while.
It focuses on some of the primary drivers for higher long-term return forecasts. The three things we’re looking for are:
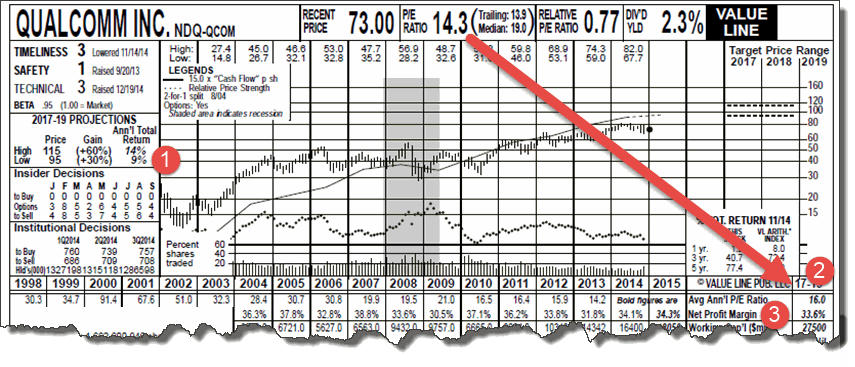
Using one of the current leaders for this screen, we note that Qualcomm (QCOM) has a low return forecast of 9-10% according to Value. Keep in mind that the average low return forecast for the Value Line universe is 3-4%.
We also see a future P/E of 16.0x versus current levels of 13-14×.
Value Line expects “flat” net margins in the 33-34%. The reason this triggered in our database is that the analyst consensus is more optimistic than Value Line when it comes to future profitability for Qualcomm.
For more on this Triple Play screening approach, check out the archived presentation at: https://www.manifestinvesting.com/forums/14/topics/2778

This screen is inspired by our repeat group champions, the Broad Assets investment club of St. Louis. Broad Assets repeated as champion last year and is running 2nd this year as Groundhog VIII comes to a close in a few days. We featured the concept behind this screen in our Victory By Escape Velocity? cover story from May 2014.
Nutshell: If you really believe that stock price follows earnings, it makes all the sense in the world to look for those conditions.
In this case, we focus on year-over-year (2015 over 2014) earnings estimates and focus on the companies with the strongest upside. We also limit the field to companies that have shown increasing earnings for each of the 4-5 years displayed. (All year-over-year figures > 0%)
Lannett (LCI) continues to have strong expectations, but it will be interesting to see what Broad Assets does with LCI in the future as 2016 EPS estimates are finally plateauing. We also note the presence of Balchem (BCPC), a long time favorite of another St. Louis club — Mutual of St. Louis and our friends Jay and Ray.

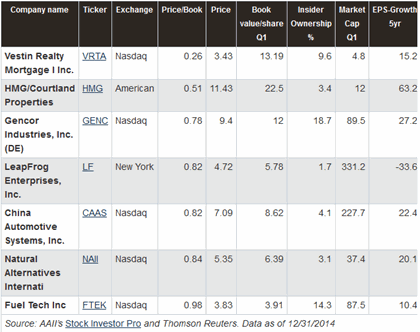
The American Association of Individual Investors (AAII) features a number of screens based on famous investors and methods including one of our time-honored all-time favorites, Walter Schloss.
Screening Criteria

Joseph Piotroski, associate professor of accounting at Stanford University’s Graduate School of Business, undertook a study of low price-to-book value stocks to see if its possible to establish some basic financial criteria to help separate the winners from the losers.
The result, a favorite screening method among AAII members, is the top-performing screen since inception nearly 20 years ago.
Low Price-to-Book-Value
Piotroski’s work starts with low-price-to-book-value stocks. Price-to-book value was a favorite measure of Benjamin Graham and his disciples who sought companies with a share price below their book value per share. While the market does a good job of valuing securities in the long-run, in the short-run it can overreact to information and push prices away from their true value.
Measures such as price-to-book-value ratio help to identify which stocks may be truly undervalued and neglected.
Most frequently chosen Outperform Ratings by the CAPS All-Stars (successful stock pickers) that have 5-Star ratings on 1/29/2015.

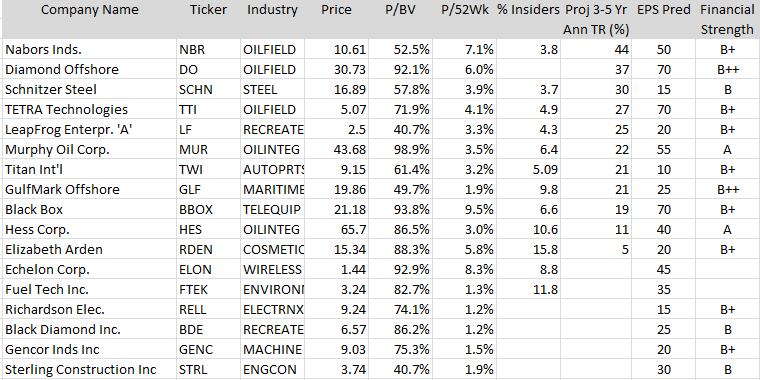
Hugh likes to shop for high-quality companies when they are trading near their 52-week lows. He keeps a fairly short list of qualified accumulation targets for his personal portfolio. We covered this screening concept here: Gone Fishing … Patiently
What makes this version of the list “modified” is that we’ve applied his shopping methods to the 6000+ companies in the Value Line database, limiting qualifiers to Financial Strength ratings of B+ (or better) and a return forecast (VL 3-5 Yr Proj Ann Tot Return or PAR) to double digits, in general, or better. (Data Source: Value Line Investing Analyzer)

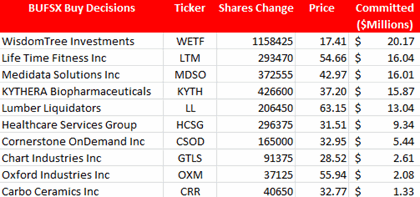
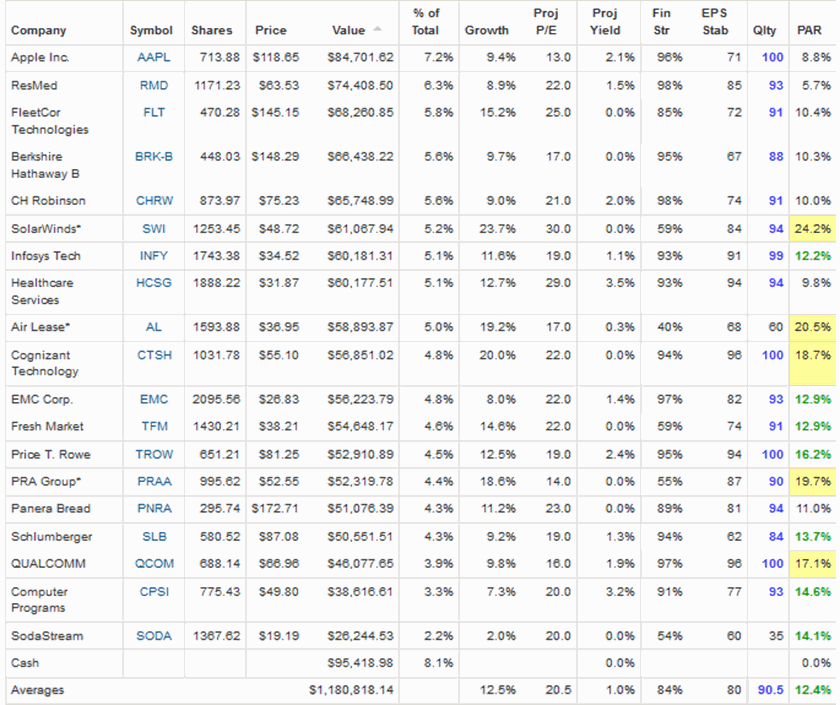
One of our favorite sources of ideas are successful/active fund managers. One of our favorite small company mutual funds is Buffalo Growth (BUFSX) shepherded by Kent Gasaway and his team.
The accompanying table (exported from Morningstar/Premium Version) provides a summary of buy/accumulate decisions made over the last quarter by the Buffalo team.
KYTHERA Biopharmaceuticals (KYTH) is a clinical-stage biopharmaceutical company focused on the discovery, development and commercialization of novel prescription products for the aesthetic medicine market.
The stocks featured during the January Round Table:
The audience selected QUALCOMM (QCOM) from the candidates.
MWI Veterinary Supply (MWIV) was “sold” from the tracking portfolio during the session. MWIV is being acquired by Amerisource (ABC) for $190. Ken Kavula selected MWIV back on 11/29/2011 for $64.79, so $1000 became $2969 — an annualized return of 40.5% and a relative return of +22.9% versus the Wilshire 5000.
Archived Recording of January Round Table
The recording of this event is now available on the event page:
https://www.manifestinvesting.com/events/163-round-table-january-2015
It can also be found on YouTube at:
If you enjoy this session, please leave us a comment or click Like on the YouTube page. Thanks!