This Week at MANIFEST (12/26/2014)

Merry Christmas! Bless Us, EVERYONE!

Holidays. We have much to be thankful for … notably the smiles on the faces of investors who have persisted through the Great Recession and experienced/realized fairly massive returns over the last few years. As we approach the end of our 10th year at Manifest Investing, all of us extend the warmest Seasons Greetings to all of you!

We’re already looking forward to celebrating our 10th birthday — and the launch of our 11th year — as Groundhog Day 2015 (2/2/2015) approaches. We’ll celebrate in a variety of ways, continuing to extoll the virtues of investment clubs and community-centered investing. The Round Tables will be part of that and we’re thankful for the contributions of Ken Kavula, Cy Lynch and Hugh McManus. We’re equally thankful for our guest damsels and knights: Kim Butcher, Herb Lemcool, Susan Maciolek, Anne Manning, Matt Spielman, Nick Stratigos … and last but certainly not least, our audiences who cast their votes monthly. You guys are the BEST.

We’re planning additional festivities which you’ll be hearing about soon. And you can listen for the sound of reindeer on your roof knowing that you’re in the hands of Kurt Kowitz, our technology manager. We’ve said it before, but without Kurt, the cost to deliver Manifest Investing to you would increase by at least one digit, maybe two. We’ll be unwrapping some cool gifts soon … and the prototype tinkering with the Equity Analysis Guides is likely the tip of a features iceberg. Thanks, Kurt!

For now, we nudge you as you unwrap this week’s batch … and we share a compendium of correspondence. You are not alone.

Merry Christmas, everyone!

A Bridge To Better Understanding

We’ve shared similar letters of consternation from investors in the past … and they come in many flavors. One of our all-time favorites was our visit to Narnia and our suggestion that The Couch Is Alright. Another memorable exchange came with “Nell” as we helped her to Make It Through The Night.

Where am I going wrong? I check out a stock, like it, and check it out on Manifest Stock Research. It looks good, you like it too. For confirmation I dig deeper — and [audit and verify assumptions using MyStudy]. Next thing I know, I feel like I get shot down when you show four or more reasons why the company is not worth an investment and say the quality is not to our standards. Is one screen looking at long term and the other at short term? Are you practicing April Fool tricks five months early?

We asked for an example. Chicago Bridge & Iron (CBI) was provided. CBI is actually a very compelling opportunity. There are some strong market drivers, long term. And the company is part of this week’s update batch — so let’s take a closer look.

I’m wondering where we differ. The PAR is 20-25% or so — making it somewhat speculative. The global recession has taken its toll with a fairly substantial price drop over the last several months. (From $89.20 down to $37.78 … -58%)

I don’t know but I wonder if investors and pundits are troubled over the Shaw acquisition?

Here’s a look at a Value Line data-based Equity Analysis Guide for CBI:

Be sure to account for the Shaw acquisition in your analysis. (This means you probably have to ignore anything before 2012 on a traditional SSG.) The step change in sales in 2012 was due to buying Shaw. When imagining what the future holds, be sure to emphasize the information that deals with the new, combined, company.

That could also lead to some significant differences between your study and the analyst consensus.

S&P has a fair value of $80.80 (recently adjusted downward from $87), so they think it’s significantly under priced at $41.

Thanks for the suggestion but, while I only mentioned one example when writing you, the same thing occurred over fifteen investigations. It leaves you with the feeling the entire market is overpriced so it might be better to hibernate until the pull back. I was particularly disturbed over CBI as they seemed a good candidate. Perhaps Lady Luck will lead me to a candidate where research and analysis will both agree. Thanks for your input.

Although luck is definitely involved in investing … we can look beyond Lady Luck a bit.

I think we’re seeing a symptom that’s related to the recent run in stock prices. This has been going on at the same time as an erosion of fundamentals. We’ve commented on this before — noting that in many cases, the only way to realize these return forecasts is if relatively high P/E ratios come home to roost.

I think CBI is a great candidate. The price has dropped enough to capture the attention of Hugh McManus. (grin)

Seriously, for a non-core stock (but one with relatively high quality) we need to demand a higher return forecast when considering purchase. We also must admit that a persistent or deepening recession will do things to CBI that are similar to 2008-2009. The stock price suggests, at least to me, that many people consider this to be a work already in progress.

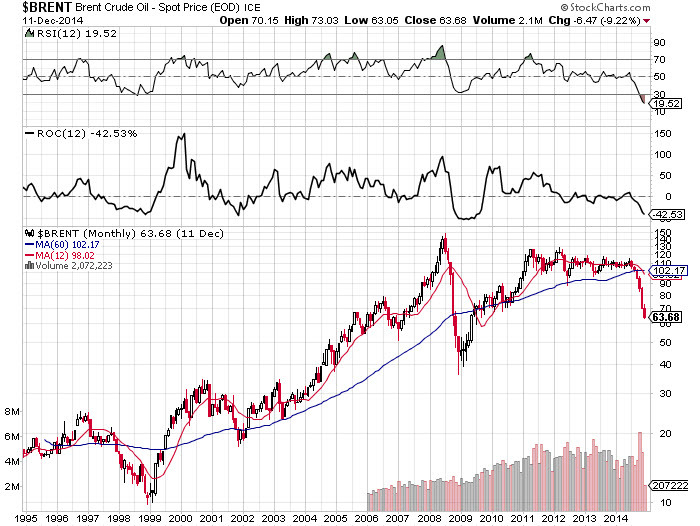
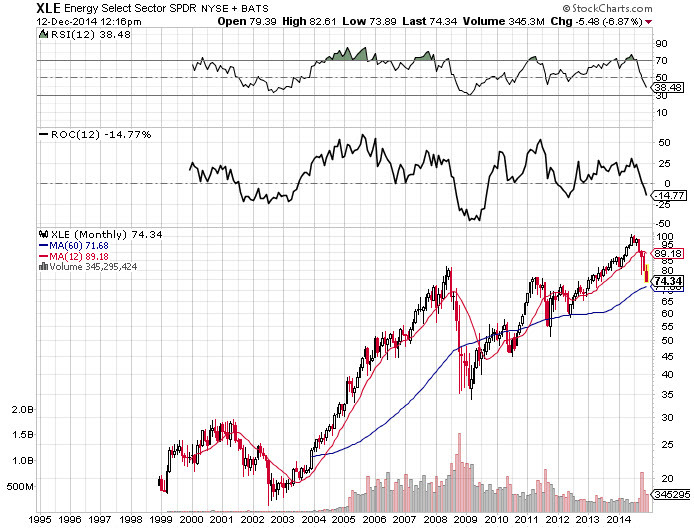
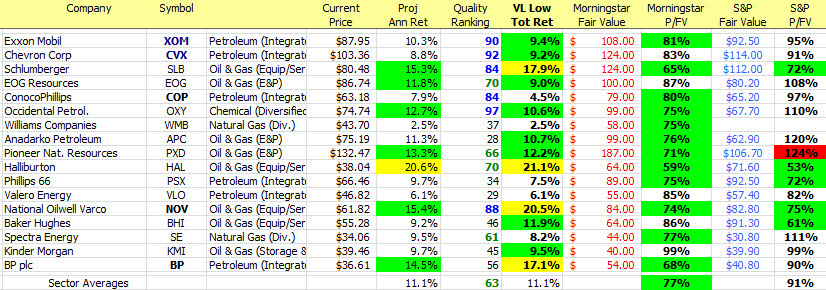
If they’re wrong, it’s a heckuva buying opportunity. And for a long term investor with a long term perspective, CBI is probably a lot like BP (BP), Schlumberger (SLB) and others in the oil patch these days. The next year or two could be rough and represent an opportunity for accumulation. But make sure the companies are built for survival if you decide to “go there.”

We feel your frustration but we still believe that a good StockSearch, directed at high-quality companies with elevated return forecasts can do a lot to populate the area underneath just about any investing Christmas tree.

Coming Events and Attractions

Our expanded coverage of the update stocks this month continues as part of our quarter long test drive of this feature and the studies and shared ideas it delivers. Please tell us what you think and feel free to join in the Forum discussions for the deeper dives on some of the stocks.

Save the Date: The December Round Table will be held on December 30 at 8:30 PM ET. Register via: https://www2.gotomeeting.com/register/256833802

Round Table Tracking Portfolio

Stocks Likely To Be Covered:

  • Chicago Bridge & Iron (CBI)
  • Copa Holdings (CPA)
  • Qualcomm (QCOM)

Companies of Interest: Value Line

The average Value Line low total return forecast for the companies in this week’s update batch is 4.7%.

The number of companies with slightly reduced fundamentals combines with the price increases over the past month to produce some fairly low return forecasts.

Trex (TREX) has been a personal favorite since my Better Investing days … and it leads a lonely group of companies with bolstered fundamentals. As a reminder, we monitor changes in the long term forecasts by Value Line and share those that have been adjusted 20-25% or more (up or down) as “Materially Stronger” (Up) or “Materially Weaker” (Down). We consider this a best practice and a nudge for stock watchers or shareholders to update/audit existing analyses. In some cases, it may trigger a study of opportunity.

Materially Stronger: Trex (TREX)

Materially Weaker: Owens Corning (OC), Layne Christensen (LAYN), Tile Shop Holdings (TTS), Enernoc (ENOC), Rayonier (RYN)

Standard Coverage Initiated:

Discontinued: Kimball (KBALB), Foster Wheeler (FWLT), TIBCO Software (TIBX), Concur Technologies (CNQR), Conversant (CNVR), Compuware (CPWR), URS (URS)

Companies of Interest: Morningstar

The average price-to-fair value (P/FV) ratio at Morningstar for the companies in this week’s update batch is 106%.

Companies of Interest: S&P

The average price-to-fair value for the companies in this week’s update batch is 105% — according to S&P.

Market Barometers

The median Value Line Low Total Return (VLLTR) Forecast is at 3.4%, plummeting from 4.2% last week as the Thanksgiving Swoon gives way to a Christmas Rush of multiple 1-2% daily gains in the overall market.

Stocks to Study

The following update stocks are ranked in the top 10th percentile of all companies we follow (MANIFEST Rank > 90):

Manifest Investing is a subscription site (ONLY $79/year for individual investors).  Contact us (via manifest@manifestinvesting.com) if you would like to explore our resources as an investment club.  We offer group discounts to clubs.  Discover and explore our research on stocks and funds, our seminars and tools for portfolio design & management.  Experience the demonstrations of a 7-decade old time-honored philosophy and method that has supported legions of long-term investors.  Go to http://www.manifestinvesting.com and create a trial account today.  Send us an email if you’d like to access a FREE fully-functional test drive through 2/28/2015 without providing a credit card.  Merry Christmas!

Energy Patch: Black Gold or Minefield?

The recent swoon in the energy sector has prompted some to suggest that it’s time to back up the tanker truck — what could possibly go wrong? “All of these companies are on sale.”

Not so fast. As we pointed out in last week’s update, we expected reductions in forecasts from the likes of Morningstar and others and it’s gently underway. As a case in point, Morningstar’s fair value for Schlumberger (SLB) has been recently reduced from $145 to $124. Other companies seem to be following suit. S&P already had suppressed expectations (relative to Value Line and Morningstar) and they have actually trimmed a number of estimates.

As the following graphic shows … after an extended trading range, the price of $BRENT has been pummeled, now down some -42.5% for the trailing 52-weeks:

The S&P energy sector fund (XLE) has been punished also — with some lag — and with less damage, at least so far, as the sector leaders are down -15% over the trailing 52-weeks:

There are 44 companies in XLE and we’ve listed the top 16 here (with one exception … BP is not part of XLE … but we listed BP here in response to the Forum discussions) and you’ll see a number of industry leaders and stalwarts. The majority of companies in XLE are components of the S&P 500. Note that these 16 companies account for 75% of the index performance and the top three: Exxon Mobil (XOM), Chevron (CVX) and Schlumberger (SLB) account for 40% all by themselves.

Energy Sector Sample. Projected Annual Return (PAR) is the consensus forecast via MANIFEST. Quality ranking is the percentile ranking of our quality characteristic based on financial strength, EPS stability and relative growth and profitability. VL Low Tot Ret is Value Line’s 3-5 year low total return forecast, adjusted for change in price and/or time horizon. Morningstar P/FV is the ratio of current price to Morningstar fair value.

The Morningstar P/FV cells that are highlighted are at least one standard deviation from the median P/FV ratio. These can be thought of as potentially “on sale” or worthy of study. The same highlighting applies to the S&P entries. The solo entry highlighted in red, Pioneer Natural Resources (PXD) has a P/FV at least one standard deviation greater than the median — potentially a selling candidate.

Our overall average forecast for the group matches the Value Line low total return forecast. The fair value reductions and continued slide in stock prices deliver an average Morningstar P/FV ratio of 77% but we’d expect further moderation of fundamentals (continued reduction in fair values). S&P is still much less optimistic (91%) with relatively few triggering the highlighted status.

Companies deemed most worthy: Exxon Mobil (XOM), Schlumberger (SLB), National Oilwell Varco (NOV), Halliburton (HAL) and BP (BP).

Sources: Value Line Investment Survey, www.morningstar.com, Standard & Poor’s

Is it time for some Christmas shopping?

Based on a multi-year chronicle for XLE, the return forecast has now reached a multi-year high — suggestive of one of the better buying opportunities over the last 7-8 years.

As always, quality matters … and the $/bbl trends are not supportive of higher cost producers, like the offshore drillers (yet).

Xle chronicle 20141212

“Oil Patch” Screening Results

… because it’s not just oil. In fact, there may be some opportunity in companies that are less directly affected by the OPEC smoldering. In any case, here’s a quick shop until you drop for the energy sector:

Oil patch screen 20141212

This Week at MANIFEST (12/5/2014)

Wild Rides, Cyber Monday!

That dull thud we all heard over the Thanksgiving holiday was the energy sector turkey. As shown above, the energy sector took it on the chin to the tune of an 11% swoon as OPEC maintained production levels providing some hefty turbulence. As the following two charts illustrate, few companies in the group were immune from the carnage. Exxon Mobil (XOM) is actually one of the tamer examples from the sessions as these 5-day charts show the disruption.

But it appears that Monday is already bringing some relief … or at least a frozen turkey bounce for some of the higher quality companies in the group …

This week’s update batch (Issue 3 in the Value Line Investment Survey for those keeping score) includes a number of the affected companies. We note several things. First of all, the forecast fundamentals for a number of these companies were already being trimmed by the Value Line analysts. It will be interesting to watch over the next quarter to see if expectations continue to be reduced. We’ve often noted a bifurcation between Morningstar and S&P when it comes to the cyclical stocks — particularly in the energy industry. In this case, Friday’s swoon delivers a price-to-fair value ratio of 91% at Morningstar, essentially screaming something on the order of a Black Friday rush. S&P says “not so fast.” The S&P price-to-fair value ratio is actually greater than 100% (101%) and S&P has been steadily and materially reducing their fair value estimates for the energy stocks over the last few weeks and months. We tend to favor the S&P cyclical expertise in a tiebreaker … so we’d urge caution and an insistence on high-quality during opportunity shopping.

As Hugh has pointed out, BP (BP) was among the tumblers and probably rates fairly well as a long-term opportunity. Exxon Mobil (XOM) is among the study candidates also along with some of the other integrated blue chippers. Keep in mind that Hugh normalizes versus the 52-week low, seeking opportunities when stock prices are near their trailing 52-week lows. Hugh’s spreadsheets compare current prices to their 52-week lows. The accompanying charts for S&P and Morningstar do the same thing — but the comparison is between the current price and the fair value. Less than 100% is potentially attractive, unless it gets “too low.” Stocks in the sweet spot would likely fall into a P/FV ratio of 80-90% representing a discount to fair value of 10-20%.

Coming Events and Attractions

We will catch up on the final November columns and we’ll be out with the December issue of Expected Returns this week.

We’ll continue our expanded coverage of the update stocks this month as part of our quarter long test drive of this feature and the studies and shared ideas it delivers. Please tell us what you think and feel free to join in the Forum discussions for the deeper dives on some of the stocks.

Save the Date: The December Round Table will be held on December 30 at 8:30 PM ET. Register via: https://www2.gotomeeting.com/register/256833802

Companies of Interest: Value Line

The average Value Line low total return forecast for the companies in this week’s update batch is 2.8%.

Materially Stronger: Zebra Technologies (ZBRA)

Materially Weaker: Rhino Resource Partners (RNO), Clean Energy Fuels (CLNE), Gulfmark Offshore (GLF), UGI (UGI), Kronos World (KRO), Marathon Oil (MRO)

Coverage Initiated: Methanex (MEOH), Concho Resources (CXO)

Discontinued: Walter Energy (WLT)

Companies of Interest: Morningstar

The average price-to-fair value (P/FV) ratio at Morningstar for the companies in this week’s update batch is 91%!

It will be interesting to see if the Morningstar analysts make any downward adjustments in fair value for the energy stocks during this turbulent ride.

Southwestern Energy (SWN) checks in at 55% — a stock that Morningstar apparently believes is significantly undervalued.

Companies of Interest: S&P

The average price-to-fair value for the companies in this week’s update batch is 101% — according to S&P.

There are always a couple of things to check during a swoon. One is whether the perceived opportunity is too good to be true. Companies with P/FV ratios less than 70% … or PAR values greater than 16% come to mind. The other is when companies are guilty by association when they don’t deserve it. Is it possible that Imperial Oil (IMO) should be less affected?

Ecolab (ECL) makes the S&P short list at a P/FV of 89% and a quality ranking of 86 — suggesting that it may be worthy of further study.

Market Barometers

The median Value Line Low Total Return (VLLTR) Forecast is at 3.7% — unchanged from 3.7% last week.

Stocks to Study

The following update stocks are ranked in the top 10th percentile of all companies we follow (MANIFEST Rank > 90) and this display provides a wide berth of dueling opinions, as usual.

NAIC National Convention … Gone Shopping

As the Better Investing long-term investing community celebrates its 63rd annual convention, here are some shopping ideas for stock studies.

High Quality & Return Forecast Screening Results

The following high-quality stocks have outsized return forecasts as featured on the Stocks page today at www.manifestinvesting.com.

Schaumburg sweet 16

Mucho Momentum, Persistence

As featured in our cover story for May (2014), this screening for non-core stocks was inspired by our repeat group champion in our annual stockpicking contest, The Broad Assets Investment Club of St. Louis.

Their selection of Lannett (LCI) tripled in 2012 and tripled AGAIN in 2013.

This listing attempts to identify companies with breakout earnings (early stage in their life cycle) with outsized earnings forecasts for 2014 and 2015.

Ivory Screen

These are the top percentile stocks based on a combination ranking of return forecast (PAR) and quality — and not limited to median return forecast (MIPAR) plus ten percentage points.

Ivory screen 20140515

All Right. All Right. All Right. AMEN!

All Right, All Right, All Right … AMEN!

It was vintage Matthew McConaughey on Sunday night as he thanked God first for his Best Performance by An Actor in a Leading Role in his acceptance speech. (You could have heard a pin drop in the Hollywood audience.)

We have noted here previously that McConaughey nearly stole the show at Wolf of Wall Street despite a sparse few minutes at the very beginning of the movie. I will also confess that I was relieved that Leonardo, Jonah Hill, Meryl Streep and Julia Roberts remained in their seats all Sunday night. Maybe there’s more to thespian excellence than a spewing epidemic of the F-word.

I have not seen Dallas Buyer’s Club, recipient of several awards including Matthew’s but I probably will. Our own buyer’s club, this community of long-term investors, celebrated its own annual achievement awards this past weekend too. Manifest Investing and the Mid-Michigan chapter of NAIC teamed up to present this year’s red carpet, black tie, and latte-toting pajama party on Saturday morning. The Guest Knights (Herb Lemcool, Matt Spielman and Nick Stratigos) stole the show and the Audience toted home their first Golden Knight. It won’t be their last. The Wisdom of Crowds, Communities and Clubs is formidable, indeed. The awards for 2013:

  • Best Stock Selection (2013): Audience Choice, Ken Kavula, Cy Lynch for Priceline (PCLN)
  • Best Stock Selection (All-Time): Hugh McManus for Southwest Airlines (LUV)
  • Best Picture: Mark Robertson for Crossing Wall Street, highlighting the exploits of one Eddy Elfenbein
  • Best Accuracy (2013): Guest Knights Herb Lemcool and Matt Spielman
  • Best Accuracy (All-Time): Guest Knights Herb Lemcool, Matt Spielman & Nick Stratigos
  • Best Relative Return (2013): Ken Kavula
  • Best Relative Return (All-Time): Guest Knights Herb Lemcool, Matt Spielman & Nick Stratigos

A wonderful community steeped in collective (and shared) wisdom. Join us for the next Round Table on March 25.

All right. All right. All right. AMEN.

Companies of Interest

I have troubling drumming up much excitement for Issue 3 of the Value Line Investment Survey.

Maybe it’s the average Quality Rank of 57. Or the average EPS Stability of 55.

This week’s update batch is chock full of companies that get whipsawed by economic tides … and that makes them non-core in our investing universe. There are a few exceptions — like some of the specialty chemical companies, some of David L. Babson’s places to remain vigilant for price swoons. But for the most part, these companies can be treacherously volatile on the operating performance side. And that obviously translates to the stock prices. It’s generally a pretty good idea to double check against S&P fair values for the companies in this batch.

Materially Stronger: Interdigital (IDCC), Chesapeake Energy (CHK), Avery Dennison (AVY), Magellan Midstream (MMP), Zebra Technologies (ZBRA), Minerals Technology (MTX)

Materially Weaker: Encana (ECA), American Vanguard (AVD), Arch Coal (ACI), Boardwalk Pipeline (BWP), Alpha Natural Resources (ANR), Walter Energy (WLT)

Morningstar P/FV Nudges

The average price-to-fair value (P/FV) for the companies in this week’s update batch — according to Morningstar — is 99%.

S&P P/FV Nudges

The average price-to-fair value (P/FV) for the companies in this week’s update batch — according to S&P — is 115%. (!) The two research giants clearly have a difference of opinion this week.

Market Barometers

The average Value Line low total return forecast held steady at 3.4%, unchanged from last week.

Coming Attractions

This coming Saturday (March 8), we’ll spend some time with the retirement savings plan for government employees in a FREE webcast. We’ll take a look at the items on the menu — as we do for any qualified plan — take a look at how these components have performed, and some perspective on the outlook.

Time: 10:30 ET

Please feel free to share this opportunity with friends and family who have access to the Thrift Savings Plan. “Seating” is limited.

Registration: http://www.manifestinvesting.com/events/146-a-few-moments-with-thrift-savings-plan-march-8-2014

Round Table: Standing Room Only?

Queue Dozing?

If this persists, we may have to go to assigned seating for Pavilion seats at next year’s Round Table Awards?

Some of these long-term investors have camped out to save their place in the queue.

“Dude, if you’re gonna go with Southwest Airlines cattle car seating programs, we’re going to have to resort to this. But no worries, we do this all the time at places like Duke or Michigan State University.”

Yes, it’s true that Southwest Airlines (LUV) is in the running for one of the most prestigious categories on Saturday morning.

“No. We’re not cold. It’s not like we’re doing this in Michigan … or New York … or Wisconsin. This is a cyber event, Silly! Besides, word on the street is that Ken Kavula has been red hot with his Round Table picks lately. We want to know how hot.”

True. But you’ve got the pajamas optional part right. Attendees are welcome to drop in with a cup of coffee and don their favorite casual attire. There is no truth to the rumor that Kathy Griffin or Joan Rivers will be doing fashion commentary tomorrow. I wouldn’t rule out a few pushups by Jack Palance, particularly if he’s nudged by Billy Crystal or Ellen Degeneres.

There’s still room and long-term investors are welcome and invited to join us. Yes, you may bring your sleeping bag.

Date: Saturday — March 1, 2014
Time: 11 AM ET (but the red carpet festivities will start at 10:30 AM ET)
Register: https://www.gotomeeting.com/register/475449410

Walgreen (WAG)

Walgreen (WAG) will likely be suggested as a sell candidate during the February Round Table. The recent surge in stock price ($68) results in a return forecast of approximately 3%. The August-2010 selection was the first Best Selection winner at the first red carpet gala. WAG has been selected by three of us, with the four most recent selections by Hugh McManus.

The stock is overbought with a relative strength index (RSI) of 79.6 and momentum (ROC) is considerable as the stock price has advanced 70.3% over the trailing 12-months.

Make no mistake.

This is an excellent company — and it has been very, very good to us.

Our $7000 invested in Walgreen in the Round Table tracking portfolio is now worth $15,801.

Closing out these positions will lock down 7-of-the-top-20 all-time results for our Round Table since inception.

What is your outlook on Walgreen? Would you sell? Would you consider covered calls for an exit strategy?

This Week at MANIFEST (2/21/2014)

Turning The Page

It’s that time of year when Value Line ratchets ahead to the next year on their 3-5 year forecasts. It’s also time when the analyst consensus estimates at places like finance.yahoo.com begin to provide sales and earnings forecasts for 2015.

At Manifest Investing, we’ve long held the belief that these forecasts should be embedded in our assessment of the long-term trend and characteristics … and we commence doing precisely that. The rear view mirror is important. We’re not saying that investors should ignore the road behind companies — just that a prudent amount of emphasis on the windshield is also important.

Stocks to Study

The Issue 1 update companies in the accompanying chart have the highest rankings based on the combination of return forecast and quality ranking. This display was inspired (and requested) by Irina Clements in our Saturday morning session this past weekend — A Few Moments With … Sandboxes.

The companies are ranked in descending order of Combination Rank with a minimum of 90 (top decile) of all stocks covered. The underlying fundamentals (growth, profitability and projected average P/E ratio) are displayed along with the analysis opinions of Value Line, Morningstar and S&P.

Happy Valentine’s Day, MANIFEST Nation!


Rolling Over … Watching 2015 Roll In

Happy Valentine’s Day, MANIFEST Nation!

With Issue 13 of the Value Line Investment Survey landing this week, we’ll soon be getting our first look at some of those 2015 sales and earnings forecast — likely starting next week.

We’d like to be able to say that the carnage has abated, but we can’t. The stealthy reductions in expectations continue and the 2014 forecasts are considerably weaker to start the year than we generally see. Keep in mind that these forecasts have historically eroded from optimistic starting gate positions that steadily get smaller as the calendar pages turn. It’s a pretty unusual year where this is not the case.

We also note the population of Materially Weaker companies continues to exceed the Materially Stronger based on quarter-over-quarter changes in the Value Line long-term forecasts. We would not have been surprised to see this slow down a bit, but as displayed below, the number of weakening situations continues to outpace opportunity.

Here’s a look at the Net Profitability profile and trend for the Value Line industrials as 2013 locks in (actual results) and readies for the 2015 roll call. It’s not horrific, but it is one of the reasons I still say that people who spoke and respected recessionary pressures during 2013 were at least partially right. The current economic recovery, although steady, is still quite lackluster.

Companies of Interest

We’ll do a quick profile of KKR (KKR) based on the Value Line low total return forecast and solid overall condition of the company. We also note that Cognizant Technology (CTSH) and Infosys Tech (INFY) continue to portend better days ahead.

Western Union (WU) is favored at both Morningstar and S&P in this week’s batch and it has served Kim Butcher quite well as a long-time Round Table selection.

Materially Stronger: LinkedIn (LNKD)

Materially Weaker: EZCorp (EZPW), Mantech International (MANT), Federated Investors (FII), Amazon (AMZN), Fusion-io (FIO)

Morningstar Price-to-Fair Value Nudges

The average P/FV for the companies in this week’s update according to Morningstar is 108%.

Standard & Poor’s P/FV Nudges

The average P/FV for the companies in this week’s update according to S&P is 100%.

Market Barometers

The Value Line low total return forecast is 3.2%, up from 3.0% last week.

3M Company (MMM) & The Buyback

3M announces $12B buyback.

3M (MMM) is launching a $12B stock buyback program that will replace the diversified-machinery company’s existing authorization and is good for repurchasing 14% of its outstanding shares. 3M spent $5.2B on buybacks in 2013, including $1.7B just in Q4. Will the firm issue new debt to pay for additional repurchases? It ended Q4 with $4.9B in cash/investments and $6B in debt.

MMM. Hmmmm?

If you were a financial advisor to MMM, would you recommend that they continue/expand their share buyback program?

Why or why not?

Response #1

It seems to me that if the long term after tax cost to borrow exceeds the dividend yield then buybacks are not a good idea. Looking at the numbers that seems to be the case. In addition, I view 3M as over-priced at the current quote of $128/share [2/5/14 intra-day price]. Morningstar rates 3M @ 2 stars, which suggests that it is over-priced. They call FV @ $120. The 52 week range is $101 to $140. Yes, it is down from the high, but I see is as too expensive to buy back at current prices.

In non-financial terms,3M has always been known as an innovator. You would think that an innovative company could find opportunities to profitably grow the company for the long term benefit of the stockholders.

By the way,I’m not a fan of buybacks. Firstly, it is a financial engineering fad – everyone is doing it – so we must follow. Secondly, to me, it signals a company that is stagnating and can’t find opportunities for quality internal growth.

Response #2

Here is one rational for why borrowing to buy back shares makes sense.

Lets assume the CEO’s compensation is based upon EPS achieved. i.e. Stock options. So if MMM borrows $12B at an interest rate of 4% the annual interest to be paid would be about $480M. They could expense about 30% of this as a tax deduction so the real cost would be about $336M. The PTPM of MMM is about 21%. So MMM would borrow money at 4% and with a PTPM of 21% this would provide a substantial boost to EPS. If MMM bought back shares at $130 the $12B would buy back about 92M shares or about 13.7% of outstanding shares. This would seem to boost 2014 EPS to about $7.64 even without any additional EPS growth from the company. The CEO makes a hefty profit and in case the board does not think this is a good idea the CEO arranges for the board to obtain some stock options as well. Also the shareholders now own a larger piece of the MMM pie. So everyone is happy.

Now some may say borrowing $12B, raising the total MMM debt to about $18B may sound like taking excessive risk. However others may counter with the MMM business being a very stable business generating about $4B in FCF per year and taking on more debt is simply reasonably increasing the leverage to enhance shareholder returns since share prices are usually based upon EPS growth.

I do admit $2B sounds like a very large number but then I notice MMM at a recent analysts meeting indicated they would spend $13B to $22B from 2013 thru 2017.

Or maybe the cold weather in St Paul has simply gotten to the CEO and his team. (Big Grin)

Rest of the Story

You both get Nobel Prize nominations! I think we have consensus here … and a pretty solid example of a buyback strategy gone astray.

Why?

As Dan mentioned, the executive compensation algorithms could be a factor. And, to me, that’s a little like the tail wagging the dog. It shouldn’t be possible for Capital Structure gymnastics to affect the outcome. The all-knowing consultants who build these packages need to take a step back. Turn the metric into something a little immune to gymnastics. For example, if it were based on % net margin, the whole buyback shell game charade with EPS goes out the window. We’ll leave the notion of “EPS Growth” for another day. Suffice to say, Cy Lynch is right. George Nicholson and Ben Graham were also right about an emphasis/vigilance on profitability characteristics and trends.

But we don’t have to complicate things.

If we believe that 3M has something on the order of 5% top line growth and 14% net margins (P/E ~ 15x) the return forecast (PAR) is 4%. That’s a whole lot closer to a sell than a buy.

That’s right … when PAR is low, 3M should be selling shares, not buying them!

3M’s effective interest rate is 3.96% ($140 mil / $3533 mil long-term debt) and they may be able to get an interest rate somewhere between 0-4% and improve that effective interest rate a tad. LTD is 17% of total capital now. They have $3 billion in cash assets and $13B in current assets … and Dan is right, the cash flow is formidable.

But another $12B??? I think 3M management should proceed immediately to White Bear Lake. Do NOT pass Go. Do NOT collect $200. Chop a hole in the ice. (There will probably be a bunch of ice fisherman there, borrow an auger.) Jump in.

Repeat until you come to your senses.

Business Model Analysis

Mmm model 20140207

Profitability Analysis

Mmm margin 20140207

Projected Average P/E

Mmm pe ratio 20140207

Chronicle of Stock Price & Return Forecast

Mmm chronicle 20140207

Technical Analysis

Mmm technicals 20140207