MSC Industrial Direct (MSM)

This month’s stock feature is a company that is never too far from our radar screens. Frankly, I’m a little surprised that MSC Industrial (MSM) has not been selected over the past ten years. Sometimes the best long-term investments aren’t the sexiest. Nuts and bolts matter.

MSC Industrial Direct (MSM) markets industrial products to small- and mid-sized customers throughout the United States. It distributes a full line of industrial products, such as cutting tools, abrasives, measuring instruments, safety equipment, fasteners, welding supplies and electrical supplies. It’s about building and/or fixing things and hence, the health of the general economy matters. Many investors have been rewarded by investments in companies like Danaher, Fastenal, W.W. Grainger and Snap-On and this company is no exception. MSM is worthy of inclusion among these reliable favorites.

The low total return forecast is 12% at Value Line. The stock price could languish a little if the global recession persists.

MSC Industrial (MSM): Business Model Analysis. Continuing with our testing and work-in-progress, we take a look at the judgment milestones for MSC Industrial. The long-term top line and bottom line trends speak for themselves. Based on a growth forecast of 9-10%, projected profitability in the 10% net margin range and a reasonable P/E ratio of 19-20x in the future, the return forecast is 15-16%.

Growth, Profitability, Valuation

Value Line projects long-term sales growth at 9.5%. We’ll use 9.7% for the sales growth forecast based on the regression from 2010-18.

Based on the historical trends, it’s feasible to envision a 10% net margin. The trailing 6-year average is 9.7%. Value Line has a projected net margin of 10.4% in their long-term forecast.

The historical P/E (trailing 6-year average) has been 19.3×. Value Line has a projected average P/E of 22×. At the time of selection (1/12/2015), the average projected annual return for MSM is approximately 15-16%.

The quality RANKING for MSM is 88 (Excellent) with a financial strength composite (percentile ranking) of 97. Earnings stability is 83.

Morningstar has a fair price estimate of $95 (price-to-fair value of 78%) and S&P checks in with a fair value estimate of $83.60 (P/FV of 88%.)

A Main Street Walker

The company has a history of sound decisions. Value Line analyst Simon Shouclair (1/16/2015) points out that “Cash deployment pays off for shareholders. Indeed, MSM has not only raised its dividend, the company has been doling out some substantial special distributions in recent years, including a sizable $3.00 per sh outflow in October 2014. Share repurchases have also helped to boost shareholder value.”

A company that invests in itself when its return forecast is superior is more music to our ears. “Although the untimely stock has been battered of late, patient investors should note the wide total return potential out to late decade.”

Ahhh. Untimely. Battered. Patience. And that’s our time horizon mentioned. Music to our ears, again. There should be little mystery as to why we included the company among of selections for the 2015 Crossing Wall Street Challenge.

Building and fixing Main Street is a great idea.

General Electric (GE)

It has been a while since we took a closer look at General Electric (GE), the 7th most widely-followed stock by Manifest Investing subscribers. The company is anything but a stranger to this community of investors.

It’s also safe to say that it’s been a source of considerable angst and frustration for many of us.

Company Description

General Electric Company is one of the largest & most diversified technology and financial services companies in the world. With products ranging from aircraft engines, power generation, oil and gas production equip., and household appliances to medical imaging, business and consumer financing, and industrial products, it serves customers in more than 100 countries.

Business Model Analysis

Even successful giants are vulnerable to the impact of a deep recession and GE turned out to be no exception. During the 2007-2009 financial crises, GE Capital served as a catalyst that deepened the damage. Because GE Capital was essentially a venture banking enterprise nested within the industrial giant — and accounted for over 50% of revenues — when the financial markets imploded, the impact was fairly severe and maybe even life threatening. That’s the only way to account for a price drop from $42.20 to $5.70 (-86.5%) for this blue chip leader.

Outlook

The Value Line low total return forecast for General Electric is now 13% — as the long-term low price forecast was bumped from $30 to $35 in the current update.

Analysts appear to be optimistic about the Alstom acquisition and fairly certain that the global condition will ultimately improve. Infrastructure matters. This urgently includes the United States as the electrical system condition is well on its way to resembling those bumpy pothole-ridden atrocities we used to call roads. The only difference is that when the electricity system fails — it takes a lot of critical stuff with it. General Electric is crucial to restoring the necessary reliability of our electrical supply.

We like this blue chip from a number of perspectives. The year ahead will probably only bring returns in line with the overall market; however, out to 2017-2019 we think this equity has room to run. Too, with the dividend north of 3%, income investors have a strong play here.” — Value Line (1/16/2015)

The growth forecast is based on emphasizing the last 2-3 years of actual data in combination with the Value Line forecasts. This industrial giant is retooling, exiting a few businesses while bolstering others. The Alstom addition is an example. For this reason, we focus on the right hand side of the business model trends — and find 4-5% top line growth feasible.

Value Line has a 3-5 year projected net margin of 15.3% and this is a big part of the 14.7% total return forecast for the analyst section of the study. While achievable, we’d be more comfortable with a profitability forecast in the 12-13% range based on the historical profile.

A projected average P/E ratio of 15.0x for a blue chip leader is solid.

General Electric’s exposure to capital-intensive industries makes for a rough road during corrections and recessions. Bringing home an EPS stability of 76 is quite an achievement. The “dent” made in the company the 2008-2009 recession manifests in the Financial Strength rating. (It used to be higher) Overall, General Electric still ranks in the top 10th percentile of all companies when it comes to quality — and we’d be unsurprised to see the overall quality rating increase in years ahead.

It’s been a bumpy road. (Understatement alert) But business results have been steadily improving. 2015 may be yet another flat spot in the stock price trend if oil prices continue to fall — and global recessionary conditions persist.

Ge chart 20150115

Dipped In Magic Waters of Technology

Dipped In The Magic Waters of Technology

With certain apologies to Field of Dreams and Terence Mann (James Earl Jones)

Terence Mann: People will come. They’ll come to Las Vegas for reasons they can’t even dream (yet). They’ll land at McCarran not knowing for sure why they’re doing it. They’ll arrive at the Convention Center as innocent as children, in a childish (but pure) quest. It is money they have and solutions they seek. They’ll wander and discover. They’ll find geeks and gizmos and remember days before the Star Trek stuff started taking shape and forming reality. They’ll cheer their heroes. It’ll be as if they dipped themselves in magic waters. The memories and dreams will be so thick they’ll have to brush them away from their faces. People will come. The one constant through all the years has been technology. America has rolled by like an army of steamrollers fueled by the next generation of locomotive engine. Technology has transformed time. It’s a part of our past — and a glimpse of our future. It reminds of us of all that once was good and things yet to come. People will come. People will most definitely come.

For those less familiar, this week is the Consumer Electronics Show in Las Vegas. It is the world’s largest trade show of its kind. The International CES (Consumer Electronics Show®) is the world’s gathering place for all who thrive on the business of consumer technologies. It’s where business gets done: on the show floor, in and around our conference program, in impromptu connections and in planned meetings and special events. Follow on Twitter via #CES2015.

We’ll be covering the show and providing investment-related feedback on a number of companies, including but not limited to: QUALCOMM (QCOM), Masimo (MASI), 3D Systems (DDD) and many more …

Coming Events and Attractions

Our expanded coverage of the update stocks this month continues as part of our quarter long test drive of this feature and the studies and shared ideas it delivers. Please tell us what you think and feel free to join in the Forum discussions for the deeper dives on some of the stocks.

We’re working to schedule the January Round Table. It will likely be on Saturday morning, January 31 at 10:30 AM ET. The January Round Table will be part of a series of webcasts during Groundhog Weekend — more information to follow.

Speaking of our 10-year anniversary and ALL THINGS GROUNDHOG, we’ll be firing up another year of superior stock selection as we launch Groundhog Challenge 2015 on February 2, 2015. It’s not too early to start thinking about your winners for 2015. Remember we welcome both individual investors and groups (investment clubs) … the ground rules are simple pick a minimum of FIVE and a maximum of TWENTY investments and we lock them in from 2/2/2015 through 2/2/2016.

Companies of Interest: Value Line

The average Value Line low total return forecast for the companies in this week’s update batch is 5.0% — a little higher than we’ve seen in the last few weeks.

Fundamentals continue to erode slightly. This update did have a slight exception, with modest boosts to expectations for companies like Bristol-Myers (BMY), Lilly (LLY), Merck (MRK) and Teva Pharma (TEVA) along with various other drug-related stocks. Pfizer (PFE) was a notable exception — with a slightly reduced long-term forecast.

Materially Stronger: Abbvie (ABBV), Lilly Eli (LLY)

Materially Weaker: Cameco (CCJ), Genworth Financial (GNW), Pan American Silver (PAAS), Barrick Gold (ABX)

Pfizer (PFE) dropped from $35 to $30 for the 3-5 year low price forecast.

Teva Pharma (TEVA) went from $55 to $60 for the 3-5 year low price forecast.

Standard Coverage Initiated:

Discontinued:

Stocks to Study

The following update stocks are ranked in the top 10th percentile of all companies we follow (MANIFEST Rank > 90)

Season For Shareholder Loyalty

It’s absolutely a beautiful thing when we engage friends and family and lead them to the discovery of long-term investing. The opportunity to make a substantial difference, enabling better futures, is massive. We know that long-term investors also often become loyal (even rabid) consumers for the companies that they own. Regular vigilance combines with routine consumption. I wish I could change the names in the following story to protect the guilty … but it serves as a reminder of how powerful these forces of discovery can be.

I’d made the sojourn again from southeastern Michigan back to the shores of the Mississippi River in northwestern Illinois. As a fairly frequent traveler, my bags are generally packed carefully to make sure that I have all of the necessities for effective travel. I’d arrived back at my parent’s residence well after midnight and settled in for a good night’s sleep knowing that I’d see them at the breakfast table in the morning.

Sunrise came … but something was wrong. It was one of those gnawing feelings. I could have sworn that I stuck that tube of toothpaste in my overnight bag. No matter how deep I dug, it was clear that I was on the road without this necessary item? But my toothbrush was there? If it was there, how in the world did I forget the tube of toothpaste?

Sure enough, Mom and Dad were already seated at the kitchen table. We exchanged hugs and greetings and my instincts began to kick in.

“Dad, you wouldn’t have any idea why I can’t find my toothpaste, would you?”

Grinning, as he often does, like a Cheshire Cat but with his face aimed at his cereal, he responded, “Hmmm. That’s too bad, sorry to hear that. I probably have some real toothpaste you can use.” He was now snickering and giggling while continuing to munch on his cereal. He was also clearly avoiding eye contact.

“What’s with the Annual Report standing next to the bathroom mirror?”

Mom mumbled something along the lines of, “… Oh no. Here we go again.” The cereal crunching continued, but he offered up, “You’ve been warned.” There was still no eye contact.

“Enlighten me, Dad. I don’t seem to recall any warnings?” (It was a white lie. Hairs were now standing on the back of my neck and I was clearly in the danger zone.)

“You should know better than to bring that contraband into this house.”

Mischievous giggling continued. Mom was now grinning, siding with the suspect.

“Why don’t you join the rest of the world and use Colgate ($CL) toothpaste instead of that ‘stuff’ ($PG) from Cincinnati? Would you like to see a Fact Sheet?”

It was crystal clear now. My toothpaste had been hijacked and replaced with a Colgate-Palmolive annual report. Dad became a Colgate stakeholder after seeing a company presentation at an investment conference a few years ago. It seems he also became an ardent evangelist and enforcer for their products.

Crossing Wall Street Challenge (2015)

Eddy didn’t get quite enough “Christmas Miracle” to extend his 7-year winning streak of beating the S&P 500 with his Buy List. But it was close. The 2014 Buy List landed at 11.8% for the year versus 13.7% for the S&P 500. Not exactly a disaster. And more importantly, his 9-year (since inception) absolute return is 10.8% vs. 8.0% — a relative return of +2.8%.

Nothing wrong with that.

You can find commentary (and continuous updates) on Eddy’s selections for 2015 here and here.

Start Your (2015) Engines!

We’ll track the 2015 Challenge on the customary dashboards:

Shopping In The Best Places With Our Friends

Walking Main Street is our entrant in this Challenge. Walking Main Street 2014 closed out the year on 12/31/2014 at a portfolio value of $1,175,729.94 — for an annual total return of 17.6% — outpacing the S&P 500 by +3.9%.

Where did we go hunting for our (20) stocks for 2015? Like we said, we like to shop in the same places as our like-minded long term investors. Therefore, we start with the MANIFEST 40, the forty most widely-followed stocks by Manifest Investing subscribers. We sort that by MANIFEST Rank, our combination ranking that includes a dash of return forecast and a dash of quality for a recipe that recognizes the top two characteristics for any investment. We also want to stick to stocks in the top quintile (MANIFEST Rank > 80) as we build for 2015. This yields about (24) stocks.

We then turn to lessons we learn from friends. In this case the inspiration comes from our two-time defending Group Champions in our annual Groundhog stock picking challenge — the Broad Assets investment club of St. Louis.

Why? Because they (and we) believe that stock prices follow earnings. We’ve added the year-over-year change to our shopping list, shown on the accompanying chart as “2015 EPS Delta”. This is nothing more complicated than comparing the analyst estimates for 2015 versus the year-end results for 2014.

Doing this disqualifies companies like Qualcomm (QCOM), Microsoft (MSFT), Coach (COH) and Exxon Mobil (XOM). These are all excellent companies that may have a turbulent year ahead of them. For a typical/traditional long term portfolio we’d look the other way, but this is a one year contest. We believe that stock prices ultimately follow earnings and we also believe/know that the rhinos often overreact to short-term turbulence, in many cases punishing stock prices over the coming year if they believe earnings are cloudy or in jeopardy.

The average 2015 EPS Delta is 12.9% for our universe of stocks.

In that spirit, we went looking “outside” the MANIFEST 40 for a few stocks to substitute for the disqualified ones. We found a group of stocks with solid return forecasts and quality that have good or above-average 2015 EPS Delta expectations: Fossil (FOSL), Mesa Labs (MLAB), Priceline (PCLN) and MSC Industrial (MSM).

After adding these, the overall 2015 EPS Delta for our (20) stocks is 14.3%.

A few stocks were disqualified with return forecasts too close to (or less than) the median return forecast (MIPAR) of 6%. The companies included in this batch were: FactSet Research (FDS), Johnson & Johnson (JNJ), CVS Health (CVS) and Costco Wholesale (COST). Again … nothing wrong with any of these … but we’re looking for outsized return forecasts.

Copa Holdings (CPA) merits a look with the news about Cuba … and T. Rowe Price (TROW) checked in with a very honorable mention.

Industry Analysis: Pharmacy Services

Industry Study: Pharmacy Services

Many of you are well acquainted with the “strong nudges” suggested by our friend Ken Kavula when it comes to the subject of “Buy The Best!” Ken is reinforcing — in his strongest professional educator voice — the importance (and path to opportunity) of studying a stock in the context of its industry or peers. This was among the strongest encouragements that a nation of investors heard from George Nicholson, Jr. CFA — widely regarded as the grandfather of the modern investment club movement. Another professional investor, David L. Babson, contributed a series of columns to Better Investing magazine, starting in 1960 and continuing for a few decades. One of his favorite industries was Specialty Chemicals and he believed that virtually every investor should have a stake in this industry … suggesting that if “chemistry is life” then it follows that industry leaders in this realm ought to be candidates for long-term portfolios. We’ll kick off this series with a look at Pharmacy Services, because we think Mr. Babson would concur that this is an area to discover, shop/study and own … for as long as it makes sense to do so.

“The Pharmacy Services Industry has historically been viewed as a safe haven for investors seeking steady growth and preservation of capital. However, things have changed a bit in recent times, owing to the aging of the American population and an altered industry landscape. These stocks now have more of a growth profile than they had in the past. There is much opportunity for expansion, with billions of dollars in business up for grabs. But there is also greater competition, coming from every direction, as even non-traditional channels are looking to get in on the act… an evolving industry…” — Value Line

The companies in this industry are generally either large drug chains — Walgreen (WAG) and CVS Health (CVS) — or pharmacy benefits managers, or PBMs — Express Scripts (ESRX) — … or some combination of the two. In many cases it’s a classic brick-and-mortar story where the corner drug store is battling the “Amazons” of online/mail-order prescriptions. And of course, those “corner drug stores” have their own web segments and/or alliances in the drug supply chain.

Pressure to stay competitive has prompted some in the industry to think outside the box and use acquisitions to gain access to a bigger scope of business.

Prescription growth rate is a indicator of a promising field of opportunity for the combatants in this industry. Demographics point to a rise in the number of Americans aged 65 and older over the next two decades. Increasingly, Baby Boomers will require medical care and pharmaceuticals, auguring well for the industry’s sales and earnings prospects. The largest pharmacy services providers are best positioned to reap the coming rewards. We repeat … field of opportunity.

Growth

As shown in the accompanying graphic, the industry growth rate is approximately 5%. The step change in industry sales between 2011 and 2012 is the acquisition of Medco by Express Scripts.

Profitability

It’s a battle in progress out there. It might even be a war. The industry profitability seems capable of restoring to the 3% level, with a nod to the 3.5-4.0% contest being waged between WAG and CVS. It’s interesting to look back at Monsters Being Created and how these industry giants have fared since our September 2008 cover story.

Projected P/E Ratio

The industry average P/E ratio is approximately 15.0x for companies as they reach maturity. CVS Health and Walgreen rate a premium nod as they continue to dominate the profitability roost.

Return Forecasts and Quality Perspective

The accompanying Instant Industry Study has been sorted by Quality (Descending). We generally find it most rewarding and better sleeping conditions to shop at the top of the list. The return forecasts (Projected Annual Return, or PAR) are fairly subdued. The average return forecast is currently 6% — so these aren’t much to write home about. This is mainly due to a strong five year run where the Drug Retailers index has gained approximately 21-22% (annualized) over the last five years.

So … patience is a good idea to wait for one of these industry leaders to display an attractive return forecast — either via a stock price reduction and/or a boosting of fundamentals to strengthen the expectations.

This Week at MANIFEST (12/26/2014)

Merry Christmas! Bless Us, EVERYONE!

Holidays. We have much to be thankful for … notably the smiles on the faces of investors who have persisted through the Great Recession and experienced/realized fairly massive returns over the last few years. As we approach the end of our 10th year at Manifest Investing, all of us extend the warmest Seasons Greetings to all of you!

We’re already looking forward to celebrating our 10th birthday — and the launch of our 11th year — as Groundhog Day 2015 (2/2/2015) approaches. We’ll celebrate in a variety of ways, continuing to extoll the virtues of investment clubs and community-centered investing. The Round Tables will be part of that and we’re thankful for the contributions of Ken Kavula, Cy Lynch and Hugh McManus. We’re equally thankful for our guest damsels and knights: Kim Butcher, Herb Lemcool, Susan Maciolek, Anne Manning, Matt Spielman, Nick Stratigos … and last but certainly not least, our audiences who cast their votes monthly. You guys are the BEST.

We’re planning additional festivities which you’ll be hearing about soon. And you can listen for the sound of reindeer on your roof knowing that you’re in the hands of Kurt Kowitz, our technology manager. We’ve said it before, but without Kurt, the cost to deliver Manifest Investing to you would increase by at least one digit, maybe two. We’ll be unwrapping some cool gifts soon … and the prototype tinkering with the Equity Analysis Guides is likely the tip of a features iceberg. Thanks, Kurt!

For now, we nudge you as you unwrap this week’s batch … and we share a compendium of correspondence. You are not alone.

Merry Christmas, everyone!

A Bridge To Better Understanding

We’ve shared similar letters of consternation from investors in the past … and they come in many flavors. One of our all-time favorites was our visit to Narnia and our suggestion that The Couch Is Alright. Another memorable exchange came with “Nell” as we helped her to Make It Through The Night.

Where am I going wrong? I check out a stock, like it, and check it out on Manifest Stock Research. It looks good, you like it too. For confirmation I dig deeper — and [audit and verify assumptions using MyStudy]. Next thing I know, I feel like I get shot down when you show four or more reasons why the company is not worth an investment and say the quality is not to our standards. Is one screen looking at long term and the other at short term? Are you practicing April Fool tricks five months early?

We asked for an example. Chicago Bridge & Iron (CBI) was provided. CBI is actually a very compelling opportunity. There are some strong market drivers, long term. And the company is part of this week’s update batch — so let’s take a closer look.

I’m wondering where we differ. The PAR is 20-25% or so — making it somewhat speculative. The global recession has taken its toll with a fairly substantial price drop over the last several months. (From $89.20 down to $37.78 … -58%)

I don’t know but I wonder if investors and pundits are troubled over the Shaw acquisition?

Here’s a look at a Value Line data-based Equity Analysis Guide for CBI:

Be sure to account for the Shaw acquisition in your analysis. (This means you probably have to ignore anything before 2012 on a traditional SSG.) The step change in sales in 2012 was due to buying Shaw. When imagining what the future holds, be sure to emphasize the information that deals with the new, combined, company.

That could also lead to some significant differences between your study and the analyst consensus.

S&P has a fair value of $80.80 (recently adjusted downward from $87), so they think it’s significantly under priced at $41.

Thanks for the suggestion but, while I only mentioned one example when writing you, the same thing occurred over fifteen investigations. It leaves you with the feeling the entire market is overpriced so it might be better to hibernate until the pull back. I was particularly disturbed over CBI as they seemed a good candidate. Perhaps Lady Luck will lead me to a candidate where research and analysis will both agree. Thanks for your input.

Although luck is definitely involved in investing … we can look beyond Lady Luck a bit.

I think we’re seeing a symptom that’s related to the recent run in stock prices. This has been going on at the same time as an erosion of fundamentals. We’ve commented on this before — noting that in many cases, the only way to realize these return forecasts is if relatively high P/E ratios come home to roost.

I think CBI is a great candidate. The price has dropped enough to capture the attention of Hugh McManus. (grin)

Seriously, for a non-core stock (but one with relatively high quality) we need to demand a higher return forecast when considering purchase. We also must admit that a persistent or deepening recession will do things to CBI that are similar to 2008-2009. The stock price suggests, at least to me, that many people consider this to be a work already in progress.

If they’re wrong, it’s a heckuva buying opportunity. And for a long term investor with a long term perspective, CBI is probably a lot like BP (BP), Schlumberger (SLB) and others in the oil patch these days. The next year or two could be rough and represent an opportunity for accumulation. But make sure the companies are built for survival if you decide to “go there.”

We feel your frustration but we still believe that a good StockSearch, directed at high-quality companies with elevated return forecasts can do a lot to populate the area underneath just about any investing Christmas tree.

Coming Events and Attractions

Our expanded coverage of the update stocks this month continues as part of our quarter long test drive of this feature and the studies and shared ideas it delivers. Please tell us what you think and feel free to join in the Forum discussions for the deeper dives on some of the stocks.

Save the Date: The December Round Table will be held on December 30 at 8:30 PM ET. Register via: https://www2.gotomeeting.com/register/256833802

Round Table Tracking Portfolio

Stocks Likely To Be Covered:

  • Chicago Bridge & Iron (CBI)
  • Copa Holdings (CPA)
  • Qualcomm (QCOM)

Companies of Interest: Value Line

The average Value Line low total return forecast for the companies in this week’s update batch is 4.7%.

The number of companies with slightly reduced fundamentals combines with the price increases over the past month to produce some fairly low return forecasts.

Trex (TREX) has been a personal favorite since my Better Investing days … and it leads a lonely group of companies with bolstered fundamentals. As a reminder, we monitor changes in the long term forecasts by Value Line and share those that have been adjusted 20-25% or more (up or down) as “Materially Stronger” (Up) or “Materially Weaker” (Down). We consider this a best practice and a nudge for stock watchers or shareholders to update/audit existing analyses. In some cases, it may trigger a study of opportunity.

Materially Stronger: Trex (TREX)

Materially Weaker: Owens Corning (OC), Layne Christensen (LAYN), Tile Shop Holdings (TTS), Enernoc (ENOC), Rayonier (RYN)

Standard Coverage Initiated:

Discontinued: Kimball (KBALB), Foster Wheeler (FWLT), TIBCO Software (TIBX), Concur Technologies (CNQR), Conversant (CNVR), Compuware (CPWR), URS (URS)

Companies of Interest: Morningstar

The average price-to-fair value (P/FV) ratio at Morningstar for the companies in this week’s update batch is 106%.

Companies of Interest: S&P

The average price-to-fair value for the companies in this week’s update batch is 105% — according to S&P.

Market Barometers

The median Value Line Low Total Return (VLLTR) Forecast is at 3.4%, plummeting from 4.2% last week as the Thanksgiving Swoon gives way to a Christmas Rush of multiple 1-2% daily gains in the overall market.

Stocks to Study

The following update stocks are ranked in the top 10th percentile of all companies we follow (MANIFEST Rank > 90):

Manifest Investing is a subscription site (ONLY $79/year for individual investors).  Contact us (via manifest@manifestinvesting.com) if you would like to explore our resources as an investment club.  We offer group discounts to clubs.  Discover and explore our research on stocks and funds, our seminars and tools for portfolio design & management.  Experience the demonstrations of a 7-decade old time-honored philosophy and method that has supported legions of long-term investors.  Go to http://www.manifestinvesting.com and create a trial account today.  Send us an email if you’d like to access a FREE fully-functional test drive through 2/28/2015 without providing a credit card.  Merry Christmas!

C’mon Christmas! 2014 Buy List

C’mon Christmas Miracle for the 2014 Buy List

Eddy Elfenbein of Crossing Wall Street is widely regarded as one of the best buy-and-hold bloggers on the Internets. Every year in mid-December, he selects (20) stocks to hold for the next calendar year in a tracking portfolio known as his Buy List.

He has outperformed the S&P 500 for the last seven years.

As of 12/17/2014, the 2014 Buy List lags the S&P 500 during 2014 by a little bit … but we’re hopeful for a Christmas miracle. Anybody around here have Carl Icahn on speed dial so we can get some M&A rumors swirling on some of Eddy’s 2014 collection?

Context: You will find that Eddy thinks a lot like “us”. His weekly updates on the Buy List stocks are a worthy addition to the reading list for stock watchers and shareholders. Even if his 2014 Buy List doesn’t break the tape in a photo finish this year, we know better than to gauge anything based on a single year — and it’s here that we see the all-time performance of the Buy List (8 years) is an annualized rate of return of 10.7% vs. 7.3% for the S&P 500 — for a rarified +3.4% relative return.

Here’s a snapshot of the standings going into the stretch:

Crossing Wall Street Challenge

We play along with a couple of dashboards alongside Eddy’s 2014 Buy List with our own entries.

The 2014 Walking Main Street dashboard is quite simply drawn from our (40) most widely-followed stocks (MANIFEST 40), selecting the (20) with the best combination of PAR and quality back on 1/1/2014.

The Expecting Alpha 20 entry is sourced from the universe of ~2400 stocks that we cover — and seeks the (20) with the best combination of Value Line low total return forecast, suitable quality and better-than-average sentiment. It needs a dash of Christmas miracle, too … as 2014 winds down.

2015 Shopping … Auditing … Deciding

Eddy shared a couple of weeks ago that he’s making a list and checking it twice. His usual practice is to drop five of the (20) 2014 Buy List and to select five replacements for them.

We’ll use the dashboard-based sandbox “what if” portfolio design feature to take a look at the five that Eddy has singled out and the (10) replacement candidates that he’s kicking around.

The top 3-4 are pretty much slam dunks and we hope Eddy chooses them. SEIC is a formidable company, a long-time community favorite and has better-than-average potential. The release of IBM (IBM) can’t be easy but there’s not enough dividend there to offset the low growth prospects. Not a cardinal sin, simply a symptom of maturity facing the same global economic challenges as most of the consulting stocks.

We’ll do our 2015 shopping during the final days of 2014, but for now… let’s hope for a strong close for Eddy’s 2014 Buy List and our own Expecting Alpha 20.

Energy Patch: Black Gold or Minefield?

The recent swoon in the energy sector has prompted some to suggest that it’s time to back up the tanker truck — what could possibly go wrong? “All of these companies are on sale.”

Not so fast. As we pointed out in last week’s update, we expected reductions in forecasts from the likes of Morningstar and others and it’s gently underway. As a case in point, Morningstar’s fair value for Schlumberger (SLB) has been recently reduced from $145 to $124. Other companies seem to be following suit. S&P already had suppressed expectations (relative to Value Line and Morningstar) and they have actually trimmed a number of estimates.

As the following graphic shows … after an extended trading range, the price of $BRENT has been pummeled, now down some -42.5% for the trailing 52-weeks:

The S&P energy sector fund (XLE) has been punished also — with some lag — and with less damage, at least so far, as the sector leaders are down -15% over the trailing 52-weeks:

There are 44 companies in XLE and we’ve listed the top 16 here (with one exception … BP is not part of XLE … but we listed BP here in response to the Forum discussions) and you’ll see a number of industry leaders and stalwarts. The majority of companies in XLE are components of the S&P 500. Note that these 16 companies account for 75% of the index performance and the top three: Exxon Mobil (XOM), Chevron (CVX) and Schlumberger (SLB) account for 40% all by themselves.

Energy Sector Sample. Projected Annual Return (PAR) is the consensus forecast via MANIFEST. Quality ranking is the percentile ranking of our quality characteristic based on financial strength, EPS stability and relative growth and profitability. VL Low Tot Ret is Value Line’s 3-5 year low total return forecast, adjusted for change in price and/or time horizon. Morningstar P/FV is the ratio of current price to Morningstar fair value.

The Morningstar P/FV cells that are highlighted are at least one standard deviation from the median P/FV ratio. These can be thought of as potentially “on sale” or worthy of study. The same highlighting applies to the S&P entries. The solo entry highlighted in red, Pioneer Natural Resources (PXD) has a P/FV at least one standard deviation greater than the median — potentially a selling candidate.

Our overall average forecast for the group matches the Value Line low total return forecast. The fair value reductions and continued slide in stock prices deliver an average Morningstar P/FV ratio of 77% but we’d expect further moderation of fundamentals (continued reduction in fair values). S&P is still much less optimistic (91%) with relatively few triggering the highlighted status.

Companies deemed most worthy: Exxon Mobil (XOM), Schlumberger (SLB), National Oilwell Varco (NOV), Halliburton (HAL) and BP (BP).

Sources: Value Line Investment Survey, www.morningstar.com, Standard & Poor’s

Is it time for some Christmas shopping?

Based on a multi-year chronicle for XLE, the return forecast has now reached a multi-year high — suggestive of one of the better buying opportunities over the last 7-8 years.

As always, quality matters … and the $/bbl trends are not supportive of higher cost producers, like the offshore drillers (yet).

Xle chronicle 20141212

“Oil Patch” Screening Results

… because it’s not just oil. In fact, there may be some opportunity in companies that are less directly affected by the OPEC smoldering. In any case, here’s a quick shop until you drop for the energy sector:

Oil patch screen 20141212

Invest With Your Friends

Happy Birthday, bivio!


Expected Returns Cover Story … first posted on September 1st, 2009.  We revisit this feature today as we celebrate bivio’s 15th birthday and honor their service to legions of investment clubs and individual investors with the best service and most cost-effective record keeping software and support network for investment partnerships.  We’ve known you since day one. You’re simply the best!


In his own words, Nicholson talked of investment clubs as his “Grand Experiment.” Their purpose? Education. Period.

The talking heads are obsessing over Septembers nearly ten years ago or one year ago when massive upheaval in the financial markets was ramping up. In the end, the demise of household names like Lehman, Bear Stearns and Merrill Lynch would go on to prove that this was no ‘speed bump’ in history. My thoughts drift to other foundations as autumn approaches, to nearly 70 years ago when a small group of young men wandered into the office of a professional investor in Detroit. “We want to learn how to invest.” “OK, but we’re gonna have some rules of engagement: we’ll operate professionally in a business-like manner, we’ll invest regularly and we’ll stay invested as long as it makes sense to do so in leadership growth companies …”

bivio: “where two roads meet” We first met the key players at MANIFEST business partner, bivio, over ten years ago. Their mission then and their mission now is to create an environment of success for groups of investors. As their tenth birthday approaches, we look forward to what the future holds for investors.

bivio is a web-delivered application, enabling groups of individual investors to create and manage their own investment clubs – it’s like creating your own personal mutual fund. By making the administrative tasks easier, bivio has succeeded in widening the learning window. We look forward to working with them, building on that foundation and resources.

All the things I remember, Summers never looked the same …
Years go by and time just seems to fly, but the memories remain.
In the middle of September, We still play out in the rain. — Daughtry.

That autumn day in 1941 in Detroit was a critical moment in the modern investment club moment. The professional investor was George Nicholson, Jr. CFA and the principals went on to form the National Association of Investors ten years later. Some of you may wonder why our attention focuses so much on investment clubs. We clearly appreciate that some of you are not clubbers. That said, the vast majority of our subscribers are either active or have been active in an investing partnership.

Shortly after joining the Better Investing staff as senior contributing editor back in 1997, I worked with the Motley Fool founders on an article that proclaimed that fool.com was the world’s largest investment club. My Foolish friends were wrong. I followed shortly thereafter with an article that hailed technological advances and declared that the umbrella organization had become one big investment club. I, too, was wrong.

The heart and spirit are in the right place … and the power of Community is incredibly important. Look no further than our discussion of the “Wisdom of Communities” (Expected Returns, June 2008) or our back-to-school features and tributes to tradition like Muskrat Pageantry (ER, March 2008.)

In his own words, Nicholson talked of investment clubs as his “Grand Experiment.” Their purpose? Education. Period.

Building Better Futures

Let me be clear. We know that people engage learning opportunities in a variety of ways. Whether from reading books, attending classes, poking around online, observing best practices from successful individuals … it’s a long list. The genesis of investment clubs was clearly centered on a learn-by-doing experience by leaning on friends.

And that’s what wrong with the previous articles. Our family attends a church where 28,000 people can show up for worship on Christmas and Easter. I can’t imagine learning-by-doing with a group that large. Hence, we form small groups where “we” comes to life. Clubs (We) cultivate patience and discipline while seeking the opportunities achieved by incrementally better returns. It’s quite literally the stuff that dreams are made of.

The Genesis of Clubs

Nicholson shared in later years that the motivation for Fred Russell and the other young men was quite literally, freedom. Russell dreamed of the day when he could walk away from his day job to operate his own business. This ultimately became reality as he went on to a Howard Johnson franchise in years ahead.

Here is the core of the modern investment club movement:

1. Provide a way for many people to start an investment program in a small way, without too much experience, and build their investment knowledge to the point where they have the ability to acquire a sizable investment portfolio and manage it profitably.

2. Broaden the awareness and interest of individuals in the ownership of equities … in many cases, this takes shape as members/practitioners have as great an interest in helping others to learn about [effective] investing.

Most clubs form as a general partnership and suggest that their partners invest relatively small amounts ($20-50, usually) on a monthly basis into the club portfolio. In fact, if you’re visiting and considering joining a club and the figure is much higher than that — caveat emptor. It’s not about the total assets, it’s always been about growing the unit value at superior rate.

In the early days of investment clubs, think about the environment. The participants were still using slide rules and doing multiplication and division by hand. (Gasp) It was difficult to buy stocks in “odd lots” and commissions were substantial on these 100-share increments.

One of the earliest drivers was the pooling of the finances, enabling a lower cost ratio than individuals could achieve on their own. The intent was to spread out expenses.

But the “pooling” didn’t stop there. Think about access to information. Company reports were hard to obtain and clubs divided up the odyssey and the analysis for survival.

The Mutual Club of Detroit provides one of the standards of excellence. One member has donated $20/month since February 1948 building an account that reached seven digits (despite a fair number of significant withdrawals to fund life experiences) and a rate of return of approximately 13% since inception.

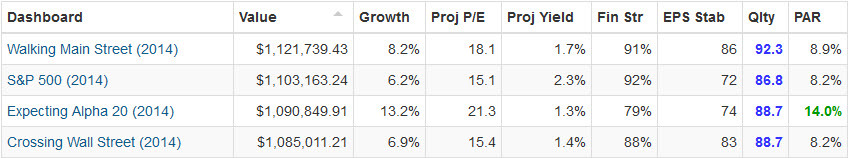
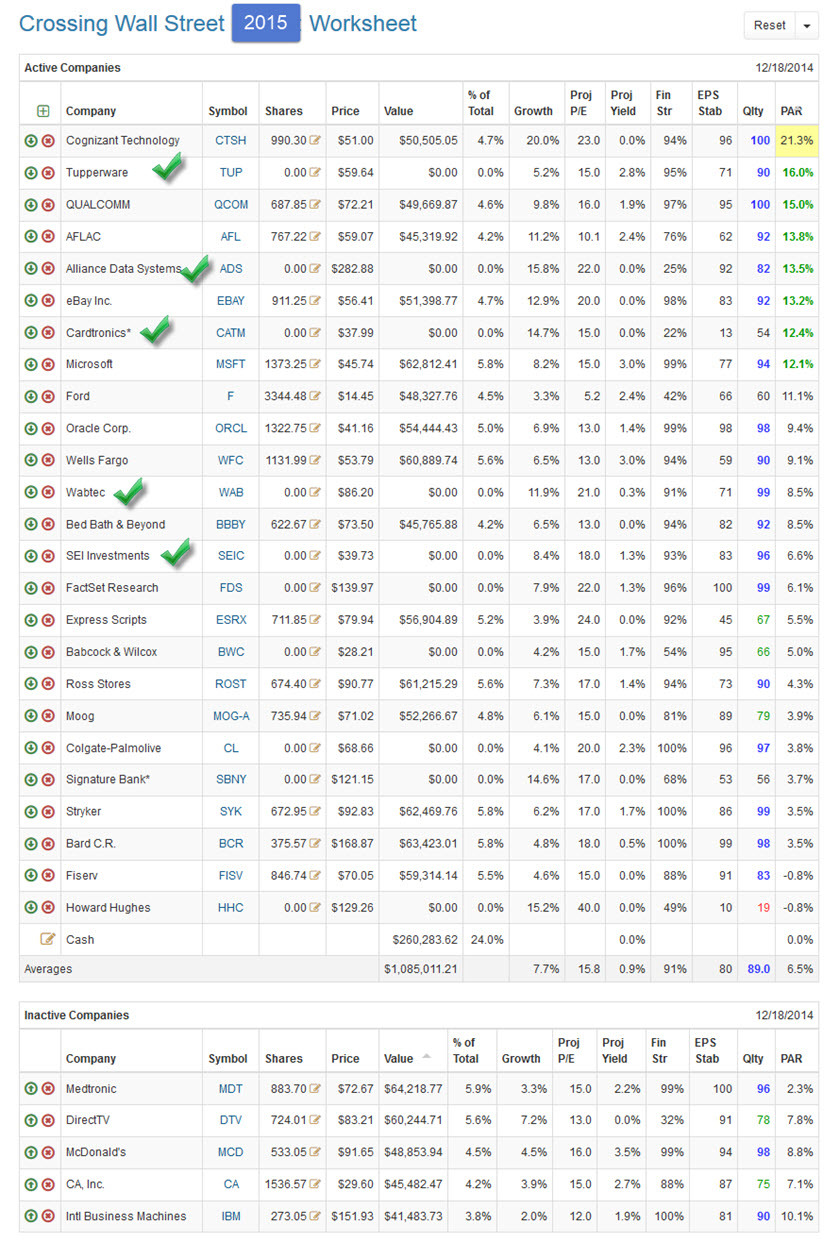
Model Behavior. Demonstration investment clubs, like the Brighton (Michigan) group meet monthly to explore and learn together. The club dashboard is one of the published portfolios available at MANIFEST. The club is education-centered and led by a group of volunteers from the southeastern Michigan region.

Fast forward to today. Transaction costs have plummeted and access to investment information has literally exploded. A couple of the original drivers of the “Grand Experiment” have changed pretty dramatically.

At The Crossroads

What hasn’t changed is (1) the business-like approach and (2) the incredible learning power of collaboration within the Community.

Enter bivio. One of the treasures delivered is effective accounting support. Keeping the club and individual records and generating a tax return with a couple clicks means that a very special resource is redistributed to club partners … TIME.

With administrative tasks reduced to background music, time is liberated to explore and seek better investing opportunities. The record-keeping is still crucial but the emphasis shifts to learning-by-doing, together with friends. Investing better.

And dancing in the September rain, with our friends, is what our investing journey is really all about.

At bivio, “Bags Fly Free” there are no hidden annual charges to file annual tax reporting.  Explore the resources at bivio.com and experience investing with some new friends.