What Works on MAIN Street?


Main and Wall

Monday’s WSJ column about the waning of interest in investment clubs and dreadful undocumented under performance stirred memories of this column from Better Investing magazine about 12 years ago.  Why?  Because the talking heads keep bringing up that “comprehensive” study of 166 clubs and the Beardstown Ladies saga.  We need a new scientific study … because our experience is that investors embracing and heeding the modern investment club methodology (whether on their own or within the warm confines of an investment club) are doing pretty well when taken in full perspective and when dealing with FACTUAL internal rate of return records.  We’d rather focus on what’s working — even if so many of you lurk silently — and pardon me, but I might just puke if someone cites those 166 “clubs” again.

The coming of April showers means that, once again, March Madness has come and gone. March Madness. With each passing year, I find that I enjoy the mighty meetings of high school basketball teams, closely followed by their collegiate counterparts. By the time this magazine reaches your coffee table, there’s a pretty good chance that a number of magical moments will have happened. Gene Hackman and his Hoosiers were just one shining moment. There will be others. The goose bumps are “on ice” just waiting to be experienced. “Do you believe in miracles?”

We’ve acknowledged in past articles that [the grandfather of the modern investment club movement] George Nicholson always regarded NAIC and investment clubs as his “Grand Experiment.” Investment clubs are also human. The things that can be discovered are nothing short of miraculous. Exploring the rewards of investing while stripping away the myth and mystery is something that brings a smile to our faces. Learning to smile together is a gift that we hope to share with as many people as humanly possible.

March Madness. It brings out the best. Unfortunately, it sometimes brings out the worst, too.

The January/February 2000 issue of the Financial Analysts Journal features an article by Brad Barber and Terrance Odean entitled, Too Many Cooks Spoil the Profits. This publication is received by Chartered Financial Analysts. Although fairly few people will ever see this report, we believe that exploring some of the conclusions is worthwhile. If nothing else, Barber and Odean have been regularly appearing in the media. We think they could gain much from a better understanding of investment clubs and strategic long-term investing.

Quoting their conclusion: “Unfortunately, [investment clubs] do not beat the market.”

We have “been here” before and it won’t be the last time. A year ago, a number of publications assailed our Beardstown Ladies. Too many cooks? Most of us rather like cooking with our friends. There is some impressive cookin’ going on. There will come a day that we’ll demonstrate that we not only achieve (in the words of Barber and Odean) “savings, education, friendship and entertainment . . .” but we also achieve very promising performance levels as well. Collectively, NAIC investors achieve high returns. Clearly, this does not happen for every single club or every individual, but we have scores of success stories. We think it’s valid to point to our Top 100, this issue’s main feature, as substantial evidence. With Intel, Lucent Technologies, Home Depot, Cisco Systems, Merck, PepsiCo and Microsoft among the most widely held companies, clearly some level of success has been attained by our practitioners.

Nearly 4,500 investment clubs (11.9 percent of registered clubs) responded to our latest Top 100 Survey with complete portfolio summaries and club accounting reports. Barber and Odean assail the “touting” of investment club performance in the media by citing sample bias. Barber and Odean base their findings on 166 investment club account statements from a single discount broker! Not only that, they cite turnover levels of 65 percent (nearly a complete overhaul of the stocks within a club portfolio every year-and-a-half.) Barber and Odean also share that these club accounts were concentrated in high beta, small-cap stocks. These characteristics lead us to a simple question, “Are you sure that you’re assessing NAIC club performance?” That doesn’t sound like what the long-term investors we know about are doing.

Most people are not statisticians, but I think that they can sense that 4,500 data points might be more representative than 166. Particularly when the “166” are “weak.”

The authors dwell on excessive turnover and poor returns due to commission costs. We ran a quick, biased, completely unscientific survey to investigate a hunch. Approximately 50 online investors responded. I think we can assume that these investors are “most likely” to be the most active. We asked them to provide their turnover figure for 1999. The highest turnover rate reported was 40 percent. The lowest, from several respondents, was 0 percent. (No sell transactions for the year.) The average was 8 percent. Unscientific, yes. And admittedly biased. But, in my opinion, closer to the truth about what long-term investors are really doing.

Here’s another aspect that the Barber and Odean study that raises questions. MANY investment clubs use dividend reinvesting. So, I went back and checked. In 1996, our investment club had 64 percent of our assets in DRPs. Our discount brokerage account would have been terribly UNinformative about the true performance of our club.

Barber and Odean include another rehash of the Beardstown Brouhaha of 1999 as “evidence” of poor performance. It bears repeating. Investment clubs, including our Beardstown Ladies, are human. A mistake was made. But, for the record, the Beardstown Ladies achieved a 15.3 percent annualized return for the 14 years ended in 1997. (This was part of the Price Waterhouse audit.) The annualized return for the S&P 500 for this same 14-year period was 16.9 percent. If the ladies are guilty of underperformance, consider this: In his book, Common Sense on Mutual Funds, John Bogle Sr. documents that only 14.1 percent of “growth and value” mutual funds beat the Wilshire 5000 (16.0 percent returns for the total market) for the 14 years ending in 1997. While committing their “crime,” our Beardstown Ladies “defeated” 5-out-of-6 mutual funds. March Madness, indeed.

Is the point that the ladies would have been better off stuffing their recipes and cold cash into the corners of their mattresses? I certainly hope not, because if that’s the case, these two educators are not only failing to educate –they’re DE-educating.

A number of us recently gathered online to discuss James O’Shaughnessy’s book, What Works on Wall Street. What works on MAIN Street? Patience. Discipline. Discovering the best companies, at the best prices, with our friends. Too many cooks? Not even close! It’s the best type of cooking capitalism has to offer.

Annual Stockpicking Results (Groundhog VI)

At Manifest Investing, we celebrate Groundhog Day by ending one annual stock picking contest (Groundhog VI for 2012) and starting another (Groundhog VII).  Any and all investors are welcome to participate either individually or as part of a group.  For 2013, participants may select as few as five investments (stocks or funds) with a maximum of twenty.  $1,000,000 will be divided among the entry positions and we’ll create a dashboard and track entries from Groundhog Day to Groundhog Day.

Congratulations to Bernie Meister of Midland, Michigan for winning Groundhog Challenge VI (2012). The group champions are the Broad Assets Investment Club of St. Louis, Missouri. 1. Hoist trophy. 2. Pat back(s). 3. Get back to work on your 2013 selections. 🙂

The early years were phenomenal as you’ll see in the following slides — and performance has become more normal than we’re accustomed to seeing the last few years.  Even with that, our Groundhog Nation generally outperforms the herd of analysts, pundits and institutions with many participants sporting lofty alphas (relative return) over the years.

When Punxsy Phil sees his shadow, we think it has less to do with the weather and more to do with positive trends and achievements for us next year and beyond.

For more information or to enter the fray, contact manifest@manifestinvesting.com

Good luck to the 2013 field.

S&P 500 Monthly Returns (2005-Present)

Yes, January 2013 was a good month, a special month in the context of returns.

But there have been several months since March 2009 that have been even better.

In this graphic the red-shaded months are the months when the median return forecast was below average … and the green-shaded months when the return forecasts were outsized.

I was surprised to see the dispersion for above-average return forecasts, while the monthly returns during our “return forecast plateau” (2005-2007) are pretty tightly grouped. Hmmmmm.

This Time It’s Different

$vle new normal 20130131

Mohamed El-Erian is credited with coining the phrase and concept of a New Normal following the Great Recession of 2008-2009. In a nutshell, it’s the current form of “This Time It’s Different” and — at least for now — he’s right.

Here’s a look at the Value Line Arithmetic Average with a couple of recessions superimposed. The blue line is the long-term (5-year) trailing average. Looking at the slope of this trend line, we see three different periods (between recessions) with fairly conspicuous shifts in slope (basically rate of price appreciation.)

Shopping, Dropping Your Wallet

Photo Credit: x-ray delta one (Creative Commons)

The American consumer has endured a relatively lengthy time when disposable income has been, in a word, weak. What impact would the following situation have? As you’re heading for the parking lot at work, they stop you at the gate. Before you can pile into your car, you must fork over 4% of your paycheck. It gets worse. You grumble as you drive away and pull into the parking lot at your favorite retailer. Now you’re greeted at the door and you discover there’s now a “cover charge.” That’s right. If you’re going in to spend $100, your new friend at the door will take $2-4, depending on how good of a mood they’re in.

Huh?

Science fiction? What’s next? A retinal scan a la Tom Cruise and another surcharge depending on a quick database search and your estimated net worth?

The payroll tax holiday is over. (Subject for another day but I don’t think we should do “payroll tax holidays”, ever.) Effective, January 27, merchants in 40 out of 50 states can assess a 2-4% surcharge for the privilege of using a credit card.

You can’t make this stuff up. But Issue 11 at Value Line, chock full of retailers, is probably as good as any time to talk about big pictures like aggregate consumption — and by definition, the relative health of the U.S. economy. As we chug through the updates this week, we notice things like the 3-5 year low price forecast for Coach (COH) dropping to $70 from $85. That may seem like a molehill, but the change in annualized total return forecast is a drop from 15% to 10%. We’ll certainly be taking a closer look at the collective opinion on Coach, from the consensus, Morningstar and S&P.

Share prices shares of companies like Macy’s, Target, J.C. Penney, and Best Buy performed horribly toward the end of 2012. As we slog through the updates, we’ll be watching for continued fundamental deterioration on a company-by-company and industry basis.

We’d call that five percentage point sag in the Value Line opinion material.

Some economists expect a few percentage point hit on GDP between tax increases, transaction cost offsets and the continued influence of deleveraging.

“Despite a deal to avert the fiscal cliff, consumer sentiment fell once again in early January, the University of Michigan’s index revealed on Friday. The decline, which follows a hard drop in December, was mainly caused by households with annual income below $75,000, as U.S. consumers face an estimated 4% contraction in disposable income because of tax increases in the first quarter. And it wasn’t just sentiment that dropped, as both the current conditions and the expectations indexes took a tumble in what can only be defined as a disappointing report.” — Forbes

Do you know what’s in your wallet? Come to think of it — do I even know where my wallet is?

Speedometers and Forecasts

Photo Credit: myoldpostcards via Compfight (Creative Commons)

by Ted Brooks (Guest Author)

I’ve been watching the relentless climb of the market this past month. Almost every day, it’s notching another decent though not astounding gain. But, start adding them up, and before we know it, a pretty good-sized move is in gear.

Meanwhile, you’ve been monitoring the return forecasts gauged by MIPAR (our median return composite forecast based on approximately 2400 analyses of stocks, Manifest Investing Projected Annual Return), the Value Line Median Appreciation Projection (VLMAP) and in recent times — the Value Line low total return forecast (VLLTR.) You haven’t pressed the alarm yet, but you’re probably eyeballing the alarm button.

One thing I’ve learned is –- no tool is perfect. That includes MIPAR or the Value Line-based close cousins.

That being said – a relatively simple tool that works reliably in most circumstances is a very valuable tool. As far as overpriced vs. underpriced, I think MIPAR tends to “cut through the crap” and give a fast and fairly reliable look at the relative giddiness or gloom of the market. Granted, the inputs may get a little skewed from time to time, but I don’t have a better idea to suggest.

I got to thinking about this last night after – of all things – helping a guy diagnose some errant behavior in the speedometer in his ’56 Chevy. A couple other people chimed in, but their diagnoses were incorrect, because weren’t thinking about how it actually measures road speed. Because, the simple fact is – a speedometer doesn’t measure road speed.

You may find the MIPAR vs. speedometer analogy enlightening. Well, at least I did.

Prior to the introduction of electronically controlled speedometers in the 1980s, speedometer technology had been pretty much the same since at least the early 1920s (earlier ones varied slightly). Here’s how a mechanical speedometer on a rear wheel drive car (like the ’56 Chevy) works:

The output shaft of the car’s transmission turns the drive shaft, which turns the rear axle assembly, which turns the rear wheels. There’s 2 speedometer gears inside the transmission – one mounted on the output shaft, and another that meshes with it. The latter gear drives a flexible steel cable. This rotating cable goes to the speedometer.

Inside the speedometer are two concentric magnetized drums. A coiled return spring, much like the mainspring on a clock, is attached to the outer drum. The speedometer needle is also attached to the outer drum.

As the cable turns the inside drum, the magnetism between the drums overcomes the return spring. The outer drum moves slightly from its resting position – and in proportion to the speed of the cable. As the outer drum moves, the attached needle moves across the calibrated face of the speedometer, giving a reading of miles (or kilometers) per hour.

So, a speedometer does NOT measure the road speed of the car. It measures the rotation of the output shaft of the transmission. While this technique works well regardless of what gear the transmission is in, if you change the gear ratio in the rear axle or the diameter of the tires, the speedometer will no longer read accurately. You then have to change the ratio of the speedometer gears in the transmission to make it read correctly.

Then, there’s the actual speedometer mechanism that sits inside the car. Even if this mechanism is cleaned and lubricated, it still may not read correctly if the magnetism of the drums isn’t carefully matched to the return spring. There’s a special tool used to adjust the level of magnetism on the drums until you get a “pretty good” reading. This adjustment is done by trial and error.

So, you see – no how, no way does a speedometer measure the road speed of the car. It uses several levels of “proxy” to estimate it. Yet – for decades, people depended on this technology to know how fast they were driving.

Now, when I compare MIPAR as a measurement of market exuberance – be it the overall market, or on a given stock – I recognize it too is a proxy method of measurement. It too has things that could cause it to read incorrectly. But, when I compare it with the method used to measure road speed of a car, I think MIPAR is the more robust methodology.

Ted Brooks
Individual Investor

Investing Round Table (January 2013)

Photo Credit: h.koppdelaney (With Permission) cc

We’ll get together again on Tuesday night, January 29 at 8:30 PM ET to share and explore some long-term investing concepts and ideas. You’re invited to join us as Ken Kavula, Cy Lynch, Hugh McManus and Mark Robertson share their current favorite four stocks.

Why should you care? Because it’s part of a long-term demonstration of success. Ideas are shared and analysis methods discussed. Are these noble knights right all of the time? Of course not. But they’ve been sticking their necks out for years — it’s not always easy.

Chances are, you just might discover an idea worthy of further study and analysis …

As the following graphic shows, the collective performance of the selections made since July-2009 (Round Table since inception) have now outperformed the Wilshire 5000 by nearly two percentage points (yes, annualized, of course). That’s a performance level rarely achieved by “average investors” but frequently experienced by practitioners in our community based on the methods and principles of the modern investment club movement.

The +5% line is the overall long-term objective. The lower line (closer to -5%) is known as the DALBAR line and is representative of results achieved by “average investors” from 1992-2012. We also think of those levels as an example of a “Lynch Mob.” Peter Lynch has shared his frustrating, gut-wrenching, stories of personal friends who managed to experience LOSSES investing in Fidelity Magellan during a 15-year period when he achieved historical and rarely-matched +13% relative returns. This can only be achieved by performance-chasing (buying high and selling low) and Lynch anguished over watching some of his friends getting wrecked by their emotions and lack of discipline.

And yes, Virginia, most months we poll the Round Table audience and they vote on the ideas presented. To date, the collective performance of their wisdom-by-community selections is +5.0% per annum. There are times when more heads are better than one.

The Journey of Investing

Investing is a journey. And like a good vacation in paradise, it’s often done better and enjoyed more when we do it with friends.

We believe that the Round Table is one more iteration of an investment club, intended to share and explore the best ideas and practices.

We’re not bashful about channeling Jack Palance (and Billy Crystal) and others when we do this. In the past, we’ve shared thoughts on Sharing: Big, How to avoid ending up on the wrong end of spears … how patience can be genius in disguise … why we want to invest more like Spock and less like Kirk … how cow-tipping and muskrat pageantry link with prudent long-term investing … and more.

Do we talk about selling? Absolutely. In fact, Synaptics (SYNA) has been very good to the Round Table tracking portfolio — but will probably get raked over the selling coals on Tuesday night.

Stocks likely to be discussed: AeroVironment (AVAV), Body Central (BODY), Landauer (LDR), Microsoft (MSFT)

Program Note: As we do with many webcasts, we open up the “Green Room” and leave the floor open for questions, answers and socializing for up to 30 minutes before the official start of the program.

Session Archive (YouTube):  January 2013 Round Table

Celebrating Heritage: Wall Street vs. Boondocks

Maybe it’s just the historian in me, but I think it can be very useful to go back and take a look at what we were exploring and talking about during October 2008.

Close your eyes. Remember the Bear Stearns meltdown? Merrill Lynch? Detroit was in the throes of another one of those generational 100-year floods known as automotive recessions.  The problem is that these now seem to happen every couple of decades or less. You could refinance your house with a signature over a fax machine. You could assume a mortgage several times larger than ever before and live in more house than you could ever really need … at the time. What could possibly go wrong?

Grab your favorite beverage and stoke up the fireplace. Read what was on our collective minds at the time.

Boondocks 4 years later 20130125

Maintaining Our Time-Honored Long-Term Perspective

I feel no shame, I’m proud of where I came from
I was born and raised in the boondocks

One thing I know, No matter where I go
I keep my heart and soul, In the boondocks …

It’s where I learned about [investin]’
Its where I learned about love
Its where I learned about working hard,
And having a little [edge] was just enough
It’s where I learned about Jesus
And knowin’ where I stand
You can take it or leave it
This is me. This is who I am.
Give me a tin roof, a front porch, and a gravel road
And that’s home to me, feels like home to me.

With certain apologies to the country band, Little Big Town, the last few weeks have presented an old-fashioned whumping of vast abuse to well-intended investors worldwide.

Part of Warren Buffett’s charm is that he hails from Omaha, Nebraska. In his words, it’s an advantage to be a thousand miles or so from lower Manhattan … in the boondocks so to speak. I believe it’s also been an advantage for legions of long-term investors that heed the wisdom and philosophies of George Nicholson and the modern investment club movement: EXPORTED FROM DETROIT.  What we do is Better Investing … yes, in the boondocks, with our focus on fundamentals, quality, excellence of management, building return forecast expectations and an effort to channel misguided emotion into the energy of opportunities.

Some Perspective: Halloween 2007

Lest we all forget, this agony actually started nearly one year ago. As Dan Hess observed, we’re now treated to 4-day and 4-hour bull and bear markets — marked by 20% swings in the major averages. The massive gains of Monday have already been eroded.

What’s going on?

We could do a full-hour version of Stephen Colbert’s Wag-of-My-Finger lambasting the guilty, but we’d run out of fingers before we ran out of hooligans.

Yes, the slowing economy, the housing bubble, irresponsible mortgage transactions (both ends), that oh-so-normal market paranoia and panic. But the core — at least to me — revolves around two main themes: (1) Greed and heinous liberties taken by “innovative” rhinos, and (2) the human condition that makes understanding cycles so challenging.

Volatility … It’s Hard to Call You a Friend, But We Must, We Must …

Make no mistake. This ain’t easy. It hurts to see balances in retirement accounts sag. Our Tin Cup model portfolio has gone from $450,000 to $620,000 and back to $481,700 in less than four days.

Very few stocks are immune from the symptoms. Equilibrium has been wrecked by the “innovative rhinos.” We’re seeing the effects of a MASSIVE breach of confidence and trust and it will take a while to restore equilibrium, independent of whatever flavor of recession we endure.

We hope you’ve enjoyed the contributions of Hugh McManus with respect to the banking challenges and opportunities whether he’s writing from the boondocks of Switzerland or California or any number of boondocks in between. Hugh and I have spent a fair bit of time trying to understand this “event” and we’ll probably take a closer look at Charles Morris’ Trillion-Dollar Meltdown in days ahead.

My take is that the credit default swaps (CDS) are literally a form of lottery ticket. The problem is that infinitesimal odds were in place … and redemption was never supposed to be an issue. We should know better. If the idiots responsible haven’t noticed that we’re having 100-year floods every 3-5 years now, they need some remedial math.

I still don’t understand how the “leverage thing” works when it comes to these lottery tickets, but I’m still working on it. It’s little different than if I wandered my neighborhood urging my neighbors to tear up their insurance policies. “I’ll cover your house for $100/month — no problem!” After knocking on (20) doors and collecting $2000/month in “premiums”, life is good. My favorite “innovative rhino” and I are going Maserati shopping together. Why worry? Not a single house has burned down in our neighborhood since we moved in over 10 years ago. No worries.

The disruption is massive and it hurts.

Our daughter is a teaching intern at a local high school. She came home with stories of how the educators are “bailing” on their 403(b) plans. Virtually every teacher has converted their holdings to “guaranteed income.”

But hope lives in the boondocks.

I’ve also received calls from several friends and family seeking investment opportunities. Our heritage keeps hope alive.

If fundamentals stay intact — and we’re stepping up our monitoring/updates of EPS results and forecasts, etc. — we see opportunity in the very shadows of a panic:

VLMAP (Value Line Median Appreciation Projection) has rarely ascended so rapidly. It’s now in places that beckon for the reverse gear on our investing trucks. But only if the long-term trends stay intact at levels to support the elevated return forecasts … we’ll be watching closely.

One More Time Around The Block in the Boondocks

History repeats. It simply does. And every time we go through things like this, we promise to learn from it and “do better next time.”

Next time is here.

At the risk of sounding like one of our presidential candidates, “My friends, we’ve been here before.”

As the accompanying chart shows, projected returns have soared to rarely-seen levels on a number of occasions in the past. If you’re a member of an investment club or individual investor who persisted in investing regularly, seeking the best companies at the best return expectations you know exactly where this is headed.

This 40-year profile of weekly VLMAP levels (the median projected annual price appreciation for the Value Line 1700 stocks) provides some interesting milestones:

1. 1974 Oil Embargo. Disruptions in oil supply, prices and waiting lines. Some of the best selections in the history of the Better Investing monthly Stock to Study were made during the mid-1970s.

2. Culmination of a really nasty recession. The start of the Reagan Expansion and approximate 20-year bull market — with speed bumps, of course.

3. Days of malaise. Better days were ahead. There are always better days ahead.

4. Desert Storm. Recessionary speed bump — advent to 10 of the best years investors have ever experienced.

We’re virtually certain to see this weekend’s VLMAP “lap” the field and move into either the #3 or #4 best investing time in the last 40 years. Note that the 2008 VLMAP peak is virtually even with the most promising days of late 1987.

… It’s All About a “Little” Edge

When Peter Lynch assumed the reins of Fidelity Magellan, his performance target was to beat the market by 2-3 percentage points. It doesn’t seem like much until you try it.

Here in the boondocks, we believe it’s prudent to aim for a five percentage point advantage relative to the overall market. Not everyone achieves the 5% advantage and George Nicholson “confessed” that he had no idea how aggressive this objective was at the time.

Solomon Select

The results of investing $100 into the Solomon Select featured stock each month since the inception of MANIFEST is shown in the accompanying figure:

The relative return for this tracking portfolio is a little more than 5 percentage points — versus matching investments in a total stock market index. The monthly selections have outperformed the total stock market benchmark with an accuracy rating of 59.1%. (The last time we checked, a typical accuracy rating for the CAPS stock picking experiment was on the order of 40%.)

Think of the voyage as a ship riding the cresting and bottoming waves. Our objective is to stay “above water” no matter how perfect the storm gets. (No George Clooney jokes, please.) Steadily maintaining this margin is one of the keys to successful long-term investing.

As Hugh shared earlier today, the measure of success isn’t necessarily the performance results versus any given benchmark — because achieving an 8% long-term return is vastly superior to stuffing Andy Rooney’s mattress .

A Clamor For Context

The average EPS growth rate for year-over-year results since 1970 has been 10%.

Problem is … average doesn’t happen very often. The annual results were 10% in 1979 and 1996.

Stock prices fluctuate. Return forecasts fluctuate. I hope nobody is surprised that EPS forecasts and results fluctuate. Historically, they fluctuate quite a bit. As the following figure shows, the range is pretty wide (-50% to +60%) and our EPS critter is pretty restless:

Truth is … the fluctuations have actually subsided in recent years.

The periods of recession according to the annointed economists who declare such things have been shaded. Note the EPS growth dips that generally accompany these recessionary periods.

Now take a look at our recent history and the projections for the next few years. There will be some differences due to sample and (I’m guessing) a large-company bias on the longer term Value Line results. How do the swings compare for recent years?

Right. Pretty steady, huh? This is the kind of stuff that snuffs memories and leads turnip-truck rhinos to declare that cycles have been repealed.

Those Cycles … They Can Beguile

I think one of the largest influences on the events of today is the reality that we have so little experience in dealing with economic/business cycles over the last 20 years. Look no further than the historical frequency of the gray highlighting (recessions) shown on that year-over-year EPS chart.

We used to get a whole lot more practice at these “things” called recessions.

Now, hands are a-wringing and the whining is saturated with adjectives that include things like Armageddon, holocaust and doomsday. Make no mistake, I certainly know that the pain is real but context, perceptions and perspectives have been assaulted. My family and I live at one of the epicenters … or should I say Ground Zero? … to pour on the emphasis? Many of our friends, family and neighbors work for either Chrysler, Ford or General Motors.

We started this conversation with blame distributed among (1) greedy rhinos and their opaque playground, and (2) the challenge of cycle recognition. Turns out the two are related …

In an interesting display of “leadership” that can only be framed as “Be Afraid, Be Very Afraid” , an automotive executive shared the following:

The times for the auto industry are not just unimaginable, but “truly unimaginable,” he wrote. And also “challenging,” he added three sentences later.

The current economic period is not just difficult, but “the most difficult any of us can remember.”

Truly unimaginable? Really? Somehow defense attorney Demi Moore in A Few Good Men comes to mind.

Demi: “I object!”

Judge: Over-ruled!

Demi: “Then I STRENUOUSLY object!!!”

The problem is … he’s wrong. (Or simply afflicted with short or very selective memory)

Check out the long-term track record for the sale of domestic light-duty vehicles over the last thirty years or so:

Breaking it down into year-over-year comparisons provides a better/closer look at the situation replete with a number of cycles and historical challenges:

By the way, those 2009 forecasts are deemed worst-case scenarios according to think tanks and economists in their research.

And 2008 probably isn’t even in the Top Ten Worst … yet.

The point is that we’ve clearly been here before. Granted, the specific aspects of the challenge are different but from the larger perspective, cycles have been cycles and will continue to be cycles for the forseeable and unforseeable future.

There are cases where our analysis would be well-served to include much more than 10 years of retrospective. It’s something we’ll be taking a much closer look at because we believe that cycles will be cycles … and they deliver beguiling challenges.

When The Music Stops … Will You ‘Own’ A Chair?

Dan Hess is right about yesterday’s market surge. And frankly, it’s precisely one of the things I consider the most dangerous about these times that we live in. We all remember the childhood game of musical chairs.

Our daughter, newly-minted degree from Michigan State in hand, is a teaching intern at a local high school. As the latest episode of market turbulence has erupted, she’s shared stories of teachers seeking refuge in their 403(b) plans by converting their equity-based holdings to cash or “guaranteed return” options.

The music will stop.

As Warren Buffett has shared in his op-ed a couple of weeks ago, no one — not even the Oracle of Omaha himself — can say when, where and how much … but the music will stop.

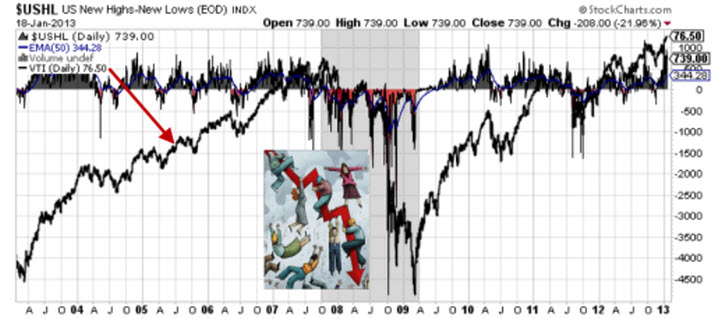
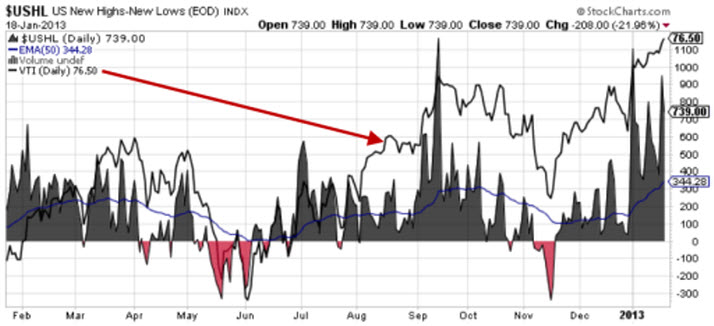
Here’s a look at a one-day chart of market performance. Again, I emphasize that this one day would have been representative of greater than 50% of most market * years * of stock market heritage.

String several days like this together and SUDDENLY an entire wing of gifted, but fugitive, educators (and a nation of “average” investors) has been left in a chilling wake of forfeited opportunity.

Follow the Money

We’ve been hearing a lot about “huge piles of cash” on the sidelines and in doing some homework, I’ve discovered an area ripe for even more confusion. When we look at the cash levels in the average equity funds, it’s running about 4.5% at the present. This ranges from 2-10% (approximately) over the years. Many pundits are looking at these cash levels and suggesting, “it’s not that high.”

These levels are driven/influenced by: (1) relative interest rate levels, and (2) redemption activity. With low interest rates and fund managers struggling to cover redemptions, I’m not surprised at all that the level is so “low.”

When we make a comparison of cash accounts versus total assets, the picture changes considerably:

Source: SeekingAlpha: Cash Levels & Signals of a Market Bottom

Study this closely. This is what the gasoline for the engine called “Sudden” looks like. Much has been made that some of these intra-day major moves in the market have been on low trading volume. Many of the rhinos are sleeping or treading water. They never sleep for ever.

The current cash/assets ratio is approximately 32%. [Source: www.ici.org]

None of us know what the bottom looks like or if we’re any where near it. But history teaches us about the chilling wake. Ken Fisher recently shared during a Bloomberg interview that every time he hears, “But … it’s different this time …” he immediately begins shopping for high-quality companies for the long haul.

Historically, investors have increased cash positions during bear markets but have been slow to reallocate to stocks. Sudden corrections — and sudden rallies — have been a normal part of the stock market over time, and attempting to move in and out of it can be a costly endeavor.

Our family is steadily committing cash positions in our retirement accounts to the likes of companies featured here perpetually at Manifest Investing. We believe in the long-term perspective for world class companies — no matter where they’re domiciled. We believe in the resilience of the American people, our leadership companies, and the dogged nature with which we’ve always tackled the challenges that confront us. We may not know a market bottom when we see it, but we know what avoiding the lure of musical chairs has meant for hundreds of thousands of effective long-term investors over several decades.

… knowin’ where I stand
You can take it or leave it
This is me. This is who I am.
Give me a tin roof, a front porch, and a gravel road
And that’s home to me, feels like home to me.

Thanks for listening. 🙂

Shop and study at will.

Mark Robertson

Can Investing Really Be This Simple?

We believe that the answer is a resounding “Yes!” Manifest, even.

Our mission? Simplify investing.  Transform the experience of individual investors into something less mysterious, less stressful and more successful. We believe that the most important characteristics of any investment are the expected returns for a long term horizon and its quality, or investment grade. We believe that these two characteristics can be applied to any stock or fund (portfolio) and that they form the foundation of understanding and optimizing portfolio design and management.

Manifest Investing

Why Manifest Investing? Because the biggest challenge and inhibitor confronting the average individual investor is the confusion and fear that most people feel when faced with selecting and managing a portfolio of investments. We’re treated to agonizing images of “investors” on television attempting a root canal or brain surgery on themselves. The message from Wall Street is painfully clear: You can’t do this on your own.

Don’t believe it.

Our choice of MANIFEST lies in its very definition: to show or demonstrate plainly; a list… according to owner and location.

Image

We know that most things in life become easier when we understand them better. While working to remove the mystery and fear (often with groups of friends and colleagues) we discover that the challenge is not nearly as difficult nor intimidating as some would like us to believe. Whether you choose to work with an investment professional, financial planner or do-it-yourself, building a better (but rapid) understanding of the alternatives will improve your investing experience.

You can do this.

You can be an effective investor. We have witnessed this first hand in our work with groups of employees as they come to understand the choices facing them in their 401(k) plans. Yes, the decisions are still ultimately their own, but the understanding provides a degree of comfort and confidence in their quest to make effective choices.

A manifest can also be a list. People like lists. We believe a great deal may be learned from lists. Even when investing in mutual funds, it’s important to know what you own and why you own it. Every day, the stock market chaos and noise can obscure the reality that effective long-term investing means that we OWN a stake in our enterprises. This is even true with our mutual funds. What decisions has the fund manager made on our behalf? What do we own? Why?

A Foundation of Simplicity

The behavior of “average investors” provides one of the most puzzling riddles in the universe. How many pairs of shoes are “enough” for my wife and daughter is another riddle, for another day. It’s all about shopping.

Picture this. You and a bunch of your neighbors are sitting around the house talking about buying your next car. Collectively, as a well-formed herd, you and your neighbors head to the local dealership to all shop at the same time at the same place. You lead the way. A salesman snares you and you ask, “Which car has been getting the most attention with the largest increases in price lately? My friends and I want to fight over it and continue to drive up the price.” Isn’t this a dream scenario for the salesperson?

Sound a little far-fetched?

The sad part is that it’s actually a fairly precise description of stock market mania lived out daily by the majority of the professional herd and “average investors” around the world.

We need a better perspective.

The answer lies in understanding just two things about any potential investment: (1) quality and (2) the returns that we might reasonably expect to achieve over the long term.

The solution resides in seeking a quiet moment to build reasonable expectations about the future of your investment. We must learn to ignore the noise and focus on long-term potential.

Quality: A Measure of Excellence

ImageSimply put, quality is a measure of excellence. Excellent companies are those who have earned our respect and recognition. These companies deliver consistent operating results.

When it comes to strategic long-term investing, quality matters. It’s important that we understand and respect quality as we study and select our investments.

Manifest Investing builds a quality rating, a score from 0-to-100, for companies in our database. We’ll explore the details later, but in a nut shell, we examine the relative growth characteristics, relative profitability, financial strength and earnings stability and generate a quality rating, or score. The growth and profitability characteristics are scored relative to their industry peers. The highest possible rating is 100. We find that the best companies (those in the top 20% of the database) achieve quality ratings of 65 or greater. You will see this color-coded in the newsletter and web site with a blue quality score. Think blue chips. Good companies, those ranking in the next 20% of all companies are color coded green with quality ratings between 55 and 65.

The lowest quality ratings (less than 35) are coded in red and should generally be avoided.

You probably won’t hunt for your next car with all of your neighbors in tow and you probably won’t walk in and ask to see the cars with the worst reliability. Shopping for stocks and promising mutual funds is no different. If we’re to own them for a few years or decades (should conditions warrant) we want to identify the best. You may have used Consumer Reports ratings to support your search for that last automobile purchase. This is no different. Quality matters.

We want the best and we want to know when they’re on sale.

Return Forecasts: When is the Price Right?

When are stocks on sale?  It depends on the return forecast.

How does the stock compare to the average return right?  How does your stock’s return forecast compare to other holdings and the overall portfolio?

This, too, is a subject we’ll examine more closely in subsequent issues but the condensed explanation is that we apply a long-term sales growth forecast, an estimated net margin and a projected average P/E to generate a projected price expectation. The projected annual return (PAR) is the sum of the price appreciation from the current price and the expected impact of dividends.

We believe that an emphasis on quality and the expected returns for the stocks we evaluate is a great place to start.

Can investing really be this simple? Absolutely. Welcome. We hope you enjoy your investing experience.

Market Barometers (Extended Version)

This week with the market teetering near all-time highs, we need to think of potential inflection points … and explore the foundations of this rally. We’ll take a look at a number of indicators from a Big Picture perspective. Many of the economic and market factors are inspired by lessons shared by Barry Ritholtz.

This is a work-in-progress, something of a lab … but we’ll work towards an executive summary that attempts to capture the messages and signals from this collection of market barometers.

For now, I think they all add up to a fairly neutral condition. In the short term, some of those recent and quite rapid price gains probably dictate a speed bump or breather.

Value Line Low Total Return Forecast (VLLTR)

The Value Line low total return forecast (VLLTR) celebrated its WSJ MarketWatch appearance by dipping below 8.0% this week, now at 7.9% vs. 8.2% last week.

At 7.9% vs. a long-term average of 8.5%, we’d consider this relatively neutral. We’ll start to get more concerned if VLLTR continues to drift downward (this can be a result of increasing stock prices or degradation of fundamentals — or a combination of both.) Right now, we’re seeing a combination of both — a potentially vulnerable recipe.

Total Stock Market: Trends and Relative Strength Index

Sentiment: $USHL Indicator

We think this indicator adds to a more complete understanding of how to recognize the advent of bear markets. It takes a little getting used to — but it’s worth the journey.

We reviewed a number of references (including Dr. Elder and a Ritholtz post from 2006 by Paul Desmond of Lowry’s) about the relevance of breadth as a confirming indicator. Here’s a couple of excerpts from http://www.ritholtz.com/blog/2011/02/qa-paul-desmond-of-lowrys-part-ii/

BR: OK, all kidding aside, let’s talk a little more specifically about your most recent paper analyzing market tops. You’ve put forth the idea that markets at tops give very identifiable signals, that markets can be timed, that “buy-and-hold” really ignores a lot of information that comes at you. Is that a fair statement?

PD: Yes, it is very fair. I think the problem is there are an awful lot of investors who will say you can’t time the market.

BR: Well they are saying ‘they’ can’t time the market. They’re not saying ‘you’ can’t time the market (laughs).

PD: ‘They’ can’t time the market. And I think what they are doing is looking at fundamental information. And if you are looking at fundamental information, I think you are absolutely right. You cannot time the market off of fundamental information, because the stock market operates off of expectations as to what is going to happen six months or nine months down the road. In other words, investors don’t buy stocks because of what they know today. They buy because of what they think they are going to know six months or nine months from now. So the market is always ahead of the economy. And as a result, if you are trying to look at fundamental information, you are always too late. If you look at technical information, you can see signs of changes in investor psychology that are consistent from top to top. And that’s what this study that we just did shows very clearly, is that there is an extremely repetitive pattern that occurs at major market tops, and that pattern is one of selectivity.

Keep in mind that we’re looking for market indicators that would support (1) emphasis on quality and (2) strategic asset allocation, i.e. cash equivalents as %-of-total assets.

We’ve been looking for a while for an answer to the questions about MIPAR as our return forecast indicator(s) “hover” at low levels for an extended period.

The work by Dr. Elder leans heavily on the levels of new highs and new lows (consistent with what Desmond was describing in that 2006 interview.) Here’s a look at a 10-year chart of the $USHL indicator on StockCharts.com …

$USHL 10-Yr 20130118R

There are couple of major takeaways. We think what really matters is the trailing quarter exponential moving average for this index (blue line in the chart). We also notice that summer time speed bumps (magenta shaded negative areas frequently seen around July) are very, very normal.

Here’s a look at recent history. Again, it’s the blue line that matters.

$USHL 1-Yr 20130118R

And that blue line is strong.

This longer term perspective on the $USHL indicator could quickly become a favorite. Note the break from positive to negative at the onslaught of the 2008 bear market for the trailing average.

$USHL 10-Year Mo 20130118R

Morningstar Fair Value

This indicator seems to “live” in the 0.85-to-1.10 neighborhood. A reading of 1.01, suggesting a smidge of overvalue — is historically pretty neutral.

Morningstar Fair Value 10-Year 20130118R

Transports

Some pretty hefty gains in this group of late — and the PAR for the Dow Jones Transports has been driven down to 7.1%. This would become a negative signal if the PAR approaches 3%, particularly if signs of fundamental weakness (reduced EPS forecasts) materialize.

There’s still considerable strength in FedEx (FDX) and UPS (UPS).

Retail

The first graphic is the long-term trend for the Consumer Discretionary sector.

And it’s here that there’s considerable apprehension because of the present threats to disposable income. Less money in our wallets and some things are more discretionary than others. Weakness in the companies displayed here probably translates to a economy-wide migraine. 4Q2012 and 1@2013 earnings reports are important along with the 2014 forecasts as they take shape.

Utilities & Staples

As Barry Ritholtz suggested, these sectors are where we watch for exodus and flight-to-safety behavior. Not much to report on the utility side … and we’re vigilant for anything resembling that pre-2008 recession spike in Staples volume. Basically, people were pouring into the Staples stocks without much regard for return expectations — a sign of a deep correction or recession. For now, Staples volume appears relatively normal.