
This week with the market teetering near all-time highs, we need to think of potential inflection points … and explore the foundations of this rally. We’ll take a look at a number of indicators from a Big Picture perspective. Many of the economic and market factors are inspired by lessons shared by Barry Ritholtz.
This is a work-in-progress, something of a lab … but we’ll work towards an executive summary that attempts to capture the messages and signals from this collection of market barometers.
For now, I think they all add up to a fairly neutral condition. In the short term, some of those recent and quite rapid price gains probably dictate a speed bump or breather.
Value Line Low Total Return Forecast (VLLTR)
The Value Line low total return forecast (VLLTR) celebrated its WSJ MarketWatch appearance by dipping below 8.0% this week, now at 7.9% vs. 8.2% last week.
At 7.9% vs. a long-term average of 8.5%, we’d consider this relatively neutral. We’ll start to get more concerned if VLLTR continues to drift downward (this can be a result of increasing stock prices or degradation of fundamentals — or a combination of both.) Right now, we’re seeing a combination of both — a potentially vulnerable recipe.

Total Stock Market: Trends and Relative Strength Index


Sentiment: $USHL Indicator
We think this indicator adds to a more complete understanding of how to recognize the advent of bear markets. It takes a little getting used to — but it’s worth the journey.
We reviewed a number of references (including Dr. Elder and a Ritholtz post from 2006 by Paul Desmond of Lowry’s) about the relevance of breadth as a confirming indicator. Here’s a couple of excerpts from http://www.ritholtz.com/blog/2011/02/qa-paul-desmond-of-lowrys-part-ii/
BR: OK, all kidding aside, let’s talk a little more specifically about your most recent paper analyzing market tops. You’ve put forth the idea that markets at tops give very identifiable signals, that markets can be timed, that “buy-and-hold” really ignores a lot of information that comes at you. Is that a fair statement?
PD: Yes, it is very fair. I think the problem is there are an awful lot of investors who will say you can’t time the market.
BR: Well they are saying ‘they’ can’t time the market. They’re not saying ‘you’ can’t time the market (laughs).
PD: ‘They’ can’t time the market. And I think what they are doing is looking at fundamental information. And if you are looking at fundamental information, I think you are absolutely right. You cannot time the market off of fundamental information, because the stock market operates off of expectations as to what is going to happen six months or nine months down the road. In other words, investors don’t buy stocks because of what they know today. They buy because of what they think they are going to know six months or nine months from now. So the market is always ahead of the economy. And as a result, if you are trying to look at fundamental information, you are always too late. If you look at technical information, you can see signs of changes in investor psychology that are consistent from top to top. And that’s what this study that we just did shows very clearly, is that there is an extremely repetitive pattern that occurs at major market tops, and that pattern is one of selectivity.
Keep in mind that we’re looking for market indicators that would support (1) emphasis on quality and (2) strategic asset allocation, i.e. cash equivalents as %-of-total assets.
We’ve been looking for a while for an answer to the questions about MIPAR as our return forecast indicator(s) “hover” at low levels for an extended period.
The work by Dr. Elder leans heavily on the levels of new highs and new lows (consistent with what Desmond was describing in that 2006 interview.) Here’s a look at a 10-year chart of the $USHL indicator on StockCharts.com …
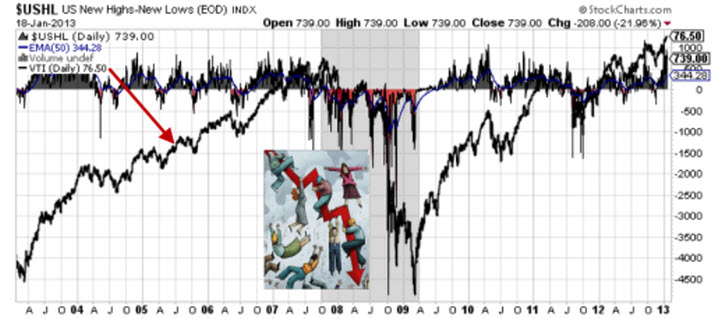
There are couple of major takeaways. We think what really matters is the trailing quarter exponential moving average for this index (blue line in the chart). We also notice that summer time speed bumps (magenta shaded negative areas frequently seen around July) are very, very normal.
Here’s a look at recent history. Again, it’s the blue line that matters.
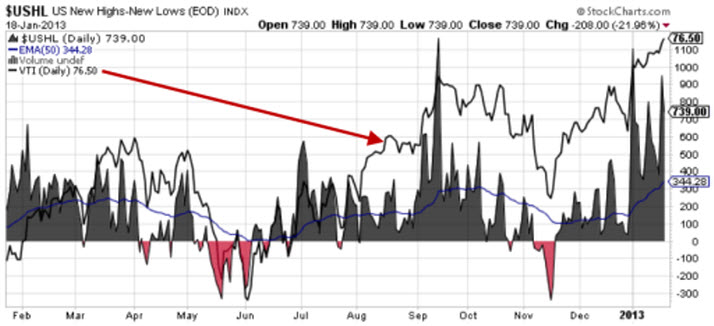
And that blue line is strong.
This longer term perspective on the $USHL indicator could quickly become a favorite. Note the break from positive to negative at the onslaught of the 2008 bear market for the trailing average.
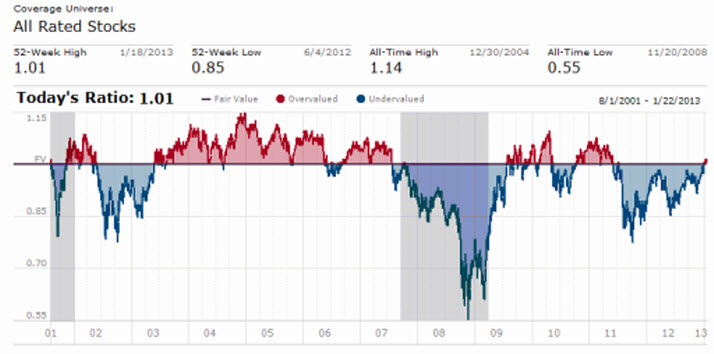
Morningstar Fair Value
This indicator seems to “live” in the 0.85-to-1.10 neighborhood. A reading of 1.01, suggesting a smidge of overvalue — is historically pretty neutral.
Transports
Some pretty hefty gains in this group of late — and the PAR for the Dow Jones Transports has been driven down to 7.1%. This would become a negative signal if the PAR approaches 3%, particularly if signs of fundamental weakness (reduced EPS forecasts) materialize.
There’s still considerable strength in FedEx (FDX) and UPS (UPS).

![]()


Retail
The first graphic is the long-term trend for the Consumer Discretionary sector.
And it’s here that there’s considerable apprehension because of the present threats to disposable income. Less money in our wallets and some things are more discretionary than others. Weakness in the companies displayed here probably translates to a economy-wide migraine. 4Q2012 and 1@2013 earnings reports are important along with the 2014 forecasts as they take shape.


Utilities & Staples
As Barry Ritholtz suggested, these sectors are where we watch for exodus and flight-to-safety behavior. Not much to report on the utility side … and we’re vigilant for anything resembling that pre-2008 recession spike in Staples volume. Basically, people were pouring into the Staples stocks without much regard for return expectations — a sign of a deep correction or recession. For now, Staples volume appears relatively normal.


